 Open Access Article
Creative Commons Attribution 3.0 Unported Licence
Comparative study of the photocatalytic performance for the degradation of different dyes by ZnIn2S4: adsorption, active species, and pathways†
Tingting Liu,
Lei Wang *,
Xue Lu,
Jiamin Fan,
Xinxin Cai,
Bo Gao,
Rui Miao,
Jiaxuan Wang and
Yongtao Lv
Key Laboratory of Membrane Separation of Shaanxi Province, Xi'an University of Architecture and Technology, Yan Ta Road, No. 13, Xi'an 710055, China. E-mail: wl0178@126.com; Fax: +86 02982202729; Tel: +86 02982202729
First published on 21st February 2017
Abstract
A comparative study of the photocatalytic performance for the degradation of rhodamine B (RhB) and methyl orange (MO) by ZnIn2S4 under visible light irradiation was investigated based on the adsorption of dyes, the active species generated during the photocatalytic process and the degradation pathway. The results show that 97.8% of RhB and 5.6% of MO were degraded under the same conditions, respectively. Photocatalytic degradation of RhB was obviously superior to degradation of MO. The adsorption of MO was almost negligible and 56.8% of RhB was adsorbed on ZnIn2S4. Superoxide radical was the key active species, and hydroxyl radical played a supplementary role during photocatalytic process. Different chemical bonds with different bond energies were destroyed when degradation of RhB and MO. Photocatalytic degradation of RhB was superior to that of MO because the excellent adsorptivity of RhB than that of MO, and the C![[double bond, length as m-dash]](https://www.rsc.org/images/entities/char_e001.gif) N bond of RhB was easier destroyed compared with azo bond of MO under the same conditions. The photocatalytic degradation of MO in a system in which superoxide radical was key active species can be improved by adding hole scavengers to inhibit recombination of holes and electrons, which would result in more electrons reducing oxygen to superoxide radical.
N bond of RhB was easier destroyed compared with azo bond of MO under the same conditions. The photocatalytic degradation of MO in a system in which superoxide radical was key active species can be improved by adding hole scavengers to inhibit recombination of holes and electrons, which would result in more electrons reducing oxygen to superoxide radical.
1. Introduction
Organic synthetic dyes have been used widely in many fields such as the textile, food, cosmetic and pharmaceutical industries. In terms of their chemical structure, organic synthetic dyes can be divided into different categories; e.g., azo, anthraquinone, xanthene, etc.1 Xanthene dyes are common synthetic dyes, which are often used as laser materials and color additives. Azo dyes are characterized by the presence of the azo bond (–N![[double bond, length as m-dash]](https://www.rsc.org/images/entities/char_e001.gif) N–) in their molecules and account for about 70% of synthetic dyes.2 Organic synthetic dyes have excellent stability, which results in large amounts of wastewater containing dyes being released into the environment.3 The color of wastewater containing dyes can inhibit photosynthesis of aquatic plants and cause deterioration of water quality. Carcinogenic and toxic effects of dyes are harmful to human beings and aquatic life.4–6
N–) in their molecules and account for about 70% of synthetic dyes.2 Organic synthetic dyes have excellent stability, which results in large amounts of wastewater containing dyes being released into the environment.3 The color of wastewater containing dyes can inhibit photosynthesis of aquatic plants and cause deterioration of water quality. Carcinogenic and toxic effects of dyes are harmful to human beings and aquatic life.4–6
As an advanced oxidation process, photocatalytic oxidation has received increasing attention because of its high efficiency and low energy consumption.7 Moreover, photocatalytic technology is harmless to environment because the organics can be completely mineralized into CO2 and H2O during photocatalytic process.8
A large number of researches have examined the development of photocatalysts that can be excited under visible light since ultraviolet (UV) light accounts for only 7% of sunlight, while visible light accounts for more than 45%.9–12 For example, methylene blue could be degraded by WO3 under visible light.13 Priya et al. synthesized Bi2O3/BiOCl which could effectively mineralized antibiotics under solar light.14 Among the visible-light-driven photocatalysts, ZnIn2S4 has received more attention because of its excellent photocatalytic activity. Fang et al. studied the effect of reaction temperature, reaction time and solvent on the formation of ZnIn2S4 and photocatalytic activity for the degradation of methyl blue.15 Shen et al. synthesized ZnIn2S4 which could effectively reduce H2O to H2 via a hydrothermal method based on cetyltrimethylammonium bromide.16
During the photocatalytic process, organics were degraded through direct hole oxidation and indirect free radical oxidation.17 The photocatalyst was excited when it was irradiated with incident light whose energy was greater than or equal to the band gap energy of the semiconductor photocatalyst. The electrons in the valence band could transit to the conduction band to form electron–hole pairs. The photogenerated electrons and holes take advantage of water, hydroxides (OH−) and oxygen (O2) in the environment to form free radicals that can effectively mineralize organics into CO2. Electrons and holes can also recombine during the photocatalytic process, resulting in a reduction of the photocatalytic degradation efficiency.
Generally, the holes and the active species generated during the photocatalytic process are nonselective, and the organics can be degraded as long as the redox potential of the holes and the active species are higher than that of the organics.18 However, a large number of studies have shown that the same photocatalyst may perform differently for different organics. The degradation of MO by Ag3PO4 dodecahedrons under acidic condition was significantly superior to that of RhB, but the adsorption of RhB was better than that of MO.19 Chen et al. prepared hexagonal and cubic ZnIn2S4 with different raw materials, which had different photocatalytic performances and mechanisms for degradation of rhodamine B (RhB) and methyl orange (MO).20 Therefore, it is necessary to explore the mechanism of different photocatalytic performance for different organics with the same photocatalyst.
In this study, the different performance for the adsorption and degradation of RhB and MO by ZnIn2S4 were investigated. The active species in the system of ZnIn2S4 photocatalytic degradation of dyes were identified by EPR and in situ capture experiments. Intermediates were identified by liquid chromatography mass spectrometry-ion trap-time of flight (LCMS-IT-TOF), and the pathways for photocatalytic degradation of RhB and MO were proposed. The results of the adsorption performance and the active species generated during the photocatalytic process were combined with the pathway of ZnIn2S4 photocatalytic degradation of dyes to obtain the mechanism for achieving the different photocatalytic performance for degradation of different dyes. The conclusions may provide a theoretical basis for improved degradation of dyes.
2. Materials and method
2.1 Materials and reagents
Zn(NO3)2·6H2O (AR) was purchased from Sinopharm Chemical Reagent Co., Ltd. In(NO3)2·5H2O (AR), thioacetamide (TAA, AR), RhB (AR), MO (AR) and ethylene diaminetetraacetic acid (EDTA, AR) were obtained from Tianjin Kemiou Chemical Reagent Co., Ltd. Isopropyl alcohol (AR) and benzoquinone (99%) was purchased from the Aladdin Industrial Corporation. 5-tert-Butoxycarbonyl 5-methyl-1-pyrroline N-oxide (BMPO) and superoxide dismutase (SOD) were purchased from Dojindo Molecular Technologies, Inc and Sigma Aldrich Co., LLC, respectively. All chemicals were used without further purification.2.2 Synthesis of ZnIn2S4
ZnIn2S4 was prepared in accordance with previous literature as follows:21 0.75 mmol Zn(NO3)2·6H2O, 1.5 mmol In(NO3)2·5H2O and excessive TAA (12 mmol) were dissolved in 150 mL deionized water. The mixture was stirred for 10 min and transferred into a 200 mL Teflon-lined autoclave. The autoclave was put into a vacuum oven and kept at 80 °C. After 6 h, the reaction was completed, and the autoclave was cooled to room temperature. The sample was washed several times with water and ethanol, and dried at 60 °C for photocatalytic reaction. The properties of ZnIn2S4 have been adequately characterized in previous literatures.21,222.3 Characterization
The specific surface area of the as-prepared ZnIn2S4 was determined by V-sorb 2800P BET analyzer (Gold APP Instrument Corporation, China). The chemical composition of the as-prepared ZnIn2S4 was characterized by K-Alpha X-ray photoelectron spectroscopy (Thermo Scientific, USA). UV-Vis absorption spectra of the as-prepared ZnIn2S4 was measured using U-4100 UV-Vis spectrophotometer (Hitachi, Japan) from 300 to 1000 nm.2.4 Photocatalytic experiment
The photocatalytic experiments were conducted in a CEL-WLAX visible-light photochemical system (China Education Au-light, China). A 500 W xenon lamp emitting 300–900 nm visible light was installed horizontally on top of the box, and a magnetic stirrer was placed below the lamp. The distance between the lamp and the magnetic stirrer was 0.6 m. In the reaction for the degradation of the RhB, 0.04 g ZnIn2S4 was added into 400 mL RhB solution (initial concentration was 15 mg L−1). In the reaction for the degradation of the MO, 0.04 g or 0.12 g ZnIn2S4 was added into 400 mL MO solution (initial concentration was 15 mg L−1 or 5 mg L−1, respectively). Before irradiation, the suspensions were stirred magnetically for a period of time in darkness to establish an adsorption/desorption equilibrium. Samples were taken at certain time intervals and filtrated with 0.22 μm filtrater to remove the ZnIn2S4 for analysis.The absorbance of RhB and MO was measured by UV-2600 UV-Vis spectrophotometer (Unico, China) at wavelengths of 553 nm and 464 nm, respectively. Eight standard solutions were prepared to generate a calibration curve in the range of 0.1–25 mg L−1, and the concentrations of RhB and MO in the irradiated solution were determined from the calibration curves. The photocatalytic degradation efficiency of the dye was evaluated with C/C0, where C was the concentration of dye at each irradiated time interval, and C0 was the initial concentration of the dye. The UV-Vis spectra of the degradation solution at each irradiated time interval were monitored by spectrophotometer under full scan mode. Zeta potentials of ZnIn2S4 was measured by zeta analyzer (Malvern, UK).
2.5 In situ capture experiment
In situ capture experiments were conducted to investigate the active species generated during the ZnIn2S4 photocatalytic process. EDTA, benzoquinone and isopropyl alcohol were used as scavengers introduced into the photocatalytic process to capture holes, superoxide radical (˙O2−) and hydroxyl radical (˙OH), respectively. The concentrations of the EDTA and benzoquinone were both 1 mmol L−1, and 0.1 mL isopropyl alcohol was added into 400 mL reaction solution.2.6 Electron paramagnetic resonance spectroscopy
For detection of free radicals, EPR (Bruker, Germany) was used to record signals of spin adducts that were produced by active free radicals reacting with BMPO under visible light irradiation. BMPO was used as a scavenger to capture ˙O2− and ˙OH to form relatively stable adducts, and the types of free radical were distinguished according to the EPR spectra of the adducts. Superoxide dismutase (SOD) is an enzyme that can catalyze ˙O2−, but it did not react with ˙OH.According to different experimental conditions, ZnIn2S4 (0.1 g L−1 or 0.3 g L−1), BMPO (40 mM), RhB (15 mg L−1), MO (5 mg L−1) and SOD (400 U mL−1) were mixed together and irradiated under visible light for 4 min. Each sample was then moved into a capillary and sealed. The capillary was put into a quartz tube, which was inserted in the EPR cavity. The EPR should be tuned before measurement. The EPR parameters for all samples were as follows: center field = 3510 G, sweep width = 100 G, microwave frequency = 9.85 GHz, microwave power = 6.325 mW, modulation frequency = 100 kHz.
2.7 LCMS-IT-TOF analysis
LCMS-IT-TOF (Shimadzu, Japan) was used to identify intermediates formed during the photocatalytic process. The separation column was a Thermo HPLC Betasil C18 column (2.1 mm i.d. × 150 mm, 3.5 μm particles), and the column temperature was set at 40 °C. The mobile phases were methanol![[thin space (1/6-em)]](https://www.rsc.org/images/entities/char_2009.gif) :
:![[thin space (1/6-em)]](https://www.rsc.org/images/entities/char_2009.gif) water = 63
water = 63![[thin space (1/6-em)]](https://www.rsc.org/images/entities/char_2009.gif) :
:![[thin space (1/6-em)]](https://www.rsc.org/images/entities/char_2009.gif) 35 (v/v) for RhB detection and acetonitrile
35 (v/v) for RhB detection and acetonitrile![[thin space (1/6-em)]](https://www.rsc.org/images/entities/char_2009.gif) :
:![[thin space (1/6-em)]](https://www.rsc.org/images/entities/char_2009.gif) 0.1% formic acid = 25
0.1% formic acid = 25![[thin space (1/6-em)]](https://www.rsc.org/images/entities/char_2009.gif) :
:![[thin space (1/6-em)]](https://www.rsc.org/images/entities/char_2009.gif) 75 (v/v) for MO detection. The flow rate was maintained at 0.3 mL min−1, and the injection volume was 20 μL. RhB was detected at wavelengths of 553 nm and 500 nm under dual-channel mode, and MO was detected at a wavelength of 464 nm. MS spectrometry was operated in positive and negative mode for RhB and MO analyses, respectively.
75 (v/v) for MO detection. The flow rate was maintained at 0.3 mL min−1, and the injection volume was 20 μL. RhB was detected at wavelengths of 553 nm and 500 nm under dual-channel mode, and MO was detected at a wavelength of 464 nm. MS spectrometry was operated in positive and negative mode for RhB and MO analyses, respectively.
3. Results and discussion
3.1 Degradation of RhB and MO by ZnIn2S4
The variation of C/C0 of RhB and MO as a function of time under different conditions is shown in Fig. 1. The results include adsorption of RhB and MO on ZnIn2S4 in darkness and the photocatalytic degradation in the presence of ZnIn2S4 under visible light irradiation.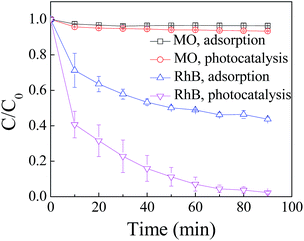 | ||
| Fig. 1 Degradation of RhB and MO by adsorption and photocatalysis. The concentration of RhB and MO was 15 mg L−1 and the dosage of ZnIn2S4 was 0.1 g L−1. | ||
Differences in the performance with respect to adsorption and degradation of RhB and MO by ZnIn2S4 are apparent. Adsorption of MO by the ZnIn2S4 was almost negligible and 56.8% of RhB was adsorbed on ZnIn2S4 in darkness. Photocatalytic degradation of RhB was obviously superior to the degradation of MO. In 90 min of photocatalytic reaction, 97.8% of the RhB was removed whereas only 5.6% of the MO was degraded under the same conditions.
Generally speaking, the greater specific surface area represents the larger adsorption capacity of organic molecules, which lead to superior photocatalytic performance. Nitrogen adsorption–desorption isotherms and the pore size distribution plot of ZnIn2S4 are shown in Fig. A.1.† The specific surface area of as-prepared ZnIn2S4 is 79.03 m2 g−1 and the type of isotherms indicates that greater uniform mesopore distribution. Therefore, excellent adsorption capacity of RhB was attributed to large specific surface area of ZnIn2S4. However, specific surface area of ZnIn2S4 is constant for adsorption of RhB and MO, hence, it is necessary to explore the reason of different adsorption performance for RhB and MO with ZnIn2S4.
Because RhB is a cationic dye and MO is an anionic dye, the different surface charge properties of RhB and MO may have affected the adsorptivity of the photocatalyst, which resulted in different photocatalytic performance in the degradation of different types of dyes.23,24 The pH of solutions of RhB and MO were 4.81 and 5.25, respectively. The acid dissociation exponent of the carboxyl group of RhB is 4.1 and pKa of MO is 3.4.25 Therefore, carboxyl group of RhB dissociated and presented in system at negative charged –COO− state and MO was negative charged under investigated condition. The zeta potentials of ZnIn2S4 was measured using a zeta analyzer (Malvern, UK) as −35.16. The results show that the RhB, MO and ZnIn2S4 were negatively charged under the investigated conditions and the surface charge properties of RhB and MO were not key factors that affected the adsorption performance of RhB and MO.
The differences in photocatalytic performance for dye degradation based on the structure of ZnIn2S4 were examined. The results show that ZnIn2S4 was composed of nanolamella petals growing in the ab plane, which was favorable for adsorption of RhB via N(Et)2 groups, whereas similar functional groups were absent in MO.20 Therefore, adsorption of RhB on ZnIn2S4 was better than that of MO. Above all, the differences in adsorption performance of ZnIn2S4 for RhB and MO further resulted in different photocatalytic performance.
Fig. 2 shows the variation of C/C0 of MO as a function of irradiation time under different photocatalyst dosage and concentration of MO. The results show that the photocatalytic degradation efficiency of the MO increased with decreasing MO concentration and increasing ZnIn2S4 dosage. Thus, 51.3% of MO was removed when the initial concentration of the MO decreased to 5 mg L−1 and the ZnIn2S4 dosage increased to 0.3 g L−1. By increasing the ZnIn2S4 dosage and decreasing the MO concentration, more photocatalysts could be excited and more active species were generated, which was helpful for degrading MO. At the same time, degradation of the MO was improved because the amount of MO in the system declined. To investigate the degradation behavior of MO, the concentration of the MO was 5 mg L−1 and the ZnIn2S4 dosage was 0.3 g L−1 in the subsequent experiments.
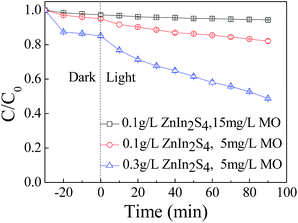 | ||
| Fig. 2 Photocatalytic degradation of MO with different ZnIn2S4 dosage (0.1 g L−1 or 0.3 g L−1) and initial concentration of MO (15 mg L−1 or 5 mg L−1). | ||
3.2 Determination of active species
![[thin space (1/6-em)]](https://www.rsc.org/images/entities/char_2009.gif) :
:![[thin space (1/6-em)]](https://www.rsc.org/images/entities/char_2009.gif) 2
2![[thin space (1/6-em)]](https://www.rsc.org/images/entities/char_2009.gif) :
:![[thin space (1/6-em)]](https://www.rsc.org/images/entities/char_2009.gif) 2
2![[thin space (1/6-em)]](https://www.rsc.org/images/entities/char_2009.gif) :
:![[thin space (1/6-em)]](https://www.rsc.org/images/entities/char_2009.gif) 1 was recorded by EPR.
1 was recorded by EPR.
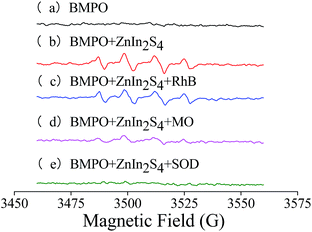 | ||
| Fig. 3 EPR spectra obtained using different solutions. (a) BMPO; (b) BMPO + ZnIn2S4; (c) BMPO + ZnIn2S4 + RhB; (d) BMPO + ZnIn2S4 + MO; (e) BMPO + ZnIn2S4 + SOD. | ||
The characteristic spectrum of adduct formed between BMPO and O2− (BMPO/˙O2−) was a four-line spectrum with relative intensities of 1![[thin space (1/6-em)]](https://www.rsc.org/images/entities/char_2009.gif) :
:![[thin space (1/6-em)]](https://www.rsc.org/images/entities/char_2009.gif) 1
1![[thin space (1/6-em)]](https://www.rsc.org/images/entities/char_2009.gif) :
:![[thin space (1/6-em)]](https://www.rsc.org/images/entities/char_2009.gif) 1
1![[thin space (1/6-em)]](https://www.rsc.org/images/entities/char_2009.gif) :
:![[thin space (1/6-em)]](https://www.rsc.org/images/entities/char_2009.gif) 1, and the characteristic spectrum of the adduct formed between BMPO and ˙OH (BMPO/˙OH) was a four-line spectrum with relative intensities of 1
1, and the characteristic spectrum of the adduct formed between BMPO and ˙OH (BMPO/˙OH) was a four-line spectrum with relative intensities of 1![[thin space (1/6-em)]](https://www.rsc.org/images/entities/char_2009.gif) :
:![[thin space (1/6-em)]](https://www.rsc.org/images/entities/char_2009.gif) 2
2![[thin space (1/6-em)]](https://www.rsc.org/images/entities/char_2009.gif) :
:![[thin space (1/6-em)]](https://www.rsc.org/images/entities/char_2009.gif) 2
2![[thin space (1/6-em)]](https://www.rsc.org/images/entities/char_2009.gif) :
:![[thin space (1/6-em)]](https://www.rsc.org/images/entities/char_2009.gif) 1.26 The EPR spectrum (b) of the mixture of BMPO and ZnIn2S4 was simulated using xenon (Bruker, Germany) based on g factor = 2.007. The parameters of the standard spectra of BMPO/˙O2− and BMPO/˙OH and the simulated spectrum are listed in Table A.1.† Comparing the hyperfine splitting parameters of the standard spectrum and the simulated spectrum, results show that EPR spectrum (b) is obtained from BMPO/˙O2− and BMPO/˙OH. In other words, ˙O2− and ˙OH are simultaneously generated during the ZnIn2S4 photocatalytic process.
1.26 The EPR spectrum (b) of the mixture of BMPO and ZnIn2S4 was simulated using xenon (Bruker, Germany) based on g factor = 2.007. The parameters of the standard spectra of BMPO/˙O2− and BMPO/˙OH and the simulated spectrum are listed in Table A.1.† Comparing the hyperfine splitting parameters of the standard spectrum and the simulated spectrum, results show that EPR spectrum (b) is obtained from BMPO/˙O2− and BMPO/˙OH. In other words, ˙O2− and ˙OH are simultaneously generated during the ZnIn2S4 photocatalytic process.
The characteristic spectra (c) and (d) that were obtained from the mixtures of BMPO, ZnIn2S4 and RhB or MO irradiated under visible light, are the same as EPR spectrum (b). The results demonstrate that species of free radicals did not change when dyes were added into the system. However, the intensities of spectrum (c) and spectrum (d) decreased dramatically in comparison with spectrum (b) because of free radicals that were consumed during the process of photocatalytic degradation of the dyes.
After addition of 400 U mL−1 SOD, the EPR signals were completely suppressed, indicating the absence of O2− and ˙OH. The results further demonstrate the generation of ˙O2− during the photocatalytic process. Moreover, ˙OH in the system were generated through ˙O2− reacting with H+. Thus, the generation of ˙OH was inhibited after addition of SOD, which could catalyze ˙O2− via disproportionation reaction.
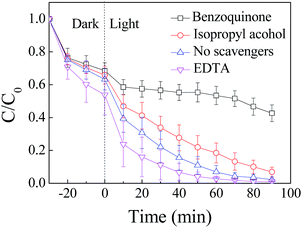
Only 57.4% of the RhB was degraded after 90 min when benzoquinone was added into the system, and the degradation of the RhB was obviously inhibited, when compared with 97.8% of the RhB that was degraded in the absence of scavengers. Degradation of the RhB was slightly suppressed with the addition of isopropyl alcohol. When EDTA was added into the system, the concentration of the RhB decreased quickly, and 97.3% of the RhB was removed in 60 min of photocatalytic process. Degradation of the RhB was enhanced when EDTA was added into the system. Similar results were obtained after scavengers were added into the system of photocatalytic degradation of MO by ZnIn2S4 under visible light irradiation (Fig. A.2†).
The results indicate that a large number of ˙O2− were generated when ZnIn2S4 was irradiated under visible light and played an important role in the degradation of the dyes. Therefore, degradation of the dyes was significantly inhibited because of the addition of benzoquinone to capture ˙O2−. Degradation of the dyes was slightly suppressed when isopropyl alcohol was added because of a small amount of ˙OH generated through ˙O2− reacting with H+.
Under visible light irradiation, electrons in the valence band transited to the conduction band and formed electron–hole pairs. Excited electrons could also recombine with holes through direct recombination and surface recombination, which resulted in reduced efficiency of the photocatalytic reaction. The recombination of electrons and holes was obviously restrained when EDTA was added into the system as a scavenger to capture holes. At the same time, more electrons migrated to the surface of the photocatalyst and reacted with O2 to form ˙O2−, which could enhance the degradation of the dyes by ZnIn2S4 under visible light irradiation.
Generally, it is necessary for a photocatalytic reaction that the potential of the conduction band is more negative than the potential of the acceptor, and the potential of the valence band is more positive than the potential of the donor. The potential of conduction band (CB) and valence band (VB) can be calculated according to the eqn (1) and (2) as follows:27
| ECB = X − Ee − 0.5Eg | (1) |
| EVB = ECB + Eg | (2) |
UV-Vis diffuse reflectance spectra and XPS spectra of ZnIn2S4 are showed in Fig. A.3 and A.4,† respectively. It can be seen that steep adsorption edge of ZnIn2S4 is about 606 nm and the band gap is estimated to be 2.05 eV according to the eqn (3)
| Eg = 1240/λg. | (3) |
![[thin space (1/6-em)]](https://www.rsc.org/images/entities/char_2009.gif) :
:![[thin space (1/6-em)]](https://www.rsc.org/images/entities/char_2009.gif) In
In![[thin space (1/6-em)]](https://www.rsc.org/images/entities/char_2009.gif) :
:![[thin space (1/6-em)]](https://www.rsc.org/images/entities/char_2009.gif) S is 1
S is 1![[thin space (1/6-em)]](https://www.rsc.org/images/entities/char_2009.gif) :
:![[thin space (1/6-em)]](https://www.rsc.org/images/entities/char_2009.gif) 3
3![[thin space (1/6-em)]](https://www.rsc.org/images/entities/char_2009.gif) :
:![[thin space (1/6-em)]](https://www.rsc.org/images/entities/char_2009.gif) 4.8 from XPS analysis. The parameters used for calculating potential of conduction band and valence band are listed in Table 1. Therefore, X = (4.24 × 3.073 × 6.234.8)1/(1 + 3 + 4.8) = 4.69 eV; ECB = 4.69 − 4.5 − 0.5 × 2.05 = −0.835 eV; EVB = −0.835 + 2.05 = 1.215 eV.
4.8 from XPS analysis. The parameters used for calculating potential of conduction band and valence band are listed in Table 1. Therefore, X = (4.24 × 3.073 × 6.234.8)1/(1 + 3 + 4.8) = 4.69 eV; ECB = 4.69 − 4.5 − 0.5 × 2.05 = −0.835 eV; EVB = −0.835 + 2.05 = 1.215 eV.
| Element | Element electronegativity (eV) | Molar ratio | Band gap (eV) |
|---|---|---|---|
| Zn | 4.24 | 1 | 2.05 |
| In | 3.07 | 3 | |
| S | 6.23 | 4.8 |
Holes in the valence band of ZnIn2S4 could not oxidize H2O and OH− to ˙OH because the potential of valence band (1.215 eV) was more negative than the potential of ˙OH/OH− (1.99 eV) and ˙OH/H2O (2.27 eV). However, the potential of the conduction band (−0.835 eV) was more negative than the potential of O2/˙O2− (−0.28 eV), and O2 adsorbed on the surface of the photocatalyst could be reduced to ˙O2− as electronic acceptors. ˙O2− reacted with H2O and electrons to form H2O2, which was further broken down into OH.
The active species generated during the photocatalytic process are described in detail as follows. Electrons in the valence band transited to the conduction band to form photogenerated hole–electron pairs when the ZnIn2S4 was excited under visible light (4). Electrons reacted with O2 adsorbed on the surface of the ZnIn2S4 to generate ˙O2− (5). Peroxide hydroxyl radical (HO2) was generated through ˙O2− reacting with H+ and decomposed into hydrogen peroxide (H2O2) (6) and (7), which combined with ˙O2− to form ˙OH (8). Meanwhile, H2O2 also decomposed into ˙OH by adsorbing energy from the visible light (9).
| ZnIn2S4 + hν → ZnIn2S4(h+ + e−) | (4) |
| O2 + e− → ˙O2− | (5) |
| ˙O2− + H+ → HO2˙ | (6) |
| 2HO2˙ → O2 + H2O2 | (7) |
| H2O2 + ˙O2− → ˙OH + OH− + O2 | (8) |
| H2O2 + hν → 2˙OH | (9) |
These results indicate that ˙O2− is the key active species for the degradation of RhB and MO by ZnIn2S4 under visible light irradiation, and ˙OH played a supplementary role during the photocatalytic process. Li et al. also found similar results in photocatalytic inactivation of MS2 by metal-free g-C3N4.28
Yan et al. believe that different active species generated during the photocatalytic process using the same photocatalyst result in different photocatalytic performance.29 However, the active species generated during the photocatalytic process for the degradation of RhB were the same as those generated during the photocatalytic degradation of MO. The results indicate that the active species are not the main factors causing the different photocatalytic performance for the degradation of RhB and MO by ZnIn2S4. Moreover, the photocatalytic degradation of MO could be improved when EDTA was added into the system as a scavenger to capture holes that inhibit the recombination of holes and electrons.
3.3 Identification of intermediates
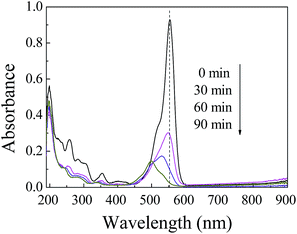 | ||
| Fig. 5 UV-Vis spectra of degraded RhB solution under visible light irradiation with an initial RhB concentration of 15 mg L−1 and a ZnIn2S4 dosage of 0.1 g L−1. | ||
It can be seen from Fig. 5 that the absorbance of RhB at a wavelength of 553 nm obviously decreased as the reaction time was prolonged, which indicates that RhB was gradually degraded. After 30 min visible light irradiation, the maximum absorption peak of the solution began to display slight hypsochromic shifts and then moved significantly from 553 nm to 500 nm in 90 min. This phenomenon resulted from the formation of a series of N-deethylated intermediates during the initial stages of photocatalytic degradation of the RhB in the presence of ZnIn2S4, under visible light. Li et al. also found similar phenomena in the photocatalytic degradation of RhB by synthesized Bi2S3 nanoparticles/platelike Bi2WO6 heterostructures.30
HPLC chromatograms of RhB degraded samples at 0 min and 60 min are shown in Fig. A.5.† Six peaks (I–VI) were recorded at 60 min of photocatalytic process. Mass spectrograms of corresponding intermediates are shown in Fig. 6. Considering the value of m/z, one of the peaks was RhB (peak I), and the other five peaks were identified as N-deethylated intermediates generated during the initial stages of photocatalytic degradation of RhB by ZnIn2S4. The conclusions are consistent with results obtained from hypsochromic shifts of maximum absorption peaks of RhB degraded solution. Information for the N-deethylated intermediates (I–VI) is listed in Table 2.
 | ||
| Fig. 6 Mass spectrograms of proposed intermediates generated during photocatalytic degradation of RhB by ZnIn2S4 under visible light irradiation. | ||
| Peak | Retention time | m/z (M+) | Proposed intermediates |
|---|---|---|---|
| I | 7.515 | 443.24 | Rhodamine B |
| II | 5.490 | 415.20 | N,N-Diethyl-N′-ethylrhodamine |
| III | 3.997 | 387.17 | N,N-Diethyl-rhodamine |
| IV | 2.978 | 387.17 | N-Ethyl-N′-ethylrhodamine |
| V | 2.314 | 359.14 | N-Ethylrhodamine |
| VI | 1.702 | 331.11 | Rhodamine |
After N-deethylation, rhodamine was degraded into intermediate VII (m/z 181.04 (M+)) with cleavage of the carbon–nitrogen bond (C![[double bond, length as m-dash]](https://www.rsc.org/images/entities/char_e001.gif) N), which was responsible for visible absorbance at 553 nm for RhB and formation of several aromatic intermediates such as benzoic acid (VIII, m/z 122.55 (M+)) and phenol (IX, m/z 94.04 (M+)).31 According to the pathway of photocatalytic degradation RhB by Bi-doped TiO2, RhB was degraded completely via four processes: N-deethylation, cleavage of chromophores, rings opening and mineralization.32 Thus, the aromatic intermediates may be degraded into small molecule organic matters via ring opening with increased reaction time. The degradation pathway of RhB in this study is proposed in Scheme 1.
N), which was responsible for visible absorbance at 553 nm for RhB and formation of several aromatic intermediates such as benzoic acid (VIII, m/z 122.55 (M+)) and phenol (IX, m/z 94.04 (M+)).31 According to the pathway of photocatalytic degradation RhB by Bi-doped TiO2, RhB was degraded completely via four processes: N-deethylation, cleavage of chromophores, rings opening and mineralization.32 Thus, the aromatic intermediates may be degraded into small molecule organic matters via ring opening with increased reaction time. The degradation pathway of RhB in this study is proposed in Scheme 1.
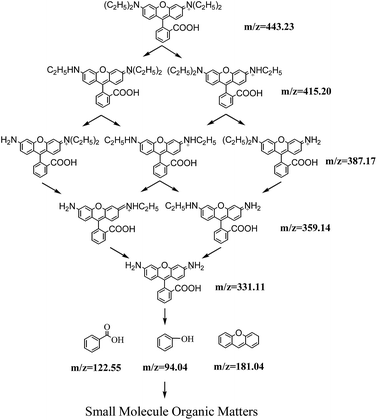 | ||
| Scheme 1 Proposed degradation pathway of photocatalytic degradation of RhB by ZnIn2S4 under visible light irradiation. | ||
The results above mentioned are well agreement with the degradation pathway of RhB under UV-LED/TiO2 process.33 Intermediates generated during degradation of RhB by TiO2/ZnFe2O4 nanocomposite are slightly different from our study. N-Deethylation leads to the formation of phenyl oxonium intermediates and the cleavage of chromophore leads to the formation of major phenolic intermediates.34
![[double bond, length as m-dash]](https://www.rsc.org/images/entities/char_e001.gif) N–), which are chromophores of MO.35 The absorbance of degraded solution at 464 nm was seldom decreased, and the maximum absorption peak at 270 nm was not changed. The maximum adsorption peaks did not exhibit hypsochromic shifts during the photocatalytic process.
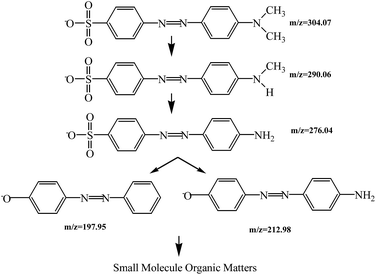
N–), which are chromophores of MO.35 The absorbance of degraded solution at 464 nm was seldom decreased, and the maximum absorption peak at 270 nm was not changed. The maximum adsorption peaks did not exhibit hypsochromic shifts during the photocatalytic process.Information on intermediates formed during photocatalytic degradation of MO by ZnIn2S4 under visible light irradiation is listed in Table 3. Mass spectrograms of corresponding intermediates are shown in Fig. A.7.† MO (m/z 304.07 (M−)) was degraded into A (m/z 290.06 (M−)) and B (m/z 276.04 (M−)) through demethylation.
Then the sulfur carbon bonds (S–C) of intermediates were destroyed, and hydroxylation of molecules occurred to form C (m/z 212.98 (M−)) and D (m/z 195.95 (M−)). The azo bonds may be destroyed as reaction time is prolonged, according to other research.36 The degradation pathway of MO is proposed in Scheme 2.
3.4 The mechanism of different photocatalytic performance for the degradation of RhB and MO
The mechanism of different photocatalytic performance for the degradation of RhB and MO by means of ZnIn2S4 was discussed in detail based on the results mentioned above.Adsorption of RhB on ZnIn2S4 was obviously higher than that of MO because of the specific structure of ZnIn2S4, which was favorable for adsorption of RhB via N(Et)2 groups; similar functional groups were absent in MO. The different adsorptivity of ZnIn2S4 for RhB and MO further resulted in differences in photocatalytic performance.
According to the pathway of photocatalytic degradation of dyes, RhB was degraded through N-deethylation and cleavage of the C![[double bond, length as m-dash]](https://www.rsc.org/images/entities/char_e001.gif) N bond, which is a chromophore of RhB. Degradation of MO was achieved through demethylation and cleavage of the azo bond.
N bond, which is a chromophore of RhB. Degradation of MO was achieved through demethylation and cleavage of the azo bond.
Chemical bonds with different bond energies are destroyed during degradation of dyes. It is more difficult to destroy a bond with a higher bond energy. Carbon–carbon bonds (C–C) and carbon–nitrogen bonds (C–N) were destroyed during N-deethylation of RhB and demethylation of MO, respectively. The processes of N-deethylation and demethylation could be carried out successfully because the bond energy of C–C was almost the same as that of C–N.
However, the C![[double bond, length as m-dash]](https://www.rsc.org/images/entities/char_e001.gif) N bond of RhB has a bond energy of about 407 kJ mol−1, while the bond energy of the azo bond of MO is about 518 kJ mol−1.37 Therefore, it is easier for ˙O2− and ˙OH to destroy the C
N bond of RhB has a bond energy of about 407 kJ mol−1, while the bond energy of the azo bond of MO is about 518 kJ mol−1.37 Therefore, it is easier for ˙O2− and ˙OH to destroy the C![[double bond, length as m-dash]](https://www.rsc.org/images/entities/char_e001.gif) N bond of RhB than the azo bond of MO under the same conditions, and the subsequent process of degradation of RhB is easier to carry out. Thus, photocatalytic degradation of RhB is superior to the degradation of MO under the same conditions. Above all, the differences in photocatalytic performance of ZnIn2S4 for the degradation of RhB and MO were mainly due to the different adsorptivity of ZnIn2S4 for RhB and MO, and the different chemical bonds of RhB and MO that were destroyed during the photocatalytic process.
N bond of RhB than the azo bond of MO under the same conditions, and the subsequent process of degradation of RhB is easier to carry out. Thus, photocatalytic degradation of RhB is superior to the degradation of MO under the same conditions. Above all, the differences in photocatalytic performance of ZnIn2S4 for the degradation of RhB and MO were mainly due to the different adsorptivity of ZnIn2S4 for RhB and MO, and the different chemical bonds of RhB and MO that were destroyed during the photocatalytic process.
The active species generated during the photocatalytic process for the degradation of RhB were the same as those generated during the photocatalytic degradation of MO; thus, the active species are not the main factors causing the different photocatalytic performance for the degradation of RhB and MO by ZnIn2S4. RhB was effectively degraded, but a smaller percentage of MO was degraded during the photocatalytic process in which ˙O2− was the key active species. MO could be degraded more effectively by adding hole scavengers to inhibit recombination of holes and electrons, which would result in more electrons reducing O2 to ˙O2− and improving the degradation of MO. The conclusions may provide a theoretical basis for improved degradation of dyes.
4. Conclusions
A comprehensive study of the different photocatalytic performance of the degradation of different dyes under visible light irradiation was carried out in this study. Several conclusions can be summarized as follows.Adsorption of RhB on ZnIn2S4 was higher than that of MO. ˙O2− is key active species for degradation of RhB and MO by ZnIn2S4 under visible light irradiation, and ˙OH played a supplementary role during the photocatalytic process. Pathways for the photocatalytic degradation of RhB and MO by ZnIn2S4 are proposed according to identification of intermediates using LCMS-IT-TOF. RhB was degraded through N-deethylation and cleavage of the C![[double bond, length as m-dash]](https://www.rsc.org/images/entities/char_e001.gif) N bond, which is a chromophore of RhB. Degradation of MO was achieved through demethylation and cleavage of the azo bond.
N bond, which is a chromophore of RhB. Degradation of MO was achieved through demethylation and cleavage of the azo bond.
Photocatalytic degradation of RhB was superior to the degradation of MO under the same conditions. On the one hand, the adsorption of RhB on ZnIn2S4 was higher than that of MO, which further affected photocatalytic performance. On the other hand, the bond energy of the azo bond of MO was higher than the bond energy of the C![[double bond, length as m-dash]](https://www.rsc.org/images/entities/char_e001.gif) N bond of RhB. Thus, it is easier for ˙O2− and ˙OH to destroy the C
N bond of RhB. Thus, it is easier for ˙O2− and ˙OH to destroy the C![[double bond, length as m-dash]](https://www.rsc.org/images/entities/char_e001.gif) N bond of RhB than the azo bond of MO under the same conditions, and the subsequent process of degradation of RhB is easier to carry out. The photocatalytic degradation of MO in a system in which ˙O2− is key active species can be improved by adding hole scavengers to inhibit recombination of holes and electrons, which would result in more electrons reducing O2 to ˙O2−.
N bond of RhB than the azo bond of MO under the same conditions, and the subsequent process of degradation of RhB is easier to carry out. The photocatalytic degradation of MO in a system in which ˙O2− is key active species can be improved by adding hole scavengers to inhibit recombination of holes and electrons, which would result in more electrons reducing O2 to ˙O2−.
Acknowledgements
This work was supported by the National Natural Science Foundation of China [Grant No. 51278408]; Shanxi Province Science and Technology Youth Star Project [Grant No. 2014KJXX-65] and the innovative research team of Xi'an University of Architecture and Technology.References
- S. Hisaindee, M. Meetani and M. Rauf, TrAC, Trends Anal. Chem., 2013, 49, 31 CrossRef CAS.
- J. Gao, S. Yang, N. Li, L. Meng, F. Wang, H. He and C. Sun, Appl. Surf. Sci., 2016, 379, 140 CrossRef CAS.
- W. Liu, L. Liu, C. Liu, Y. Hao, H. Yang, B. Yuan and J. Jiang, Biochem. Eng. J., 2016, 110, 115 CrossRef CAS.
- A. Umar, M. Akhtar, A. Al-Hajry, M. Al-Assiri, G. Dar and M. Islam, Chem. Eng. J., 2015, 262, 588 CrossRef CAS.
- S. Ameena, M. Akhtarb, Y. Kim and H. Shina, Appl. Catal., B, 2011, 103, 136 CrossRef.
- Y. Wang and W. Chu, J. Hazard. Mater., 2011, 186, 1455 CrossRef CAS PubMed.
- C. Tang, L. Liu, Y. Li and Z. Bian, Appl. Catal., B, 2017, 201, 41 CrossRef CAS.
- B. Parea, S. B. Jonnalagaddab, H. Tomara, P. Singha and V. W. Bhagwata, Desalination, 2008, 232, 80 CrossRef.
- X. Li, J. Wang, Y. Men and Z. Bianc, Appl. Catal., B, 2016, 187, 115 CrossRef CAS.
- Z. Lei, J. Wang, L. Wang, X. Yang, G. Xu and L. Tang, J. Hazard. Mater., 2016, 312, 298 CrossRef CAS PubMed.
- P. Reddy Prasad, A. Ofomaja and E. Naidoo, Appl. Surf. Sci., 2015, 327, 13 CrossRef CAS.
- X. Hu, C. Hu and R. Wang, Appl. Catal., B, 2015, 176–177, 637 CrossRef CAS.
- H. Hu, C. Deng, J. Xu, Q. Zheng, G. Chen and X. Ge, Mater. Lett., 2015, 161, 17 CrossRef CAS.
- B. Priya, P. Raizada, N. Singh, P. Thakur and P. Singh, J. Colloid Interface Sci., 2016, 479, 271 CrossRef CAS PubMed.
- F. Fang, L. Chen, Y. Chen and L. Wu, J. Phys. Chem. C, 2010, 114, 2393 CAS.
- S. Shen, L. Zhao and L. Guo, Mater. Res. Bull., 2009, 44, 100 CrossRef CAS.
- X. Li, P. Zhang, L. Jin, T. Shao, Z. Li and J. Cao, Environ. Sci. Technol., 2012, 46, 5528 CrossRef CAS PubMed.
- H. Zhou and D. Smith, Environ. Eng. Sci., 2002, 4, 247 CrossRef.
- K. Wang, J. Xu, X. Hua, N. Li, M. Chen, F. Teng, Y. Zhu and W. Yao, J. Mol. Catal. A: Chem., 2014, 393, 302 CrossRef CAS.
- Y. Chen, R. Huang, D. Chen, Y. Wang, W. Liu, X. Li and Z. Li, ACS Appl. Mater. Interfaces, 2012, 4, 2273 CAS.
- B. Gao, L. Liu, J. Liu and F. Yang, Appl. Catal., B, 2013, 129, 89 CrossRef CAS.
- J. Huang, W. Cheuk, Y. Wu, F. Lee and W. Ho, Catal. Sci. Technol., 2012, 2, 1825 CAS.
- M. Ge, Chin. J. Catal., 2014, 35, 1410 CrossRef CAS.
- R. Dhanabal, S. Velmathi and A. Bose, Catal. Sci. Technol., 2016, 6, 8449 CAS.
- F. Chen, J. Zhao and H. Hidaka, Int. J. Photoenergy, 2003, 5, 209 CrossRef CAS.
- W. He, H. Zhao, H. Jia, J. Yin and Z. Zheng, Mater. Res. Bull., 2014, 53, 246 CrossRef CAS.
- B. Chai, T. Peng, P. Zeng and X. Zhang, Dalton Trans., 2012, 41, 1179 RSC.
- Y. Li, C. Zhang, D. Shuai, S. Naraginti, D. Wang and W. Zhang, Water Res., 2016, 106, 249 CrossRef CAS PubMed.
- S. Yan, Z. Li and Z. Zou, Langmuir, 2010, 6, 3894 CrossRef PubMed.
- X. Li, Y. Li, J. Shen and M. Ye, Ceram. Interfaces, 2016, 42, 3154 CrossRef CAS.
- J. Du, J. Bao, X. Fu, C. Lu and S. Kim, Sep. Purif. Technol., 2016, 163, 145 CrossRef CAS.
- T. Natarajan, K. Natarajan, H. Bajaj and R. Tayade, J. Nanopart. Res., 2013, 15, 1669 CrossRef.
- T. Natarajan, M. Thomas, K. Natarajan, H. Bajaj and R. Tayade, Chem. Eng. J., 2011, 169, 126 CrossRef CAS.
- K. Natarajan, P. Singh, H. Bajaj and R. Tayade, Korean J. Chem. Eng., 2016, 33, 1788 CrossRef CAS.
- J. Fan, X. Hu, Z. Xie, K. Zhang and J. Wang, Chem. Eng. J., 2012, 179, 44 CrossRef CAS.
- Y. He, F. Grieser and M. Ashokkumar, Ultrason. Sonochem., 2011, 18, 974 CrossRef CAS PubMed.
- Y. R. Luo, Comprehensive Handbook of Chemical Bond Energies, CRC Press, China, 2005 Search PubMed.
Footnote |
| † Electronic supplementary information (ESI) available. See DOI: 10.1039/c7ra00199a |
| This journal is © The Royal Society of Chemistry 2017 |

