 Open Access Article
Creative Commons Attribution 3.0 Unported Licence
Phosphorylation of lignin: characterization and investigation of the thermal decomposition
B. Prieura,
M. Meubb,
M. Wittemannb,
R. Kleinb,
S. Bellayera,
G. Fontainea and
S. Bourbigot *a
*a
aR2Fire group/UMET – UMR CNRS 8207, Ecole Nationale Supérieure de Chimie de Lille (ENSCL), Avenue Dimitri Mendeleïev – Bât. C7a, CS 90108, 59652 Villeneuve d'Ascq Cedex, France. E-mail: serge.bourbigot@ensc-lille.fr
bGroup for Design of Interfaces, Division Plastics, Fraunhofer Institute for Structural Durability and System Reliability LBF, Darmstadt, Germany
First published on 17th March 2017
Abstract
Lignin is an abundant polyphenol biopolymeric material. Lignin was phosphorylated thanks to the presence of reactive hydroxyl groups in its structure. A detailed characterization allowed us to prove that phosphate groups are covalently bonded to the lignin's structure. The thermal stability of lignin was improved with the presence of phosphorus and was evaluated at 3% w/w. The thermal decomposition of lignin was deeply investigated through gas and condensed phases analyzes. The phosphorus was found to promote dehydration and decarboxylation reactions, thus increasing the amount of carbonaceous residue which was more stable at high temperature. The combustibility of lignin was also lowered when phosphorylated. Finally, even if half of the initial amount was released in the gas phase, the phosphorus mainly acts in the condensed phase by forming different species, which prevents the residue from oxidation.
Introduction
Over the past few years, concerns about depletion of fossil resources and the increasing needs of their derivative products have forced the scientific community to consider sustainable resources as a real alternative. Specific interest has been devoted to biomass and green materials. Among them, lignin has been paid attention mainly because of its huge availability as a feedstock across the world. A complete review has been recently published.1 Lignin is one of the three components, along with cellulose and hemicellulose, responsible for strength and rigidity in plants and trees. In the last years, lignin has been employed as an alternative to antioxidants,2 surfactants,3 flame retardants4–6 or even as a chemicals source.7Because of the presence of reactive functions in its structure such as hydroxyl or aromatic groups, lignin may be functionalized. The properties of lignin can thus be tuned. Modified lignin (modifications such as hydroxylation, alkylation, amination, nitration and others) has started to be widely used in different applications.1 Among all these modifications, phosphorylation has gained interest, especially in the field of flame retardancy.5,8,9 Different strategies of phosphorylation may be considered, and previous work of this laboratory dealt with a direct and easy process.6 Phosphates groups were proved to be covalently bonded to the lignin's structure leading to some changes of its thermal stability. As one of the consequences, promising performance were observed using phosphorylated lignin as flame retardant additive in acrylonitrile-butadiene-styrene (ABS). Because the mode of action of neat and phosphorylated lignins in ABS was investigated in detail, full efforts were put on the characterization of the composites. However, it was found that the presence of phosphorus clearly induces changes in the thermal decomposition of lignin.
In this context, further work was achieved focused on the influence of the phosphorylation on the lignin's thermal behavior. The same phosphorylation process as before was undertaken, and a full characterization of the phosphorylation is presented to complete the previous paper. Then the thermal stability of neat and phosphorylated lignin is compared. It is followed by a detailed investigation of both gas and condensed phase which allows to elucidate the role of phosphorus in the thermal decomposition of lignin.
Experimental
Materials
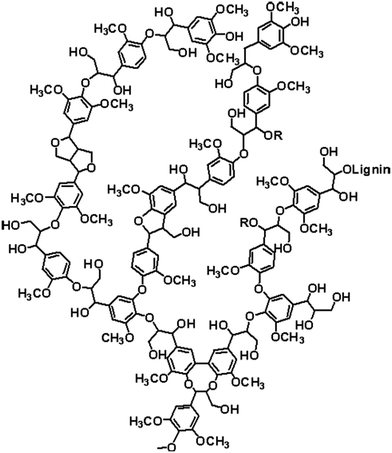
Kraft lignin was provided by UPM, Finland. A possible chemical structure is presented in Fig. 1. Due to the high water uptake, neat Kraft lignin were dried at reduced pressure at 60 °C for 1 week before use. Neat and phosphorylated lignin were dried at 75 °C for at least 24 h before analysis.Phosphorylation of lignin (P-LIG)
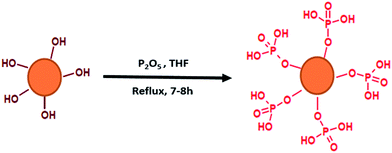
An illustration of the simplified synthetic route leading to phosphorylated lignin (P-LIG) is shown in Fig. 2. The objective of the work was the development of a process suitable for industrialization and therefore the synthetic route was kept as simple as possible. Lignin (2 kg) was dissolved in 7.5 L of tetrahydrofuran (THF). When the lignin was fully dissolved, phosphorus pentoxide (P2O5) was added at room temperature. The solution was heated at solvent reflux for 7 to 8 h in the course of which the product was largely precipitated. After the mixture was cooled down to room temperature, water was added in order to transform excess of P2O5 into phosphoric acid. Then THF was evaporated in a rotatory evaporator at 40 °C under reduced pressure. The phosphorylated lignin was collected by filtration and washed thoroughly. In order to remove residual phosphoric acid, P-LIG was exhaustively extracted with water in soxhlet apparatus. Finally, the product was dried 24 h at 75 °C at reduced pressure.Thermal treatments
Thermal treatments consist in heating a lignin's sample in a furnace at a defined temperature (Heat Treatment Temperature; HTT). The treatment temperatures were determined according to TGA curves as they correspond to the characteristic degradation steps of the systems. Samples were treated under air or nitrogen flow set at 75 mL min−1 and heated at a heating rate of 10 °C min−1 (similar to that used for the TGA measurements) from ambient to the HTT followed by an isotherm of 2 hours. The samples were then cooled to ambient temperature before being collected. The residues obtained after thermal treatments were stored in a desiccator to avoid hydrolysis.Characterization
![[thin space (1/6-em)]](https://www.rsc.org/images/entities/char_2009.gif) :
:![[thin space (1/6-em)]](https://www.rsc.org/images/entities/char_2009.gif) 1.6 vol/vol). The internal standard used for quantification, N-hydroxy-6-norbornene-2,3-dicarboximide, was then added (100 μL of 0.1 M solution in 1
1.6 vol/vol). The internal standard used for quantification, N-hydroxy-6-norbornene-2,3-dicarboximide, was then added (100 μL of 0.1 M solution in 1![[thin space (1/6-em)]](https://www.rsc.org/images/entities/char_2009.gif) :
:![[thin space (1/6-em)]](https://www.rsc.org/images/entities/char_2009.gif) 1.6 v/v CDCl3/pyridine mixture). Followed by 100 μL of 0.014 M solution of chromium(III) acetylacetonate in the same CDCl3/pyridine mixture which was used to complete the solution in order to homogenize and accelerate phosphorus relaxation. Finally, 100 μL of the phosphitylation reagent, 2-chloro-4,4,5,5-tetramethyl-1,3,2-dioxaphospholane, was incorporated in the solution. A portion (0.6 mL) of this mixture was eventually introduced into a NMR tube. The spectra were recorded with 2 s relaxation time and an average number of 1000 scans. Chemical shifts were relative to the signal of the phospholane hydrolysis product at 132.2 ppm. The integral value of the internal standard was used for the calculations of the absolute amount of each functional group. The resulting quantification is presented in Table 1.
1.6 v/v CDCl3/pyridine mixture). Followed by 100 μL of 0.014 M solution of chromium(III) acetylacetonate in the same CDCl3/pyridine mixture which was used to complete the solution in order to homogenize and accelerate phosphorus relaxation. Finally, 100 μL of the phosphitylation reagent, 2-chloro-4,4,5,5-tetramethyl-1,3,2-dioxaphospholane, was incorporated in the solution. A portion (0.6 mL) of this mixture was eventually introduced into a NMR tube. The spectra were recorded with 2 s relaxation time and an average number of 1000 scans. Chemical shifts were relative to the signal of the phospholane hydrolysis product at 132.2 ppm. The integral value of the internal standard was used for the calculations of the absolute amount of each functional group. The resulting quantification is presented in Table 1.
| Sample | OH content [mmol g−1] | Monomers ratio [%] | ||||
|---|---|---|---|---|---|---|
| Phenolic | Aliphatic | Carboxylic | S | g | h | |
| LIG | 4.2 | 1.7 | 0.4 | 13 | 84 | 3 |
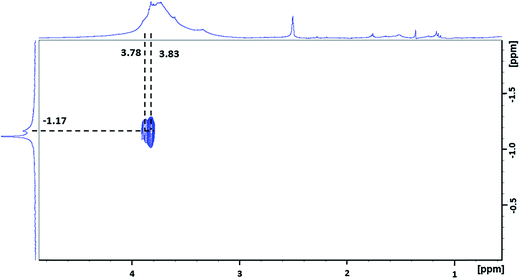
2D 1H–31P was performed using HSQC (Heteronuclear Single Quantum Coherence) procedure with 128 time domains and 16 scans and a delay of 1.5 s. Chemical shifts were referenced to DMSO-d6.
Solid state 13C NMR experiments were carried out on a Bruker Advance II 400 (B0 = 9.4 T) using a 4 mm standard probe. Spectra obtained for lignin characterization were measured at a rotation speed of 15 kHz with an accumulation of 20![[thin space (1/6-em)]](https://www.rsc.org/images/entities/char_2009.gif) 000 scans. Chars NMR analysis were performed at a rotation speed of 12.5 kHz and an accumulation of 1024 scans. High power 1H decoupling and 1H–13C CP (with a contact time of 1 ms and a recycle delay of 5 s) were used. 1024 scans were performed. Glycine was used as a reference.
000 scans. Chars NMR analysis were performed at a rotation speed of 12.5 kHz and an accumulation of 1024 scans. High power 1H decoupling and 1H–13C CP (with a contact time of 1 ms and a recycle delay of 5 s) were used. 1024 scans were performed. Glycine was used as a reference.
Solid state 31P NMR was used too. 1H decoupling was used because of the high relaxation time of phosphorus nuclei (high powered decoupling – HPDEC method). Accumulation of 512 scans were carried out. A repetition time of 10 s was applied, and H3PO4 aqueous solution (85%) was used as reference. The rotation speed was set at 12.5 kHz.
Results and discussion
Phosphorylation of Kraft lignin
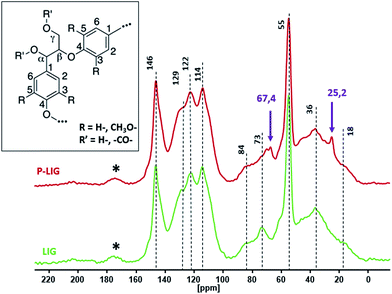
13C solid state NMR was undertaken to compare the skeleton's structure of P-LIG to the LIG one (Fig. 4). Both spectra exhibit very similar signals which indicates that the carbon structures of LIG and P-LIG are very close. Aromatic units (100–160 ppm), methoxy groups (55 ppm) and alkyl chains (0–90 ppm) are still part of P-LIG structure and similar to LIG ones (Table 2). Especially the presence of β–O–4 and α–O–4 bonds in P-LIG (84 and 73 ppm) proves that ether bridges between aromatic units were not significantly cleaved. Unexpected peaks at 67.4 and 25.2 ppm were attributed to residual THF, which is the solvent used to perform the phosphorylation. So it appears that the lignin's structure was only slightly affected by the phosphorylation's reaction and that no major degradation of the lignin's structure occurred.
![[double bond, length as m-dash]](https://www.rsc.org/images/entities/char_e001.gif) H– and C3 R
H– and C3 R![[double bond, length as m-dash]](https://www.rsc.org/images/entities/char_e001.gif) CH3O–
CH3O–
| Type of carbon | Chemical shift [ppm] |
|---|---|
Aromatic ![[double bond, length as m-dash]](https://www.rsc.org/images/entities/char_e001.gif) C–O (C3) C–O (C3) |
152 |
Aromatic ![[double bond, length as m-dash]](https://www.rsc.org/images/entities/char_e001.gif) C–O (C4) C–O (C4) |
146 |
Aromatic –C![[double bond, length as m-dash]](https://www.rsc.org/images/entities/char_e001.gif) C (C1) C (C1) |
129 |
Aromatic ![[double bond, length as m-dash]](https://www.rsc.org/images/entities/char_e001.gif) CH– (C6) CH– (C6) |
122 |
Aromatic ![[double bond, length as m-dash]](https://www.rsc.org/images/entities/char_e001.gif) CH– (C2,C5) CH– (C2,C5) |
114 |
| Cβ–OR (β–O–4) | 84 |
| Cα–OR (α–O–4) | 73 |
| O–CH3 | 55 |
| CH2 | 33 |
| CH3 | 18 |
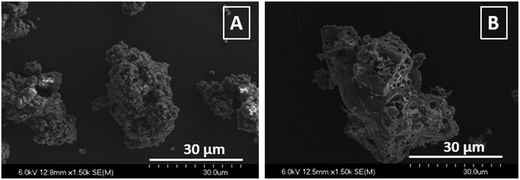
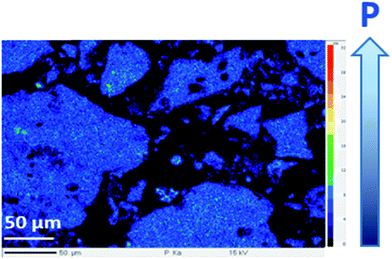
Lignin's particles were also analyzed by scanning electron microscopy (SEM). Images shown in Fig. 5 compare LIG and P-LIG particles of similar sizes. LIG particle appears to be made of small spherical particles (about 1–2 μm) which agglomerates together. It results a homogenous agglomerate with a smooth surface. In the case P-LIG, the particle is not an agglomerate, but looks as one-chunk. Many holes can be distinguished all over the particles which exhibits a porous surface. Bigger particles of P-LIG are also observed and are probably agglomerates made of the particle shown on the imaging (B). In order to investigate the distribution of phosphorus in P-LIG, EPMA 31P mapping was also undertaken (Fig. 6). It shows that phosphorus is detected on lignin's particles (light blue spot) and is well distributed on/in lignin.
Thermal stability of neat and phosphorylated lignin
| Thermo-oxidative atmosphere | Inert atmosphere | |||||||
|---|---|---|---|---|---|---|---|---|
| T2% [°C] | TMAX [°C] | DTGMAX [% per °C] | Res [%] | T2% [°C] | TMAX [°C] | DTGMAX [% per °C] | Res [%] | |
| LIG | 207 | 410 | 1.8 | 1 | 208 | 370 | 0.3 | 45 |
| P-LIG | 206 | 475 | 0.5 | 4 | 204 | 409 | 0.2 | 53 |
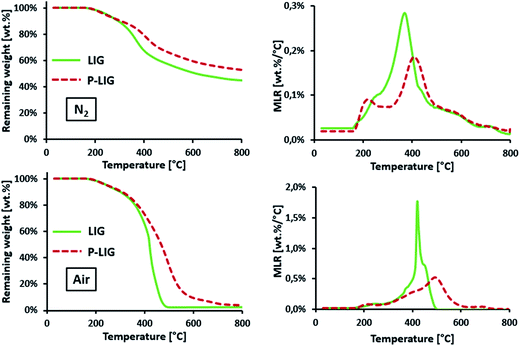
P-LIG starts to decompose in the same range of temperature as that of LIG (T2% ≈ 210 °C). However, the first step occurs 30 °C lower compared to LIG (220 versus 250 °C under both atmospheres, non-observable on TGA air curves because of the scale), whereas the second step is shifted towards higher temperature, i.e. 40 °C under N2 and 65 °C under air. Above 220 °C, the mass loss rate (MLR) decreases in comparison to that for LIG leading to a stabilization. DTGMAX is indeed reduced from 1.8 to 0.5 wt% per °C and from 0.3 to 0.2 wt% per °C under thermo-oxidative and pyrolytic conditions respectively. At high temperature under nitrogen, the residue amount increases from 45 wt% for LIG to 53 wt% for P-LIG.
It appears that the phosphorylation induces a slight thermal destabilization in the first step of decomposition (210–260 °C). Indeed it is known that phosphoric acid-based molecules, such as phosphates (present in the P-LIG structure), catalyzes dehydration of bio-based products such as starch.14 Even if the LIG chemical structure differs from starch, especially regarding aromatic sites of LIG, some analogy can be established considering hydroxyl and ester groups with respect to dehydration. So dehydration of P-LIG could be promoted as a consequence of the activation and then the catalysis induced by P-species. Above 300 °C a significant thermal stabilization occurs due to the phosphorylation. First, a higher DTGMAX reduction in the presence of oxygen may be attributed to the phosphorus which is known to prevent oxidation of the char.15 Moreover, the stabilization observed in inert conditions also demonstrates that the presence of phosphorus increases the char formation probably due to condensed phase interactions. Therefore, the phosphorylation enhances the thermal stability of LIG at high temperature. These significant improvements are obtained with 3.0% of phosphorus only in the lignin's structure. In order to explain these changes, investigations were carried out and presented hereafter.
Thermal decomposition of neat and phosphorylated lignin
| Functional group or component | Wave number [cm−1] | Vibration type |
|---|---|---|
| C–H aromatic | 1035 | δ in plane |
| C–O–C | 1086 | δ |
| 1270 | γ | |
| CH2 | 1036 | δ |
| CH3 | 1360 | δ |
C![[double bond, length as m-dash]](https://www.rsc.org/images/entities/char_e001.gif) C C |
1510 and 1600 | Aromatic ring vibrations |
C![[double bond, length as m-dash]](https://www.rsc.org/images/entities/char_e001.gif) O O |
1760 | γ |
| CO | 2185 and 2105 | γ |
| CO2 | 2306 and 2382 | γ |
| CH2 | 2873 | δ |
| CH3 | 2970 | δ |
| CH4 | 3015 | γ |
![[double bond, length as m-dash]](https://www.rsc.org/images/entities/char_e001.gif) C–H aromatic C–H aromatic |
3044 | γ |
| O–H phenol | 3590 | γ |
| H2O | 1700–1400 | δ |
| 3900–3400 | γ |
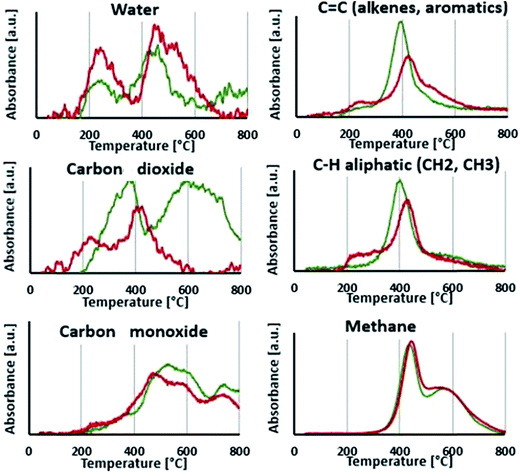
As release of water and carbon dioxide is observed between 180 and 250 °C, the first apparent step of degradation of LIG is attributed to aliphatic OH dehydration and decarboxylation.19 From 300 °C, a second release of water is noticed, attributed to the dehydration of phenolic hydroxyl groups.20 Evolution of CO is due to the weakly bound oxygen groups such as aldehyde groups while the first release of CO2 (200–400 °C) is related to remaining carboxyl groups.13 A second release of CO2 is noticed between 425 and 800 °C and may be originated from local oxidation of the phenolic groups.21 Aromatic compounds start to evolve from 300 °C as the aryl-ether bonds begin to be cleaved. The ether linkages have indeed different pyrolytic cleavage mechanisms, as depending on the side-chain structure of lignin (aliphatic bridges between aromatic units, see Fig. 2), and therefore release of aromatic compounds occurs over a wide range of temperature until 700 °C.13 Finally, methane is released from 300 to 800 °C and is generated mostly from the weakly bond to more stable bond methoxy groups. So the second apparent degradation step, starting around 300 °C is actually composed of many reactions overlapping with each other's.
Profiles of degradation gases of P-LIG were then compared to those of LIG. Fig. 8 shows that CO2 is released from 170 °C which is 30 °C lower than LIG. So decarboxylation is promoted in P-LIG. Moreover, CO2 release, attributed to degradation of carboxylic groups, is divided in two peaks, showing that the decarboxylation of one type of carboxylic groups is promoted. Besides CO2, the evolution of water during the first degradation step is higher for P-LIG than that of LIG. It indicates that phosphorus also promotes dehydration of lignin structure. It is also noticed an increase of the release of aliphatic compounds, which occurs at 75 °C lower than that of LIG (200 versus 275 °C). So phosphorylation appears to induce the degradation of the aliphatic side chain at lower temperature. As a consequence of the degraded structure, a slight increase of the release of aromatic compounds is observed for P-LIG. An assumption could be that phosphorus groups induce the cleavage of the weakest ether linkages at lower temperature. Above 300 °C, less aromatic compounds are released than in LIG. This decrease could be the consequence of the reactions promoted by phosphorylation at low temperature, thus resulting in a more thermally stable aromatic structure. Moreover, the disappearance of the second peak of CO2 release (425 to 800 °C), is observed. The phosphorus may act as antioxidant thus limiting the local oxidation of the phenolic groups. Finally, the phosphorylation does not impact the degradation of methoxy groups as the methane release is comparable to that of LIG.
Phosphorylation of lignin induces changes in the thermal degradation behavior. From the TGA-FTIR, it appears that phosphorylation promotes dehydration as well as accelerates the decarboxylation of lignin. Aliphatic side-chains cleavage is also favored. It results a much stable aromatic structure a high temperature since globally, less aromatic compounds are released. So according to TGA-FTIR, the gas composition of LIG and P-LIG is similar, however the distribution of the different gases and the temperature at which they are released are different.
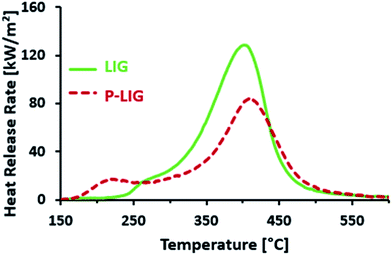
The combustibility of LIG and P-LIG was then investigated by micro-calorimetry with a Pyrolysis Combustion Flow Calorimeter (PCFC). The results are presented in Fig. 9 and Table 6. LIG releases combustible gases over a wide range of temperature, i.e. from 225 to 550 °C. The HRR reaches 128.7 W g−1 at 401 °C. The THR is about 14.2 kJ g−1. These results correlates with the data of TGA, as TMAX is only slightly shifted towards higher temperature and the amounts of residue are comparable. So PCFC results confirms the release of combustible gases from LIG. According to the previous TGA-FTIR analysis, even if any comparison should be done carefully as the pyrolysis heating rate was different, these combustible gases are composed of compounds made of aromatic and aliphatic groups, carbon monoxide and CH4 mostly. Moreover, no combustion is noticed between 180 and 250 °C although some products evolves (TONSET = 176 °C in TGA). This shows that the decomposition products between 180 and 225 °C are not combustible in those conditions. This observation is in good agreement with that below 225 °C, dehydration and decarboxylation are the main reactions occurring (release of water and carbon dioxide).
| PCFC results | TGA (60 °C min−1) | |||||||
|---|---|---|---|---|---|---|---|---|
| Tonset [°C] | TMAX [°C] | pHRR [W g−1] | THR [kJ g−1] | Res [%] | Tonset [°C] | TMAX [°C] | Res [%] | |
| LIG | 225 | 401 | 128.7 | 14.2 | 41 | 176 | 381 | 45 |
| P-LIG | 180 | 410 | 84.6, −35% | 12.1, −15% | 50 | 180 | 430 | 52 |
In the case of P-LIG, combustible gases release ranges from 180 to 550 °C which exhibits a HRR of 84.6 W g−1 occurring at 410 °C. The THR is decreased to 12.1 kJ g−1. Onset temperatures of PCFC and TGA are comparable, which shows that combustible gases are released when P-LIG starts to degrade. Aliphatic compounds as well as a few aromatic compounds are indeed released in this range of temperature, as it was evidenced by TGA-FTIR analysis. This observation is consistent with the previous conclusion, which reveals that the phosphorylation promotes also the cleavage of the aliphatic side chains. TMAX occurs at 410 °C although it was expected at 430 °C from the TGA analysis. Moreover, the full width at half maximum is larger in the case of LIG than that of P-LIG. So it can be assumed from this observation, in the case of P-LIG, that less combustible evolves at higher temperature than 410 °C (TMAX in TGA). This is in good agreement with the THR reduction of 15% in comparison to that of LIG. Release of high molar mass compounds from the charring residue may be an explanation of this limited combustibility.22 Indeed, the phosphorylation promotes the charring, and so the formation of high molecular and condensed compounds.
Condensed phase analysis
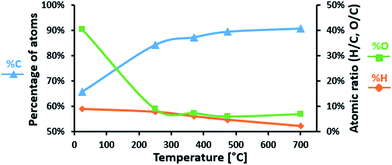
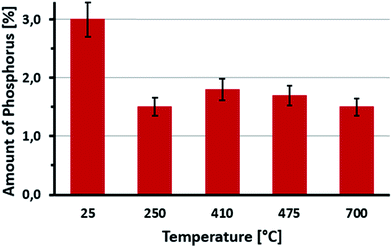
Elementary analysis of LIG and P-LIG as a function of the temperature in pyrolysis conditions was undertaken in order to evaluate the evolution of their chemical composition. Evolutions of carbon, oxygen, and hydrogen content in LIG are presented in Fig. 10. Nitrogen content was below 0.1%, sulfur content below 2.0% and therefore were not considered. During the first step of degradation (until 250 °C), significant decrease of oxygen content (%O) is observed as well as a slight decrease of hydrogen content (%H). This indicates that compounds containing oxygen and hydrogen are released. This is in good agreement with the gas phase analysis, and confirms that dehydration and decarboxylation are the main reactions occurring at this step. From 250 to 700 °C, carbon content (%C) slightly increases, as %O remains stable and %H almost reaches 0%. The decrease of H/C ratio is explained mainly by the release of methane occurring above 350 °C (from the methoxy groups). So the residue produced by lignin is a carbonaceous material, which contains some oxidized carbons (<10%). The presence of oxygen in the condensed phase at high temperature is relative to the initial composition of lignin. Polyphenols and other derivatives containing groups are indeed part of the polyaromatic structure of the char. Even if degradation compounds containing oxygen are released, there is still some oxygen in the structure of the final residue.The evolution of the chemical composition of P-LIG is very similar to that of LIG. The amount of phosphorus as a function of the temperature is presented in Fig. 11 to investigate if phosphorus remains in the condensed phase. At 250 °C, around half of the initial amount of phosphorus remains in the condensed phase, so around 1.5% of phosphorus is therefore volatilized in the gas phase below 250 °C. Above 250 °C, %P remains constant at 1.5% until 700 °C. Until 250 °C, phosphorus species are released in the gas phase, and an inhibition effect may be expected.23 However, it is difficult to make any definitive conclusion according to PCFC since only a very low HRR is noticed at this temperature. Above 250 °C, it can be assumed that the phosphorus acts only in the condensed phase of lignin during its thermal degradation.
LIG and P-LIG residues were analyzed by 13C and 31P solid state NMR in order to investigate the evolution of the structure of LIG or P-LIG during thermal degradation. Samples were treated in tubular furnace under pyrolysis conditions at selected temperatures from the TGA analysis (see Fig. 7). 13C CPMAS NMR (Fig. 12) permits to analyze the evolution of the lignin's backbone. By increasing the temperature from 25 °C to 475 °C, the aromatic character of LIG's chars becomes more important while lignin's substructures (aliphatic side chains) decrease. No significant changes are noticed between the initial step and 250 °C as only dehydration and decarboxylation occur (carboxylic carbon non observable because it overlaps with the spinning side band). A slight decrease of the α, β, γ carbons from ether linkages demonstrates that bonds between aromatic units begins to be cleaved. Then, at the DTGMAX temperature (370 °C), aromatic, methoxy, hydromethoxy and aliphatic carbons as well as ether bonds progressively disappear to form an aromatic char with still many phenolic groups (142 ppm) and few methoxy groups (55 ppm). Finally, the last step at 475 °C shows a full aromatic structure (centered at 125 ppm) with a few oxidized carbons in C–O–C configuration (152 ppm). These changes occurring in LIG structure were expected from the literature.24–26 The comparison of LIG and P-LIG chars shows that very similar spectra at comparable degradation step are observed. Only the structure at TMAX (370 °C for LIG, 410 °C for P-LIG) differs slightly, as P-LIG exhibits a more significant decrease of the peak at 146 ppm (C–O involves in the aliphatic bridge between aromatic parts) than LIG. This slight difference shows that the phosphorylation slightly promotes the cleavage of the aliphatic chain, which is in good agreement with the previous gas phase analysis. In conclusion no significant changes occurred in the degradation patterns of the lignin's carbon structure after the phosphorylation. It means that by increasing the temperature, structural backbone of lignin degrades to form a residue made of aromatic species.
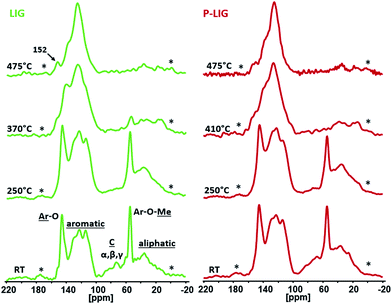 | ||
| Fig. 12 13C CPMAS NMR of LIG and P-LIG treated at different temperatures (pyrolysis conditions, rotation speed: 12.5 kHz). | ||
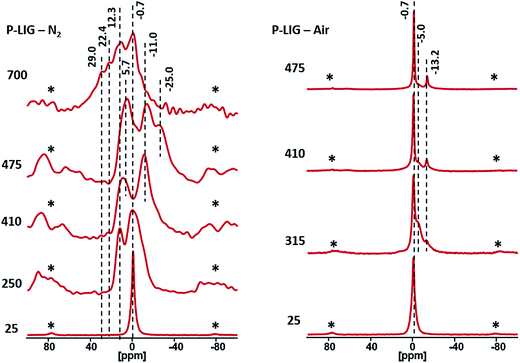
Chemical environment of phosphorus in P-LIG at different degradation steps (250, 410, 475 and 700 °C) was also investigated by 31P HPDEC NMR (Fig. 13). As solid state NMR induces significant signals broadening, a single peak is observed at −0.7 ppm in P-LIG, the two peaks noticed in liquid state were too close to be distinguished in solid state. At 250 °C, significant broadening of the peaks is noticed because of disordered structure (amorphization and dissymmetric/disordered phosphates). It is in good agreement with the fact that the structure of P-LIG starts to degrade, as previously seen by 13C NMR. Moreover, an additional signal indeed arises at 12.3 ppm (shifting to 5.7 ppm at 475 °C) and may be attributed to (RO)2P–OH, i.e. phosphonate structures.27,28 So phosphorus exhibits a new chemical environment, and therefore appears to interact with lignin. Reduction of phosphates (+V) in phosphonates (+III) is possible and well documented in the literature,29,30 however standard protocols require strong basic media and specific conditions, which are obviously not fulfilled in this system. Considering the lignin's structure, oxido-reduction reaction between phenols and phosphates leading to the formation of phosphonates and possibly quinones may be a reasonable assumption. Carbonyl carbon of quinone (benzoquinone as reference) is expected around 187.0 ppm, but is not clearly observed on the 13C NMR spectra, maybe because of the low concentration of such chemical groups. Further investigation would be required to verify this assumption.
When the temperature increases to 410 °C, shifting of the signals towards lower chemical shift is noticed. Formation of aromatic orthophosphates31 and pyrophosphates32 (0 to −11 ppm) occurred between 250 and 410 °C, which partially lead to polyphosphates (−25 ppm)33 at 475 °C. At advanced degradation state (700 °C), a large signal ranges from 50 to −30 ppm is observed. The broadening of the peaks shows that the char is disordered and so phosphorus exhibits many different chemical environments. Except the degradation of polyphosphates chains as the peak at −25 ppm disappeared, all species previously observed are still present in the char and the appearance of peaks at 29 and 22 ppm show that phosphonate and phosphonic acid are formed.27,28 Their presence suggests that a reductive phenomenon occurred at high temperature and in presence of lignin's degradation products.34 Under air conditions, pyro- (−5 ppm) and polyphosphates (−13.2 ppm) are formed at 315 °C, as phosphoric acid is noticed at 0 ppm. Then, at higher temperature, the pyrophosphates are converted in polyphosphates, which are stable. So phosphorus strongly interacts with the lignin structure during the degradation by forming different types of species, which enhances the thermal stability of the char. Polyphosphate chains are especially known for forming bridges between the different aromatic species.35 Moreover, phosphorus is known to prevent aromatic structures from oxidation.36
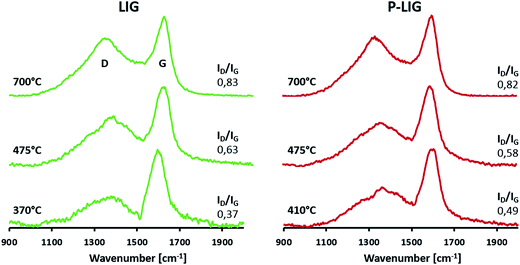
Graphitization evolution in the lignin's structures was analyzed by Raman spectroscopy. Fig. 14 shows that similar spectra were obtained for LIG and P-LIG, which exhibit two bands at 1595 (G band) and 1350 cm−1 (D band). At 250 °C, fluorescence phenomenon occurred during the analysis for both samples, which makes impossible the interpretation of the results. G-band may be assigned to the E2g vibrational mode of “organized” carbon, whereas D-band, also called defect band, is associated with A1g vibrational mode of carbon atoms with dangling bonds in the plane terminations of disordered graphite or glass carbons.37 Before degradation, none of these bands are noticed. Therefore appearance of these bands when increasing the temperature proves that a “turbostratic carbon” is formed during the degradation,37 in other words, a local structure of carbon species which is arranged as stacks of polyaromatic layers. At 370 and 410 °C, it appears that ID/IG ratio is higher for P-LIG than that of LIG. This means that the phosphorylation influences the formation of the lignin's char, which is more disordered. Such difference may have a role in the char development, as a high ordered structure is more exposed to constraints and therefore possible cracks. Then, ID/IG ratios are increasing along the degradation, thus showing that the carbonaceous structure becomes locally more disordered as lignin degrades. However, it was shown with XRD analysis that it does not negatively impact the organization the high-order structure. As P-LIG exhibits the same behavior than LIG, and that intensity ratios ID/IG are very close, it can be concluded that grafting of phosphorus (at 3% g g−1) on lignin does slightly influence its graphitization process when the char is developing, but does not modify the char's behavior at high temperature.38
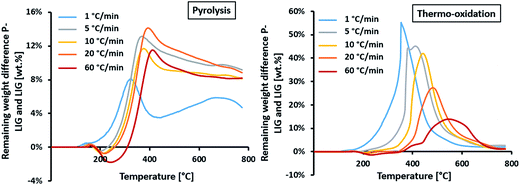
| TGDIFF = TGP-LIG − TGLIG | (1) |
In pyrolysis condition, similar behavior is observed at 5, 10, 20 and 60 °C min−1. A first destabilization, due to promoted dehydration and decarboxylation, is slightly favored with increasing the heating rate, reaching – 2% at 60 °C min−1. Then, a significant stabilization occurred above 300 °C which appears to be only slightly dependent of the heating rate as a plateau at ≈10% is reached above 500 °C. The heating rate slightly shifts the maximum of stabilization, from 390 to 440 °C at 5 and 60 °C min−1 respectively. This stabilization occurring in pyrolysis conditions shows that phosphorus acts as char promoter in lignin's structure,14 even at high heating rates. However, this effect is limited at 1 °C min−1 as the stabilization is only increased by 5 wt%, so probably reactions have time to take place (potentially rearrangement in the lignin's structure) and are competitive to those occurring with phosphorus at higher heating rate.
In thermo-oxidative condition, a slight destabilization occurs between 180 and 300 °C (depending on the heating rate) and is slightly favored as the heating rate increases. It can be concluded that dehydration and decarboxylation reactions are intrinsic to the phosphorylated lignin material and are not influenced by the atmosphere. Again, no destabilization is noticed at 1 °C min−1. Then, a significant stabilization is observed from 300 to 700 °C for every heating rate, except for 1 °C min−1 where it ranges from 150 to 600 °C. This stabilization shows that phosphorus prevents oxidation of the char produced during thermal decomposition of lignin.15 Moreover, this effect is kinetically dependent. It is observed that the maxima of TGDIFF falls from 55 to 14% at 1 and 60 °C min−1 respectively. So the higher the heating rate, the lower the protection of phosphorus. The maximum stabilization is also shifted towards higher temperature, from 380 to 570 °C at 1 and 60 °C min−1 respectively.
In pyrolysis condition, it was established that phosphorus increases the charring of lignin by promoting dehydration and decarboxylation. It appears that this phenomenon is not dependent of the heating rate, except at low heating rate. The prevention against oxidation of the char by phosphorus is less efficient as the heating rate increases. However, in any conditions, P-LIG exhibits superior thermal stability in comparison to LIG.
Conclusions
Phosphorylated lignin has been fully characterized using several techniques (liquid and solid states NMR, SEM, EPMA and TGA) which complete previous characterizations.6 Phosphate groups were covalently bonded to lignin, and 3% w/w of phosphorus is contained in the structure. The thermal stability of P-LIG was significantly enhanced in comparison to that of LIG. The thermal decomposition was investigated by analyzing both gas and condensed phases. The phosphorus promotes dehydration and decarboxylation reactions inducing a higher yield of carbonaceous residue. Different phosphorus species such as polyphosphates and phosphonates are formed during the degradation of the lignin which stabilizes the structure at moderate and high temperature. The resistance towards oxidation of lignin was enhanced, and the combustibility lowered. Finally, it was proven that the efficiency of phosphorus as prevention towards oxidation and char promoter is influenced by the heating rate, revealing complex mechanisms which still need to be investigated. These results are very important as the role of phosphorus in the thermal degradation of lignin was elucidated. These will help for example to better understand the mode of action of phosphorylated lignin as flame retardant for polymers. Further characterizations of the phosphorylated lignin, such as antimicrobial activity or antioxidant properties, should be considered in order to find suitable applications to this promising material.Acknowledgements
This work has received funding from the European Union's Seventh Framework Program for research, technological development and demonstration (Phoenix project, GA no. 310187). Therefore, the authors want to acknowledge all the partners from the FRP 7 Phoenix Project. The authors want also thanks M. Vandewalle, M. Doumert, M. Revel, M. Morin and M. Bria for having contributed to this work.References
- S. Laurichesse and L. Avérous, Prog. Polym. Sci., 2014, 39, 1266–1290 CrossRef CAS.
- A. Naseem, S. Tabasum, K. M. Zia, M. Zuber, M. Ali and A. Noreen, Int. J. Biol. Macromol., 2016, 93, 296–313 CrossRef CAS PubMed.
- X. Du, J. Li and M. E. Lindström, Ind. Crops Prod., 2014, 52, 729–735 CrossRef CAS.
- A. De Chirico, M. Armanini, P. Chini, G. Cioccolo, F. Provasoli and G. Audisio, Polym. Degrad. Stab., 2003, 79, 139–145 CrossRef CAS.
- Y. Yu, S. Fu, P. Song, X. Luo, Y. Jin, F. Lu, Q. Wu and J. Ye, Polym. Degrad. Stab., 2012, 97, 541–546 CrossRef CAS.
- B. Prieur, M. Meub, M. Wittemann, R. Klein, S. Bellayer, G. Fontaine and S. Bourbigot, Polym. Degrad. Stab., 2016, 127, 32–43 CrossRef CAS.
- M. K. Akalın, K. Tekin and S. Karagöz, Environ. Chem. Lett., 2017, 15, 29–41 CrossRef.
- L. Ferry, G. Dorez, A. Taguet, B. Otazaghine and J. M. Lopez-Cuesta, Polym. Degrad. Stab., 2015, 113, 135–143 CrossRef CAS.
- M. V. Efanov and A. I. Galochkin, Chem. Nat. Compd., 2012, 48, 457–459 CrossRef CAS.
- A. Granata and D. S. Argyropoulos, J. Agric. Food Chem., 1995, 43, 1538–1544 CrossRef CAS.
- R. E. Lyon and R. N. Walters, J. Anal. Appl. Pyrolysis, 2004, 71, 27–46 CrossRef CAS.
- K. M. Holtman, N. Chen, M. A. Chappell, J. F. Kadla, L. Xu and J. Mao, J. Agric. Food Chem., 2010, 58, 9882–9892 CrossRef CAS PubMed.
- M. Brebu and C. Vasile, Cellul. Chem. Technol., 2010, 44, 353–363 CAS.
- R. Dupretz, G. Fontaine and S. Bourbigot, J. Fire Sci., 2013, 32, 210–229 CrossRef.
- F. Trotta, M. Zanetti and G. Camino, Polym. Degrad. Stab., 2000, 69, 373–379 CrossRef CAS.
- X. Jiang, C. Li, T. Wang, B. Liu, Y. Chi and J. Yan, J. Anal. Appl. Pyrolysis, 2009, 84, 103–107 CrossRef CAS.
- R. Alén, E. Kuoppala and P. Oesch, J. Anal. Appl. Pyrolysis, 1996, 36, 137–148 CrossRef.
- Z. Ma, Q. Sun, J. Ye, Q. Yao and C. Zhao, J. Anal. Appl. Pyrolysis, 2016, 117, 116–124 CrossRef CAS.
- M. Brebu, T. Tamminen and I. Spiridon, J. Anal. Appl. Pyrolysis, 2013, 104, 531–539 CrossRef CAS.
- E. Avni, R. W. Coughlin, P. R. Solomon and H. H. King, Fuel, 1985, 64, 1495–1501 CrossRef CAS.
- Y. Zhong, X. Jing, S. Wang and Q. X. Jia, Polym. Degrad. Stab., 2016, 125, 97–104 CrossRef CAS.
- M. Coquelle, S. Duquesne, M. Casetta, J. Sun, S. Zhang and S. Bourbigot, Polym. Degrad. Stab., 2014, 106, 150–157 CrossRef CAS.
- B. Scharte, Materials, 2010, 3, 4710–4745 CrossRef.
- N. Brosse, R. El Hage, M. Chaouch, M. Pétrissans, S. Dumarçay and P. Gérardin, Polym. Degrad. Stab., 2010, 95, 1721–1726 CrossRef CAS.
- G. N. Inari, S. Mounguengui, S. Dumarçay, M. Pétrissans and P. Gérardin, Polym. Degrad. Stab., 2007, 92, 997–1002 CrossRef CAS.
- R. K. Sharma, J. B. Wooten, V. L. Baliga, X. Lin, W. G. Chan and M. R. Hajaligol, Fuel, 2004, 83, 1469–1482 CrossRef CAS.
- R. K. Harris, L. H. Merwin and G. Hägele, J. Chem. Soc., Faraday Trans. 1, 1989, 85, 1409–1423 RSC.
- R. K. Harris, L. H. Merwin and G. Hägele, J. Chem. Soc., Faraday Trans. 1, 1989, 85, 3899–3900 RSC.
- F. Hammerschmidt and S. Schmidt, Monatshefte für Chemie, 1997, 128, 1173–1180 CrossRef CAS.
- T. Johansson, J. Nilsson, M. Kullberg, G. Lavén, M. Sobkowski, A. Szymanska, M. Szymczak, A. Kraszewski and J. Stawinski, Nucleosides, Nucleotides Nucleic Acids, 2005, 24, 353–357 CAS.
- S. Bourbigot, M. Le Bras, R. Delobel and J. M. Trémillon, J. Chem. Soc., Faraday Trans., 1996, 92, 3435–3444 Search PubMed.
- D. Prochnow, A. R. Grimmer and D. Freude, Solid State Nucl. Magn. Reson., 2006, 30, 69–74 CrossRef CAS PubMed.
- M. Jimenez, S. Duquesne and S. Bourbigot, Thermochim. Acta, 2006, 449, 16–26 CrossRef CAS.
- A. Karrasch, E. Wawrzyn, B. Schartel and C. Jäger, Polym. Degrad. Stab., 2010, 95, 2525–2533 CrossRef CAS.
- S. Bourbigot, M. L. Bras and R. Delobel, Carbon, 1993, 31, 1219–1230 CrossRef CAS.
- D. W. McKee, C. L. Spiro and E. J. Lamby, Carbon, 1984, 22, 285–290 CrossRef CAS.
- M. Nakamizo, R. Kammereck and P. L. Walker Jr, Carbon, 1974, 12, 259–267 CrossRef CAS.
- F. C. Tai, S. C. Lee, C. H. Wei and S. L. Tyan, Mater. Trans., 2006, 47, 1847–1852 CrossRef CAS.
| This journal is © The Royal Society of Chemistry 2017 |

