 Open Access Article
Creative Commons Attribution 3.0 Unported Licence
Surface-plasmon-induced azo coupling reaction between nitro compounds on dendritic silver monitored by surface-enhanced Raman spectroscopy†
Feng-Hsuan Cho,
Shan-Chi Kuo and
Ying-Huang Lai *
*
Department of Chemistry, Tunghai University, No. 1727, Sec. 4, Taiwan Boulevard, 40704, Taichung, Taiwan. E-mail: yhlai@go.thu.edu.tw; Tel: +886(4)23590121 ext. 32216
First published on 7th February 2017
Abstract
Silver dendrites (Ag-Ds) were prepared by electrodeposition on a glassy carbon electrode (GCE) from a silver(I) sulfate solution containing cysteine. The dendritic Ag surface showed high Raman enhancement, enabling the detection of analytes from dilute solution by surface-enhanced Raman scattering (SERS). 4-Nitrothiophenol (4-NTP) was used as the probe molecule to examine the analyte-concentrating ability and SERS activity of Ag-Ds/GCE composite. The results indicate that the Ag-Ds/GCE composite exhibits a prominent SERS effect. The lowest 4-NTP detection limit obtained was 5.0 × 10⁻⁹ M. We used a 4-NTP-functionalized Ag-Ds as an analytic and catalytic platform for chemical reactions involving the conversion of 4-NTP to p-p′-dimercaptoazobenzene and azo coupling of 4-nitrobenzo-15-crown-5 to 4,4′-mercaptoazobenzene-15-crown-5-ether.
1. Introduction
Nanometer-sized plasmonic materials (i.e., silver, gold, and composites) exhibit unique chemical and physical properties that may find use in various applications such as molecular sensing, catalysis, and optoelectronics.1–5 Surface functionalization of nanostructured materials, which has become an important technique in nanotechnology and surface chemistry, can transform these plasmonic materials into valuable finished products. Plasmon-driven catalytic reactions have attracted attention in recent years because they create a new route for controlling catalytic reactions on metallic substrates.6–10 The most studied functional groups of reactants on the surface of metallic substrates exposed to laser excitation are amine or nitro groups dimerized into azo group. For example, 4-aminothiophenol (4-ATP) and 4-nitrothiophenol (4-NTP) dimerize into p-p′-dimercaptoazobenzene (DMAB). Recent studies suggest that the mechanism of conversion of aromatic nitro compounds is different from that of aromatic amines. For nitro compounds, dimerization is induced by hot electrons produced by surface plasmon decay.9 Hot electrons with high kinetic energy transfer to the nitro group of molecules and thus lead to the reduction of nitro-groups to azo-group. On the other hand, the mechanism of conversion of aromatic amines to azo products is independent of hot electrons from surface plasmon decay. Oxidation involves the transfer of plasmonic heat generated at the metal surface to the adsorbed aromatic amines, as well as the participation of oxidizing agents.11Extensive experimental studies of plasmon-driven catalysis have been conducted by using in situ surface-enhanced Raman spectroscopy (SERS).9,12 To achieve SERS detection and high efficiency in such plasmonic-driven catalytic reactions, the catalysts should have a large number of active catalytic sites for reaction and sufficient plasmonic cross-sections for light harvesting. Therefore, the vast surface area, catalytic activities, wide-range surface plasmon resonances (SPR), and open three-dimensional (3D) nanostructure of metal clusters are key characteristics that we considered for the fabrication of SERS-active substrates for the detection and monitoring of organic analytes during plasmon-driven catalytic reactions.13 Although the aforementioned studies examined plasmon-driven dimerization of 4-NTP to DMAB or 4-ATP to DMAB in their SERS experiments, to our knowledge, no study has performed plasmon-driven coupling reactions between different nitro molecules with Ag dendrites (Ag-Ds).
The formation of gold dendrites via electrochemical deposition using cysteine as a blocking molecule has been reported.14,15 This enhancement on metal dendrites, which act as very efficient SERS-active sites, may be ascribed to the strong local electromagnetic field generated.16–18 Metal dendrites are capable of efficiently catalyzing the transformation of absorbed molecules and sensitively monitoring the structural change of absorbed molecules through SPR derived from metal dendrites on a GCE. In the present study, we used an electrochemical pathway to prepare SERS-active substrates with silver dendrites (Ag-Ds). We also investigated the capability of Ag-Ds in sensing a typical organic analyte, 4-NTP, via SERS using laser excitation at 633 nm. Furthermore, we use 4-NTP-functionalized Ag-Ds as an analytic and catalytic platform for chemical reactions involving the conversion of 4-NTP to DMAB and the coupling reaction of 4-nitrobenzo-15-crown-5-ether (4-NB-15-C) to 4,4′-mercaptoazobenzene-15-crown-5-ether.
2. Experimental
2.1 Materials
Silver(I) sulfate (Ag2SO4, Merck), 4-NTP, 4-NB-15-C, and cysteine, (Acros, >99%) were used without further purification. Glassy carbon electrode (GCE) plate was the deposition substrate for surface characterization of the electrodeposited Au. Before use, the GCE surface was polished with a nanocloth and alumina slurries (0.3 and 0.05 μm) in sequence. The polished GCE was further cleaned in an ultrasonic bath of water and ethanol for 15 min and was thoroughly rinsed with ultrapure water.2.2 Preparation of Ag-Ds
Ag-Ds were prepared through a modification of Lin's method.14 Ag was electrodeposited on GCE in an aqueous solution of 1.0 × 10⁻³ M Ag2SO4, 0.5 M H2SO4, and 1.0 × 10⁻⁴ M cysteine. A conventional three-electrode system in an electrochemical workstation (CHI 614B) was employed for electrodeposition. A saturated calomel electrode (SCE) served as a reference electrode, and the counter electrode was a platinum wire. Square-wave potential pulses were applied to the GCE at a frequency of 5 s−1 for 1000 s. A pulsed potential form was used to reduce the effect of diffusion limitation on the electrodeposition rate. The lower and higher potentials of the square-wave pulse with respect to the SCE were set at −1.2 and −0.2 V, respectively.2.3 Material characterization
Field emission scanning electron microscopy (FESEM) measurements were made under a JEOL JSM-6700F microscope operated at an acceleration voltage of 3.0 kV. X-ray powder diffraction (XRD) patterns of the Ag-Ds/GCE composite were obtained by using a Philips X'Pert Pro MPD. X-ray photoemission spectroscopy (XPS) measurements were conducted at the 09A1 beamline of the national Synchrotron Radiation Research Center (NSRRC) in Taiwan. The onset of photoemission from an Au foil attached to the sample holder served as the Fermi level, which corresponds to zero binding energy. The photon energy used to obtain Ag3d XPS spectra was 620 eV.2.4 SERS measurements
Raman scattering spectra were obtained by using a micro-Raman system built in-house.19 Samples with 1 μm diameter were irradiated with laser at 632.8 nm (35 mW) by using a 40×/0.65 N.A. objective lens (Plan N, Olympus). The Raman band of a polystyrene (PS) plate at 1001.4 cm−1 was used to calibrate the spectrometer. The laser exposure time was 0.5 s for each spectrum. The average of the data for the three spectra was calculated for improved statistics. The SERS samples were prepared by immersing Ag-Ds/GCE composite in ethanol solutions containing different concentrations (1 mM to 5 nM, 1.0 ml) of 4-NTP for 0.5 h at ambient temperature. The electrode was then rinsed with deionized water to remove the non-chemisorbed 4-NTP.3. Results and discussion
3.1 Structural characterization of dendritic silver
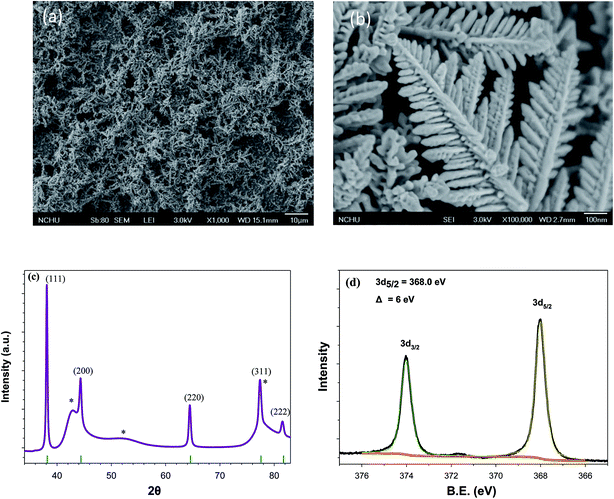
3D nanodendritic materials with large surface areas that allow the formation of hot spots are good candidates for increasing sensitivity.20 A high density of SERS-active sites at the tips, edges, and junctions of dendrites may facilitate SERS measurement. Many approaches have been developed to prepare dendritic noble metals through galvanic replacement, electrochemical techniques, seeding, and displacement reactions.21–23 Electrochemical techniques are conventional, reliable, and robust enough for the preparation of dendrites.In order to investigate the effect of SERS substrates on surface-plasmon-driven catalytic reactions, Ag-Ds/GCE composites were fabricated by using 0.5 M H2SO4–1.0 mM Ag2SO4–0.10 mM cysteine solution. A stepwise potential from −0.2 V to −1.2 V for 1000 s was applied. Fig. 1(a) shows a typical low-magnification SEM image of the prepared Ag-Ds/GCE composite. The SEM images show that the Ag-Ds reached several micrometers in length and had a large rough surface. Ag-Ds under high magnification, Fig. 1(b), had several branches that are oriented radially away from the main stem. There are numerous secondary leaves on each branch, resulting in the formation of Ag-Ds. The angle between each stem and leaf is ca. 68°.14 To characterize the composition and structure of the dendrites, XRD measurements were carried out. XRD patterns of the hierarchical Ag-Ds obtained on GCE substrates are shown in Fig. 1(c). Diffraction peaks with sharp features suggest that the prepared Ag-Ds were highly crystalline. Diffraction peaks associated with the (111), (200), (220), (311), and (222) planes of a face-centered cubic (fcc) Ag structure indicate that the dendritic nanostructures were crystalline silver.24 In addition, the intensity ratio of the diffraction peaks is similar to that of diffraction peaks of dendritic crystalline silver. Ratios of the diffraction peak intensities due to the (111) plane relative to those of the (200) and (220) planes were 2.8 and 4.2, respectively. This result indicates that the presence of cysteine in solution induces the electrodeposition of Ag along the 〈111〉 direction of the fcc crystalline structure.25 High-resolution XPS measurements were carried out to examine the state of Ag on the dendrites. Fig. 1(d) shows the Ag3d core-level spectra obtained after electrodeposition of Ag on a GCE. The Ag3d spectra can be fitted with a pair of doublet peaks at 368.0 and 374.0 eV, which correspond to 3d5/2 and 3d3/2 levels of metallic Ag atoms.26 All results from SEM, XRD, and XPS measurements suggest that we obtained highly dense and crystalline Ag-Ds.
3.2 SERS activity of the Ag-Ds/GCE composite
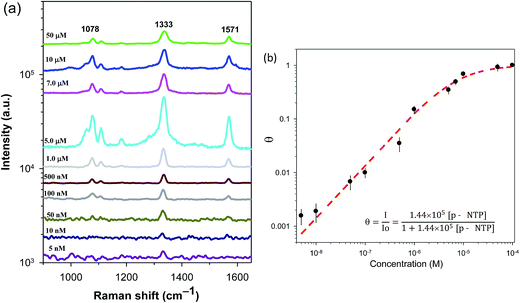
Dendritic materials with a roughened surface can provide a large surface area and a high density of hot spots for adsorbing reporter molecules. To determine whether the exposed surface of Au-Ds is an effective SERS substrate for the detection of adsorbed reporter molecules, we obtained SERS spectra for Ag-Ds/GCE composite at excitation wavelengths of 633 nm. The dependence of SERS intensities on the 4-NTP concentration was investigated by varying the 4-NTP concentration on the Ag-Ds/GCE composite. Fig. 2(a) shows the SERS spectrum of 4-NTP at 633 nm laser excitation. It has a distinct, sharp peak even in the case using the 5 nM 4-NTP solution. The SERS intensity increased greatly when the 4-NTP concentration increased from 5 nM to 100 μM. The SERS spectrum of 4-NTP is characterized by major, prominent bands at 1078, 1333, and 1571 cm−1, which respectively correspond to C–S, N–O, and C–C stretching vibrations.19,27,28 The SERS results here indicate that when Ag-Ds are densely packed on a GCE, they exhibit a prominent SERS effect. The higher SERS activity of dendritic silver nanostructures was probably caused by their unique morphology and electromagnetic enhancement at sharp edges or/and tips. The strongest band, ν(NO2) is used to identify the presence of 4-NTP and to calculate its intensity. By using the Langmuir adsorption isotherm, models can be used to interpret (1) the trends of Raman intensity versus changing organic molecule concentration, (2) the linear range (detection window) in these dendritic SERS substrates, and (3) the adsorption behavior of reporter molecules. Therefore, SERS intensities of 4-NTP follow Langmuir's adsorption isotherm equation, as shown in Fig. 2(b):29,30
 | (1) |
3.3 Influence of surface coverage of 4-NTP on the dimerization reaction
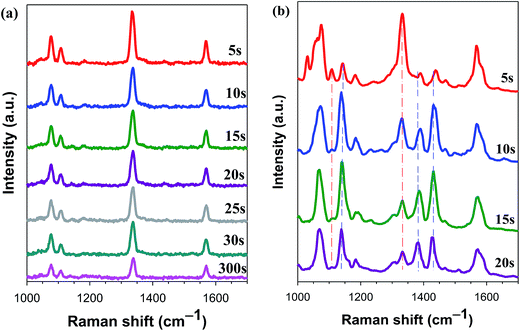
Dendritic silver was used as the photocatalytic and analytic platform for plasmon-driven chemical reaction to perform conversions (4-NTP → DMAB) with Ag-NPs/GCE composite. A solution containing Ag-Ds/GCE composite and 1.0 × 10⁻⁵ M 4-NTP (θ = 0.60) was aged for 0.5 h. The electrode was then rinsed with deionized water to remove the non-chemisorbed 4-NTP. In situ SERS spectra of Ag-Ds/GCE composite functionalized with 4-NTP under continuous exposure to a 633 nm laser with 0.6 mW power were then carried obtained. Upon laser exposure for the first 10 s, the SERS spectra exhibited band characteristics of 4-NTP, as shown in Fig. 3. An increase in laser exposure time produced peaks at 1141 cm−1, which correspond to β(C–H); and at 1389 and 1441 cm−1, which correspond to ν(N![[double bond, length as m-dash]](https://www.rsc.org/images/entities/char_e001.gif) N). These peaks suggest that a proportion of the 4-NTP molecules were converted to DMAB.11 The formation of DMAB may be the result of two adjacent 4-NTP molecules of Ag-Ds/GCE composite interacting with each other, forming DMAB with the aid of surface plasmons of Ag-Ds. Up to 75 s, the intensity of the Raman peak at 1441 cm−1 exceeded that of the peak at 1333 cm−1, but the Raman peaks of ν(NO2) of 4-NTP at 1110 and 1333 cm−1 did not disappear completely, even with further increase of the exposure time. In a separate experiment (Fig. S1†), we found that saturated monolayer adsorption of 4-NTP on the Ag surface of the Ag-Ds/GCE composite was completely converted into DMAB. In Fig. S1,† the ν(NO2) of 4-NTP is difficult to observe. In sharp contrast, the peaks at 1141 cm−1 due to β(C–H), as well as those at 1389 and 1441 cm−1 due to ν(N
N). These peaks suggest that a proportion of the 4-NTP molecules were converted to DMAB.11 The formation of DMAB may be the result of two adjacent 4-NTP molecules of Ag-Ds/GCE composite interacting with each other, forming DMAB with the aid of surface plasmons of Ag-Ds. Up to 75 s, the intensity of the Raman peak at 1441 cm−1 exceeded that of the peak at 1333 cm−1, but the Raman peaks of ν(NO2) of 4-NTP at 1110 and 1333 cm−1 did not disappear completely, even with further increase of the exposure time. In a separate experiment (Fig. S1†), we found that saturated monolayer adsorption of 4-NTP on the Ag surface of the Ag-Ds/GCE composite was completely converted into DMAB. In Fig. S1,† the ν(NO2) of 4-NTP is difficult to observe. In sharp contrast, the peaks at 1141 cm−1 due to β(C–H), as well as those at 1389 and 1441 cm−1 due to ν(N![[double bond, length as m-dash]](https://www.rsc.org/images/entities/char_e001.gif) N), are clearly visible in the spectrum. After continuous exposure to 633 nm laser for 60 s, the 4-NTP molecules were converted to DMAB.12,31 Even though the time of laser exposure was extended, the SERS intensity of DMAB showed no obvious change, indicating the completed dimerization of 4-NTP is. In general, SERS effect and chemical reaction rate are increasingly higher with the increase of energy and power.32,33 When the wavelength of the laser used was changed from 633 nm to 532 nm, the rate of dimerization reaction increased. When the 532 nm excitation laser was used, the time for completely converted into DMAB was several seconds (<5 s) and shorter than that when the 633 nm excitation laser was used at the same power. These results suggest that the dense distribution of Ag-Ds on a GCE results in strong enhancement of the local electromagnetic field, making the Ag-Ds/GCE composite an effective SERS platform for detecting structural changes in adsorbed reactants. Furthermore, the substantial difference in the extent of dimerization of 4-NTP could be explained by the surface coverage of 4-NTP.
N), are clearly visible in the spectrum. After continuous exposure to 633 nm laser for 60 s, the 4-NTP molecules were converted to DMAB.12,31 Even though the time of laser exposure was extended, the SERS intensity of DMAB showed no obvious change, indicating the completed dimerization of 4-NTP is. In general, SERS effect and chemical reaction rate are increasingly higher with the increase of energy and power.32,33 When the wavelength of the laser used was changed from 633 nm to 532 nm, the rate of dimerization reaction increased. When the 532 nm excitation laser was used, the time for completely converted into DMAB was several seconds (<5 s) and shorter than that when the 633 nm excitation laser was used at the same power. These results suggest that the dense distribution of Ag-Ds on a GCE results in strong enhancement of the local electromagnetic field, making the Ag-Ds/GCE composite an effective SERS platform for detecting structural changes in adsorbed reactants. Furthermore, the substantial difference in the extent of dimerization of 4-NTP could be explained by the surface coverage of 4-NTP.
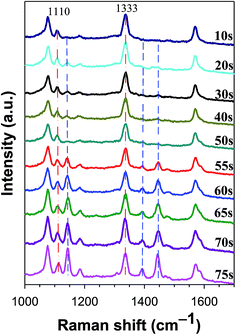 | ||
| Fig. 3 Time-dependent SERS spectra of 4-NTP (1.0 × 10⁻⁵ M, θ = 0.60) on a Ag-Ds/GCE composite under continuous 633 nm laser excitation. The spectra were obtained by using a laser power of 0.60 mW. | ||
3.4 Azo coupling reactions with a 4-NTP-functionalized Ag-Ds/GCE composite
We attempted to demonstrate the coupling reaction between 4-NTP and 4-NB-15-C, as shown in Fig. 4. Both 4-NB-15-C and 4-NTP molecules have a NO2 group (Fig. S2†), which can be used to study the plasmon-driven azo coupling of different nitro molecules. We modified a Ag-Ds/GCE composite with using surface plasmon to drive chemical reactions and simultaneously recorded SERS spectral changes. As shown in Fig. 5(a), 4-NTP on the Ag surface of Ag-Ds/GCE composite under continuous exposure to a 633 nm laser for 300 s was not converted to DMAB at low surface coverage of a 0.125 monolayer. The conversion of 4-NTP into DMAB must occur between two or more closely spaced Ag-Ds. At the same surface coverage, when a droplet of the 4-NB-15-C solution was drop cast on a 4-NTP-modified Ag-Ds/GCE composite. As shown in Fig. 5(b), the corresponding time-dependent SERS spectra are similar to the spectrum profile of DMAB. The spectra reveal peaks at 1381 and 1430 cm−1, which correspond to ν(N![[double bond, length as m-dash]](https://www.rsc.org/images/entities/char_e001.gif) N), suggesting that a proportion of the 4-NB-15-C molecules coupled with 4-NTP and formed azo compounds. Compared with those of DMAB, the N
N), suggesting that a proportion of the 4-NB-15-C molecules coupled with 4-NTP and formed azo compounds. Compared with those of DMAB, the N![[double bond, length as m-dash]](https://www.rsc.org/images/entities/char_e001.gif) N vibrations shifted to lower frequencies. Furthermore, the Raman peaks of ν(NO2) of 4-NTP at 1110 cm−1 diminished significantly, and those of ν(NO2) of 4-NB-15-C at 1333 cm−1 did not disappear completely. This observation implies that the limiting reagent in the azo coupling reaction was 4-NTP.
N vibrations shifted to lower frequencies. Furthermore, the Raman peaks of ν(NO2) of 4-NTP at 1110 cm−1 diminished significantly, and those of ν(NO2) of 4-NB-15-C at 1333 cm−1 did not disappear completely. This observation implies that the limiting reagent in the azo coupling reaction was 4-NTP.
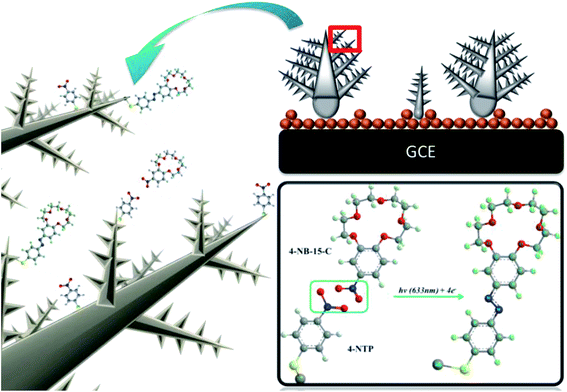 | ||
| Fig. 4 Schematic illustration of plasmon-driven surface-catalyzed reaction of 4-NB-15-C coupling monitored by using a Ag-Ds/GCE SERS substrate. | ||
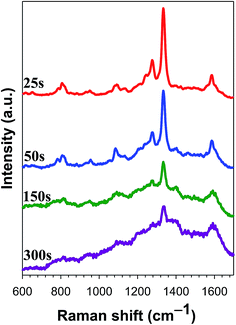
In a controlled experiment, the time-dependent SERS spectra of 4-NB-15-C on a Ag-Ds/GCE composite (Fig. 6) were recorded. We found that no plasmon-driven chemical reaction occurred in the absence of 4-NTP. This result suggests that the formation of azo compounds was driven by the 4-NTP-functionalized Ag-Ds catalyst. Further proof of the foreign 4-NB-15-C molecule coupling with 4-NTP was obtained azo compound with the surface plasmon of Ag-Ds.
4. Conclusions
Ag-Ds/GCE assemblies with sharp tips and edges were prepared through a simple electrochemical deposition method. On the basis of comprehensive SERS experiments, we found that GCE is an ideal substrate for Ag-Ds. Dense numbers of Ag-Ds immobilized on the GCE surface enable the concentration of 4-NTP molecules. The dependence of SERS intensities on the concentration of 4-NTP was investigated by varying the 4-NTP concentration of the Ag-Ds/GCE composite. The adsorption of 4-NTP onto the Ag surface of the composite occurs through chemisorption, consistent with the Langmuir isotherm. Quantitative SERS detection using the Ag-Ds/GCE composite has detection limits in the 5 nM concentration range. 4-NTP was converted to DMAB on the composite; this finding reveals that the composite is capable of catalyzing the transformation of absorbed molecules and sensitively monitoring the structural change of adsorbed molecules by catalyzing the reduction of Ag-Ds on GCE. Finally, we used 4-NB-15-C molecule, which contains a nitro group, in a reaction observed under a SERS. Further proof of the surface functionalization Au-Ds was obtained by performing a coupling reaction driven by the plasmon-driven catalytic reaction.Acknowledgements
The authors gratefully acknowledge the financial support from the Ministry of Science and Technology Taiwan (MOST 105-2113-M-029-007).References
- C. Costas, V. López-Puente, G. Bodelón, C. González-Bello, J. Pérez-Juste, I. Pastoriza-Santos and L. M. Liz-Marzán, ACS Nano, 2015, 9, 5567–5576 CrossRef CAS PubMed.
- A. Tripathi, E. D. Emmons, A. W. Fountain, J. A. Guicheteau, M. Moskovits and S. D. Christesen, ACS Nano, 2015, 9, 584–593 CrossRef CAS PubMed.
- Y. Wang, B. Yan and L. Chen, Chem. Rev., 2013, 113, 1391–1428 CrossRef CAS PubMed.
- S. Schlücker, Angew. Chem., Int. Ed., 2014, 53, 4756–4795 CrossRef PubMed.
- J. A. Dieringer, K. L. Wustholz, D. J. Masiello, J. P. Camden, S. L. Kleinman, G. C. Schatz and R. P. Van Duyne, J. Am. Chem. Soc., 2009, 131, 849–854 CrossRef CAS PubMed.
- M. Sun, Z. Zhang, H. Zheng and H. Xu, Sci. Rep., 2012, 2, 647 Search PubMed.
- X. Liang, T. You, D. Liu, X. Lang, E. Tan, J. Shi, P. Yin and L. Guo, Phys. Chem. Chem. Phys., 2015, 17, 10176–10181 RSC.
- P. Li, B. Ma, L. Yang and J. Liu, Chem. Commun., 2015, 51, 11394–11397 RSC.
- L. Kang, J. Chu, H. Zhao, P. Xu and M. Sun, J. Mater. Chem. C, 2015, 3, 9024–9037 RSC.
- L. Cui, P. Wang, Y. Fang, Y. Li and M. Sun, Sci. Rep., 2015, 5, 11920 CrossRef PubMed.
- P. Xu, L. Kang, N. H. Mack, K. S. Schanze, X. Han and H.-L. Wang, Sci. Rep., 2013, 3, 2997 Search PubMed.
- H.-Y. Wu, Y.-H. Lai, M.-S. Hsieh, S.-D. Lin, Y.-C. Li and T.-W. Lin, Adv. Mater. Interfaces, 2014, 1, 1400119 CrossRef.
- H. Liu, Z. Yang, L. Meng, Y. Sun, J. Wang, L. Yang, J. Liu and Z. Tian, J. Am. Chem. Soc., 2014, 136, 5332–5341 CrossRef CAS PubMed.
- T.-H. Lin, C.-W. Lin, H.-H. Liu, J.-T. Sheu and W.-H. Hung, Chem. Commun., 2011, 47, 2044–2046 RSC.
- F.-H. Cho, Y.-C. Lin and Y.-H. Lai, Appl. Surf. Sci., 2017, 402, 147–153 CrossRef CAS.
- Q. Teng, Z. Yongjin, L. Jiaqi, Z. Wenjun, L. Xianzhong, C. Tiejun and K. C. Paul, J. Phys. D: Appl. Phys., 2009, 42, 175403 CrossRef.
- K. Jasuja and V. Berry, ACS Nano, 2009, 3, 2358–2366 CrossRef CAS PubMed.
- X. Tang, W. Cai, L. Yang and J. Liu, Nanoscale, 2013, 5, 11193–11199 RSC.
- L.-P. Wang, S.-C. Kuo, U. S. Jeng and Y.-H. Lai, RSC Adv., 2015, 5, 37323–37329 RSC.
- G. Lu, C. Li and G. Shi, Chem. Mater., 2007, 19, 3433–3440 CrossRef CAS.
- X. Bai, Y. Gao and L. Zheng, CrystEngComm, 2011, 13, 3562–3568 RSC.
- S. J. Lee, A. R. Morrill and M. Moskovits, J. Am. Chem. Soc., 2006, 128, 2200–2201 CrossRef CAS PubMed.
- H. M. Song, L. Deng and N. M. Khashab, Nanoscale, 2013, 5, 4321–4329 RSC.
- G. Zhang, S. Sun, M. Cai, Y. Zhang, R. Li and X. Sun, Sci. Rep., 2013, 3, 1526 Search PubMed.
- M. Tian, J. Wang, J. Kurtz, T. E. Mallouk and M. H. W. Chan, Nano Lett., 2003, 3, 919–923 CrossRef CAS PubMed.
- Y. Wu, Z. Wang, S. Chen, J. Wu, X. Guo and Z. Liu, RSC Adv., 2015, 5, 87151–87156 RSC.
- E. M. van Schrojenstein Lantman, T. Deckert-Gaudig, A. J. G. Mank, V. Deckert and B. M. Weckhuysen, Nat. Nanotechnol., 2012, 7, 583–586 CrossRef CAS PubMed.
- S.-C. Kuo, J.-J. Tasi, J.-S. Li, Z.-H. Hou, C.-H. Li, U.-S. Jeng and Y.-H. Lai, APL Mater., 2014, 2, 113310 CrossRef.
- H. Wang, C. S. Levin and N. J. Halas, J. Am. Chem. Soc., 2005, 127, 14992–14993 CrossRef CAS PubMed.
- Y.-H. Lai, S.-C. Kuo, Y.-C. Hsieh, Y.-C. Tai, W.-H. Hung and U. S. Jeng, RSC Adv., 2016, 6, 13185–13192 RSC.
- X. Zhang, P. Wang, Z. Zhang, Y. Fang and M. Sun, Sci. Rep., 2014, 4, 5407 CAS.
- R. A. Álvarez-Puebla, J. Phys. Chem. Lett., 2012, 3, 857–866 CrossRef PubMed.
- T.-T. Tasi, T.-W. Lin, L.-D. Shao and H.-H. Shen, RSC Adv., 2016, 6, 29453–29459 RSC.
Footnote |
| † Electronic supplementary information (ESI) available. See DOI: 10.1039/c7ra00374a |
| This journal is © The Royal Society of Chemistry 2017 |

