 Open Access Article
Polystyrene/poly(dibenzo-18-crown-6) composite nanofibers for the selective adsorption of plasma catecholamines
LiQin Chena,
XingHua Zhub,
DanNi Huanga,
Zhen Xua,
Jun Shen *a and
WanQi Zhanga
aSchool of Public Health, Tianjin Medical University, Tianjin 300070, China. E-mail: shenjun@tmu.edu.cn; Fax: +86-22-83336638
bSchool of Pharmacy, Tianjin Medical University, Tianjin 300070, China
First published on 27th February 2017
Abstract
In this paper, 10 types of electrospun polystyrene (PS) nanofibers doped with poly(dibenzo-18-crown-6) (PDB18C6) were prepared and the ones which gave the best recovery of catecholamines – dopamine, norepinephrine and epinephrine from other interfering endogenous substances existing in the plasma matrix based on a previous study were selected. Furthermore, 10 types of composite nanofibers were characterized using scanning electron microscopy (SEM). The SEM results showed that the addition of PDB18C6 resulted in thicker nanofibers with rough surfaces. Furthermore, it was found that increases in the proportion of PS used led to higher mean fiber diameters (200 to 3000 nm). Batch adsorption experiments were conducted to evaluate the optimal composite nanofibers, which act as an adsorbent for selective extraction of catecholamines. At pH 7.5, composite nanofibers No. 10 (20% PS–5% PDB18C6 = 5![[thin space (1/6-em)]](https://www.rsc.org/images/entities/char_2009.gif) :
:![[thin space (1/6-em)]](https://www.rsc.org/images/entities/char_2009.gif) 2, v/v) can improve the extraction efficiency of the catecholamines in plasma with high reproducibility. In comparison with discrete crown ether modified nanofibers, the PDB18C6 functionalized nanofibers offered a polymer backbone to solve the problem of solubility in most solvents for crown ether monomers. Therefore, PDB18C6 functionalized nanofibers increased the complexing properties more than crown ether monomers. Furthermore, electrospinning was shown to be a very versatile tool to prepare PDB18C6 functional polymer adsorbents for the selective recovery of plasma catecholamines.
2, v/v) can improve the extraction efficiency of the catecholamines in plasma with high reproducibility. In comparison with discrete crown ether modified nanofibers, the PDB18C6 functionalized nanofibers offered a polymer backbone to solve the problem of solubility in most solvents for crown ether monomers. Therefore, PDB18C6 functionalized nanofibers increased the complexing properties more than crown ether monomers. Furthermore, electrospinning was shown to be a very versatile tool to prepare PDB18C6 functional polymer adsorbents for the selective recovery of plasma catecholamines.
Introduction
A variety of crown ethers have been developed, but they tend of a restricted range, namely the macrocyclic compounds containing oxygen (O) as donor atoms. Dibenzo-18-crown-6 (DB18C6) is one of the aromatic crown ethers found as by-products in the synthetic work by Pedersen in the mid-1960s.1 The discovery of crown ethers and the numerous remarkable attributes possessed by the crown compounds has made a great contribution to the metal–ligand interactions research.2 However, discrete crown ethers suffer from some serious limitations, including expense and toxicity, which restrict them being widely used. Therefore, the applications of crown ether polymer systems have expanded greatly in recent years.3–5 More attention has been focused on the exploration of supramolecular interactions between polymeric crown ethers and organic compounds. NH3+ is particularly appropriate for crown ether complexation, as noted in many previous studies.6,7Crown ether resins, also known as crown ether polymers, can form a host–guest complex with a variety of ions. The host molecules can form complexes with guest molecules by H-bonds, such as ammonium ions and some organic neutral molecules coordinate well to an 18-crown-6 ring.8 Numerous polymeric systems incorporating crown ethers have been reported as crown ether polymers possess some advantages that is absent in discrete crown ethers: (l) crown ether resins are recyclable because of their insolubility in water and most organic phases, (2) crown ether resins can be commercialized because of their low cost and toxicity, and (3) crown ether resins are solid, which means it is easy to process them into powder, granules and film. Up to now, the applications of crown ether resins have been reported for extraction and separation of metal ions and chiral material.9,10
DB18C6 is a well-known host molecule and has been the focus of much attention because of its ability to form stable complexes with metal ions and organic ammonium compounds. For example, Colombo et al. reported the detection of dopamine (DA) with a nanopipet electrode via assisted ion transfer by DB18C6.11 Later, Ortuño et al. reported that a variety of electrochemical methods were exploited in the determination, characterization and sensing of the neurotransmitter, 2-phenylethylamine, based on the ion transfer of its protonated form at a solvent polymeric membrane using DB18C6.7 Meanwhile, Mane et al. described a selective extraction method, which used polymer supported DB18C6 as an adsorbent for the extraction of strontium.12 Furthermore, Ahmadi et al. reported a DB18C6 moiety which was used to modify a novel magnetic multi-walled carbon nanotube, which was used for selective extraction and sensitive determination of amoxicillin.5 Both DB18C6 monomer and polymers containing DB18C6 moieties showed high selective complexation effects in the extraction of ions and organic amine compounds.
In this study, the host–guest complexation effect between crown ether molecules and catecholamines (CAs) was examined. It was determined that it can provide solutions for the pretreatment of CAs in biological samples, including enrichment of the targets and purification of the interference substances. Furthermore, nanofibers proved to be a good adsorbent and were applied in the solid phase extraction (SPE) and electrospinning as a versatile and powerful technique for nanofiber formation.13,14 Therefore, introduction of the crown ether groups to nanofiber materials using electrospinning technology for selective adsorption of CAs was evaluated in this study. In a previous study, a relatively complex crown ether polymer was used and the composite nanofibers comprising a polymeric crown ether with polystyrene (PS) were prepared using electrostatic spinning and were successfully applied in the extraction and purification of CAs in urine samples.15 In addition, crown ether resins were prepared with DB18C6 and paraformaldehyde and electrospun composite nanofibers doped with poly(dibenzo-18-crown-6) (PDB18C6) was successfully developed as a sorbent for selective extraction of plasma CAs.16
Recently, Tas et al. used electrospun PAN nanofibers functionalized with DB18C6 crown ether to recover of K+ from other ions in aqueous solutions.17 As far as is known, this is one of the few published studies that indicate the application of electrospinning technology in spinning composite nanofibers doped with crown ether for adsorption and separation. Based on the high K+ ion binding ability of DB18C6, this study constructed selective adsorption sites for K+ ion via electrospinning polymer nanofibers doped with DB18C6 monomer. Electrospinning is a convenient method for preparation of nanofiber materials, and introducing different kinds of functional groups into the nanofiber materials. Firstly, crown ether functional groups were introduced into nanofiber materials, however, some problems in adsorption efficiency and stability using nanofibers doped with monomers were found. Because of its solubility in organic solvent, the crown ether monomers can be easily eluted using an activated solvent, which then results in a decrease of adsorption sites on the nanofiber materials. Thus, there is no guarantee for adsorption stability of the materials used in fiber packed SPE (PFSPE). Therefore, a well-defined crown ether polymer was synthesized and introduced into nanofiber materials. The results showed that a large number of adsorption sites cannot be washed away, and thus the adsorption stability of the materials can be guaranteed, making it more suitable for solid adsorbent sample preparation.
This study evaluated the various electrospinning conditions for preparing composite nanofibers doped with PDB18C6 and their adsorption efficiency for CAs. The purpose of this study was to select the optimal experimental conditions for electrospinning composite nanofibers. Then the optimal composite nanofiber packed SPE were applied in the enrichment and purification of plasma CAs. The results showed that the different ratios of PDB18C6 has an effect on spinning and the application of composite nanofibers, including the fiber morphology and adsorption efficiency of the target compounds. It is believed that the introduction of PDB18C6 enhances the adsorption stability of electrospun nanofibers when compared with the introduction of crown ether monomers, which make PFSPE adsorption and filtration applications more promising and effective.
Experimental
Reagents
Epinephrine hydrochloride (E), norepinephrine bitartrate (NE), dopamine hydrochloride (DA), 3,4-dihydroxybenzylamine hydrobromide (DHBA) and diphenylborinic acid 2-aminoethyl ester (DPBA) were purchased from Sigma-Aldrich (St. Louis, MO, USA). High-performance liquid chromatography (HPLC) grade methanol, acetonitrile, paraformaldehyde and formic acid were purchased from the Tianjin Chemical Reagent Company (Tianjin, China) and all other reagents were of analytical grade. DB18C6 was purchased from Tianjin Heowns Biochemical Technologies Co., Ltd. PDB18C6 was synthesized in the laboratory of Tianjin Medical University.DHBA was used as an internal standard (IS) in quantitative measurement by HPLC. Solutions of CAs (1 mg mL−1) and IS (1 mg mL−1). Solutions of CAs (1 mg mL−1) and internal standard (DHBA) solutions were prepared by dissolving appropriate amounts of these chemicals in water and they were then stored in the dark at 4 °C. DPBA (2 mg mL−1, as a complexing reagent) was prepared by dissolving an appropriate amount of the compound in water.
Apparatus and chromatographic conditions
The HPLC-electrochemical detection (ECD) was performed using a Waters 1225 HPLC instrument connected to a Waters 2465 ECD (Waters, USA) with a glassy carbon working electrode, set at 0.7 V. A portion (50 μL) was injected into a YMC-Pack Pro C18 column (100 × 3.0 mm, 5 μm particle size) using a Waters-2707 autosampler. An HPLC software package (Waters, USA) was used for the data analysis. The mobile phase consisted of: 5.5% acetonitrile, 45 mM sodium dihydrogen phosphate, 35 mM citric acid, 2 mM sodium heptanesulfonate, 0.25 mM ethylenediaminetetraacetic acid (EDTA) and 2 M sodium hydroxide (NaOH; pH 4.2), which was used at a constant flow rate of 0.5 mL min−1.Plasma sample preparation
The study protocol was approved by the Tianjin Medical University Ethics Committee, operating in accordance with the Declaration of Helsinki. All participants gave their written informed consent before the beginning the study. The plasma was prepared from about 5 mL of whole blood, which was collected into a tube containing EDTA and centrifuged at 3000 rpm for 10 min. All the plasma samples were kept at −80 °C until analysis. A portion (25 μL) of DHBA (internal standard; 100 ng mL−1) was added to 500 μL of plasma sample, and the plasma mixture was vortex mixed and then 100 μL trichloroacetic acid (TCA) was added for protein deposition. After further vortex mixing and centrifuging at 10![[thin space (1/6-em)]](https://www.rsc.org/images/entities/char_2009.gif) 000 rpm for 10 min, the supernatant was adjusted to pH 7.5 with a phosphate buffer (pH 8). DPBA solution (50 μL of a 2 mg mL−1 solution) was added for further extraction.
000 rpm for 10 min, the supernatant was adjusted to pH 7.5 with a phosphate buffer (pH 8). DPBA solution (50 μL of a 2 mg mL−1 solution) was added for further extraction.
Crown ether polymerization
A DB18C6 monomer was polymerized to form a crown ether resin using paraformaldehyde and the detailed method can be found in a previous paper.16Electrospinning
The polystyrene (PS)/PDB18C6 composite nanofibers (PS–PDB18C6) were fabricated using electrospinning, according to the following procedures. First, an appropriate amount of PDB18C6 in dimethyl sulfoxide was dissolved to prepare PDB18C6 solution (w/v). PS solution was prepared by dissolving an appropriate amount of PS in a mixture of dimethylformamide and tetrahydrofuran (4![[thin space (1/6-em)]](https://www.rsc.org/images/entities/char_2009.gif) :
:![[thin space (1/6-em)]](https://www.rsc.org/images/entities/char_2009.gif) 6, v/v). The solution of PDB18C6 was dropped slowly into the PS solution and mixed until homogeneous (see detailed processing method in a discussion of the optimization of spinning parameters for PS–PDB18C6 composite nanofibers).
6, v/v). The solution of PDB18C6 was dropped slowly into the PS solution and mixed until homogeneous (see detailed processing method in a discussion of the optimization of spinning parameters for PS–PDB18C6 composite nanofibers).
This solution was loaded into a glass syringe (10 mL volume) with a stainless steel needle with a diameter of 0.5 mm and a flat tip, which was connected to the anode. The aluminum foil collecting equipment was connected to the cathode. The distance between the needle tip and the collector was 15 cm. A voltage of 20 kV was supplied from a Dongwen DW-P403-1AC high voltage generator (Tianjin, China). The feed rate of the precursor solution was fixed at 3.0 mL h−1. Processing (spinning voltage, advancing speed) was fine-tuned to ensure smooth spinning in some cases (see detailed processing method in a discussion of the optimization of the spinning parameters for PS–PDB18C6 composite nanofibers). The nanofibers were examined using a Hitachi S-3000N scanning electron microscope (Tokyo, Japan).
Extraction experiments
The procedure for preparing the packed nanofiber solid phase extraction (PFSPE) columns is described in a previous paper.15The SPE was performed as follows. The PFSPE column was firstly preconditioned using methanol and water (100 μL). Secondly, the sample was loaded on and pushed through the sorbent. Thirdly, the adsorbed target compounds were eluted with acetic acid solution (12 mol L−1; 50 μL), and water (50 μL) was added to the eluent. Finally, 50 μL of the eluate mixture was injected onto the HPLC column using an autosampler.
Results and discussion
The synthesis method of polymeric crown ether
This study introduces the polymerization of crown ethers using a reaction between DB18C6 and paraformaldehyde. The reaction temperature is 50 °C, and the solid product precipitation occurs in four to five hours. Then the final product can be obtained after precipitation and drying. Fig. 1 shows the infrared (IR) spectrum diagram of PDB18C6. Some characteristic absorption peaks can be observed, such as that at 3062 cm−1 which is the vibration of the absorption peak of benzene ring H; 2871 cm−1, at 2924 cm−1 for the C–H vibration absorption peak of methylene, peaks at 1593 cm−1, 1508 cm−1, 1453 cm−1 represent the C![[double bond, length as m-dash]](https://www.rsc.org/images/entities/char_e001.gif) C vibration absorption peak of the benzene ring, and peaks at 1255 cm−1 and 1130 cm−1 are the C–O–C vibration absorption peaks. Furthermore, the IR spectrum was consistent with that reported in a previous paper.18 Therefore, the structure of PDB18C6 was determined, and it also suggests that the one-step synthesis method is effective.
C vibration absorption peak of the benzene ring, and peaks at 1255 cm−1 and 1130 cm−1 are the C–O–C vibration absorption peaks. Furthermore, the IR spectrum was consistent with that reported in a previous paper.18 Therefore, the structure of PDB18C6 was determined, and it also suggests that the one-step synthesis method is effective.
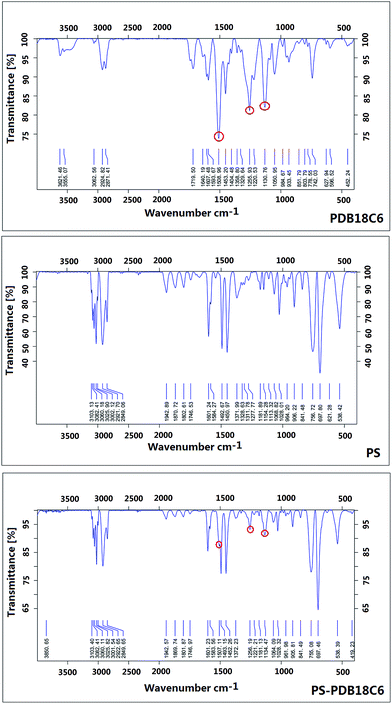 | ||
| Fig. 1 The IR spectra of the polymeric crown ether (PDB18C6), PS and PS–PDB18C6 prepared in this study. | ||
The infrared spectrum of PS–PDB18C6 composite nanofibers
The PDB18C6 cannot be electrospun alone because of the low viscoelasticity of the spinning solution. Therefore, fabrication of PS–PDB18C6 composite nanofibers using electrospinning was proposed. Fig. 1 shows the IR spectra of PS nanofiber and PS–PDB18C6 composite nanofibers. After comparing the IR spectra, it was found that the characteristic absorption peaks of PDB18C6 could still be found in the IR spectra of the composite nanofibers. Furthermore, the rest of the absorption peaks were matched with absorption peak position of PS, therefore, it was shown that the blend system of composite nanofibers consists of PDB18C6 and PS components, and the crown ether groups were successfully introduced into the nanofibers.Optimization of spinning parameters for PS–PDB18C6 composite nanofibers
The polymeric solution properties, processing conditions and ambient conditions will affect the fiber morphology and distribution of the adsorption sites. Furthermore, these characteristics can affect the adsorption efficiency of target CAs. Therefore, this study also investigated the effects of varying the proportions of the mixture, and 10 different ratios of spinning solutions were prepared (as shown in Table 1). The maximal solubility of PDB18C6 is 5%, whereas up to 30% of PS can be dissolved. So PS concentrations from 8% to 30% were chosen. Then the two materials were mixed according to the proportion shown in Table 1. In this study, ambient conditions (temperature, humidity) were held constant, and processing (spinning voltage, advancing speed) was fine-tuned to ensure smooth spinning. The effect of polymer solution properties on the fiber morphology were systematically investigated.| Type of fiber | PS | PDB18C6 | PS![[thin space (1/6-em)]](https://www.rsc.org/images/entities/char_2009.gif) : :![[thin space (1/6-em)]](https://www.rsc.org/images/entities/char_2009.gif) : PDB18C6 : PDB18C6 |
Spinning voltage | Advancing speed |
|---|---|---|---|---|---|
| No. 1 | 10% | 0% | 20 kV | 3 mL h−1 | |
| No. 2 | 10% | 1% | 5![[thin space (1/6-em)]](https://www.rsc.org/images/entities/char_2009.gif) : :![[thin space (1/6-em)]](https://www.rsc.org/images/entities/char_2009.gif) 2 2 |
20 kV | 3 mL h−1 |
| No. 3 | 10% | 2% | 5![[thin space (1/6-em)]](https://www.rsc.org/images/entities/char_2009.gif) : :![[thin space (1/6-em)]](https://www.rsc.org/images/entities/char_2009.gif) 2 2 |
20 kV | 3 mL h−1 |
| No. 4 | 10% | 5% | 5![[thin space (1/6-em)]](https://www.rsc.org/images/entities/char_2009.gif) : :![[thin space (1/6-em)]](https://www.rsc.org/images/entities/char_2009.gif) 2 2 |
20 kV | 3 mL h−1 |
| No. 5 | 10% | 5% | 4![[thin space (1/6-em)]](https://www.rsc.org/images/entities/char_2009.gif) : :![[thin space (1/6-em)]](https://www.rsc.org/images/entities/char_2009.gif) 2 2 |
20 kV | 3 mL h−1 |
| No. 6 | 10% | 5% | 2![[thin space (1/6-em)]](https://www.rsc.org/images/entities/char_2009.gif) : :![[thin space (1/6-em)]](https://www.rsc.org/images/entities/char_2009.gif) 2 2 |
20 kV | 3 mL h−1 |
| No. 7 | 8% | 5% | 5![[thin space (1/6-em)]](https://www.rsc.org/images/entities/char_2009.gif) : :![[thin space (1/6-em)]](https://www.rsc.org/images/entities/char_2009.gif) 2 2 |
20 kV | 3 mL h−1 |
| No. 8 | 12% | 5% | 5![[thin space (1/6-em)]](https://www.rsc.org/images/entities/char_2009.gif) : :![[thin space (1/6-em)]](https://www.rsc.org/images/entities/char_2009.gif) 2 2 |
20 kV | 2 mL h−1 |
| No. 9 | 15% | 5% | 5![[thin space (1/6-em)]](https://www.rsc.org/images/entities/char_2009.gif) : :![[thin space (1/6-em)]](https://www.rsc.org/images/entities/char_2009.gif) 2 2 |
20 kV | 2 mL h−1 |
| No. 10 | 20% | 5% | 5![[thin space (1/6-em)]](https://www.rsc.org/images/entities/char_2009.gif) : :![[thin space (1/6-em)]](https://www.rsc.org/images/entities/char_2009.gif) 2 2 |
19 kV | 2 mL h−1 |
| No. 11 | 30% | 5% | 5![[thin space (1/6-em)]](https://www.rsc.org/images/entities/char_2009.gif) : :![[thin space (1/6-em)]](https://www.rsc.org/images/entities/char_2009.gif) 2 2 |
26 kV | 1 mL h−1 |
Morphology of PS–PDB18C6 composite nanofibers
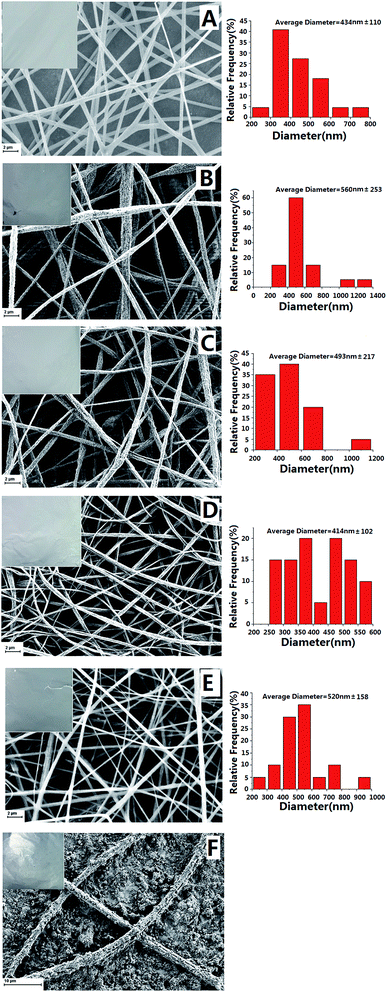
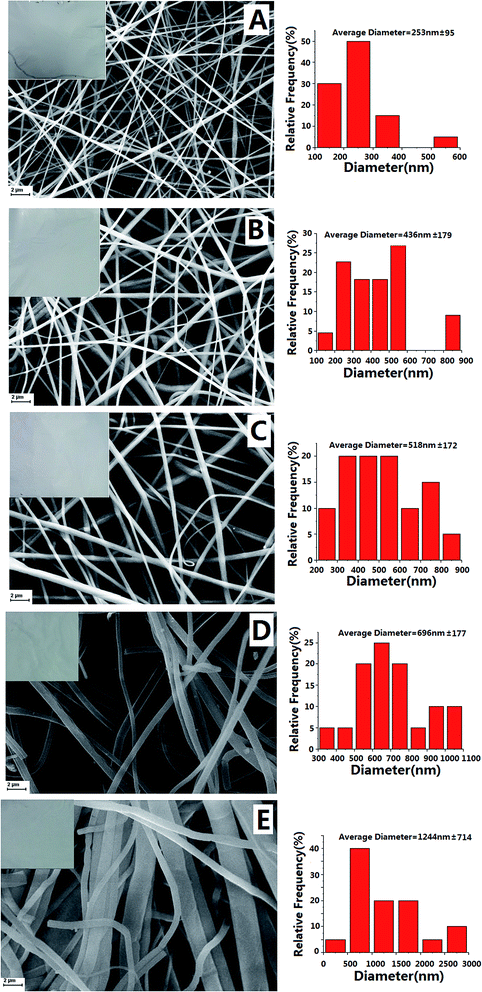
Morphologies of the neat and PDB18C6 modified PS nanofibers were characterized using SEM and the micrographs obtained are shown in Fig. 2 and 3. The distribution of the diameters of the nanofibers are also presented in Fig. 2 and 3. In Fig. 2, it can be seen that the PDB18C6 concentration varied when the voltage was kept constant at 20 kV with the same advancing speed of 3 mL h−1. Without PDB18C6, the neat PS nanofibers had a diameter of 434 ± 110 nm with a relatively smooth surface morphology. The PS–PDB18C6 composite nanofibers doped with 1%, 2% or 5% PDB18C6 had mean diameters of 560 ± 253 nm, 493 ± 217 nm and 414 ± 102 nm, respectively. The mean fiber diameter decreased with the increase of PDB18C6 concentration, and the variance of the fiber diameter was reduced. The concentrations of polymer solution have an important role in the fiber formation during the electrospinning process. Therefore, a mixture of beads and fibers can be obtained when the PDB18C6 concentration is reduced (1% and 2% PDB18C6) (as shown in Fig. 2B–C). When the concentration is suitable, smooth nanofibers can be obtained (as shown in Fig. 2D–E). In contrast, when the concentration of PDB18C6 is higher, it is difficult to obtain fibers (as shown in Fig. 2F). Therefore, it is assumed that continuous and smooth fibers can be obtained with the low PDB18C6 fractions.Fig. 3 shows the fibers that were obtained when the PS concentration was varied, whereas the PDB18C6 concentration was kept constant. The voltage and the advancing speed were fine-tuned. The mean PS–PDB18C6 composite fiber diameter increased with the increase of PS concentration, whereas the variance in the fiber diameter was also elevated. The findings in this study were consistent with the results reported in literature.13 Within the correct concentration range, increasing the concentration of solution causes the fiber diameter to be increased. Furthermore, the fiber appearance changed from a brittle membrane into fibrous cotton. Fiber No. 11 (30% PS–5% PDB18C6) showed a broader fiber diameter distribution, range from 200 nm to 3000 nm. After extensive consideration of the fiber appearance, the SEM micrographs and the degree of difficulty of the spinning process, it was shown that a lower PS concentration was not conducive to composite nanofiber spinning, and that the plasticity of the fiber improved significantly when PS concentration was increased up to 12%, making it easier to pack the fiber into the extraction column. Therefore, when the amount of PS (12–30%) and PDB18C6 (5%) were mixed properly, a uniform composite fiber can be obtained.
The optimal PS–PDB18C6 composite nanofibers for extraction of CAs
After the preliminary evaluation of the level of difficulty for the fiber spinning process and determining how to obtain the correct fiber morphology, the adsorption efficiency of the target compounds, CAs, was examined, and this is an important key parameter for the 10 kinds of composite nanofibers. Different pH levels affect the stability of the CAs as well as the adsorption effect of the adsorbent.16 Therefore, this study also evaluated the adsorption efficiency of CAs by using various fibers under different pH conditions, and the results are shown in Fig. 4. Because the stability of CAs and fiber adsorption efficiency under different pH conditions were reported in a previous study,16 this study focused on near neutral pH conditions. From the results shown in Fig. 4, it was determined that without changes of pH, the extraction efficiencies of the composite nanofibers with a PS concentration from 8% to 15% (No. 4, No. 7, No. 8 and No. 9) were relatively better than those obtained using the other concentrations. It was found that the extraction efficiency was poor and had a comparatively large efficiency range at pH 6.0. In contrast, the extraction efficiency had considerably improved at pH 7.0. However, pH 7.5 was found to be the optimal pH, a result which was consistent with that reported previously,16 and the extraction efficiency of nanofiber No. 10 was the highest. Although nanofiber No. 4 was used in a previous study,16 it was found that the extraction efficiencies of nanofibers No. 9 and No. 10 were better after the detailed exploration in this study. Therefore, nanofibers No. 9 and No. 10 were chosen for use in further analysis.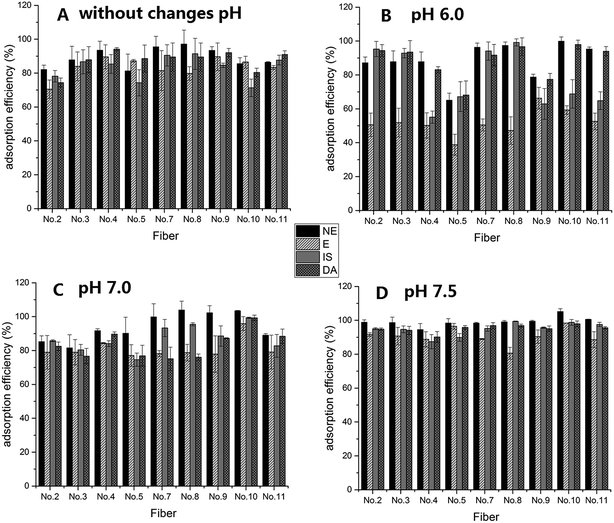 | ||
| Fig. 4 Adsorption efficiency of CAs using fibers at different levels of pH A: without changes in pH condition, B: at pH 6.0, C: at pH 7.0, D: at pH 7.5. | ||
Adsorption capacity of CAs by PS–PDB18C6 composite nanofibers
For the calculation of the breakthrough volume of the PFSPE column, the column (packed with 4 mg) was equilibrated with methanol followed by water, and then the CA solutions (10 μg mL−1) were slowly eluted through the column dropwise (100 μL at a time). The breakthrough volumes were calculated by the 10% of the leakage of the eluting solutions. The adsorption capacity of the CAs were NE: 0.96 μg mg−1, E: 0.93 μg mg−1, IS: 0.97 μg mg−1, and DA: 0.96 μg mg−1, in this study. From the results of the adsorption capacity, it was shown that the PS–PDB18C6 composite nanofibers were suitable as an adsorbent to be applied in the pretreatment of trace concentrations of CAs.The extraction experiment with spiked plasma
From the results obtained from the determination of the adsorption efficiency of CAs using PS–PDB18C6 composite nanofibers, nanofibers No. 9 and No. 10 were chosen to be used for the further determination of biological samples because of their excellent performance. The extraction experiment with spiked plasma was carried out at pH 7.0 and pH 7.5 with relatively good adsorption efficiency. A series of operations for blank plasma before extraction are shown in Table 2. Then, the sample was loaded on and pushed through the PFSPE column. Finally, the adsorbed target compounds were washed with 50 μL of water and eluted with 50 μL of 12.0 mol L−1 acetic acid solution. Water (50 μL) was added to the eluent, and then 50 μL of eluate mixture was injected onto the HPLC column with an autosampler. The treated plasma sample before PFSPE extraction (50 μL) was also injected into the HPLC system to calculate the extraction efficiency of plasma samples, and the results are shown in Table 3.| Blank plasma | CA standard solution (500 ng /mL−1) | TCA | Phosphate buffer containing 2 M NaOH | DPBA | pH | |
|---|---|---|---|---|---|---|
| 500 μL | 50 μL | 100 μL | Centrifugation and removal of supernatant (500 μL) | 800 μL pH 8.0 buffer + 35 μL 2 M NaOH | 50 μL | 7.0 |
| 500 μL | 50 μL | 100 μL | 800 μL pH 8.0 buffer + 40 μL 2 M NaOH | 50 μL | 7.2 | |
| 500 μL | 50 μL | 100 μL | 800 μL pH 8.0 buffer + 42 μL 2 M NaOH | 50 μL | 7.5 |
| CAs | pH = 7.0 | pH = 7.5 | ||
|---|---|---|---|---|
| No. 9 | No. 10 | No. 9 | No. 10 | |
| NE (%) | 99.1 ± 1.9 | 82.9 ± 0.4 | 102.0 ± 2.6 | 90.8 ± 5.2 |
| E (%) | 40.5 ± 7.0 | 35.5 ± 11.7 | 64.7 ± 4.5 | 62.1 ± 8.6 |
| IS (%) | 98.5 ± 2.0 | 97.8 ± 6.4 | 95.3 ± 1.2 | 108.9 ± 5.8 |
| DA (%) | 117.0 ± 8.3 | 83.0 ± 3.7 | 87.8 ± 8.5 | 89.5 ± 8.6 |
According to the extraction efficiency results of spiked plasma samples, pH 7.5 provided a higher extraction efficiency of E in comparison with pH 7.0. The extraction efficiency of the nanofibers between pH 7.0 and pH 7.5 was promising. Therefore, it is necessary to adjust the pH to 7.0 or 7.5 before PFSPE extraction.
The analysis of a real plasma sample
The amount of NE, E and DA were determined in one plasma sample, which was recovered from a healthy volunteer (n = 1). Triplicate analyses were performed, and the results are shown in Fig. 5. It was observed that the concentrations of NE and DA were 0.74 ng mL−1 and 0.21 ng mL−1, respectively. In contrast, NE cannot be detected in the same plasma sample if there is no extraction process (Fig. 6), and it is believed that the presence of endogenous substances were interfering with NE because the peak positions near NE do not match with that of standard solution. Meanwhile, E and DA were not detected in the plasma sample, and, this might contribute to their trace amount. Previous studies have reported the hypersecretion of CAs in a hemodialysis patient with pheochromocytoma19 and another patient with pheochromocytoma.20 Thus, it will be worthwhile to try to detect CAs in clinical plasma samples in the future. Limited numbers of blood samples were included in this study, and in the future, more samples as well as clinical samples should be obtained for further analysis. The PS–PDB18C6 composite nanofiber is an efficient and promising tool for extraction of human CAs.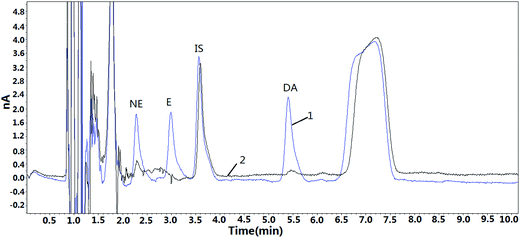 | ||
| Fig. 5 The chromatogram of a real plasma sample and a spiked plasma sample using PFSPE extraction 1: spiked plasma (2 ng mL−1, IS: 5 ng mL−1), 2: real plasma sample. | ||
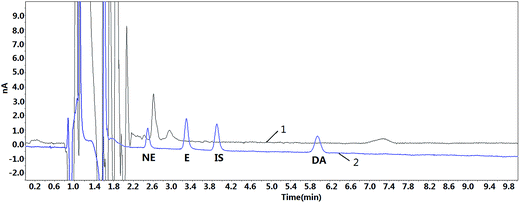 | ||
| Fig. 6 The chromatogram of a real plasma sample after acid precipitation without extraction and standard solution 1: real plasma sample; 2: standard solution (2 ng mL−1). | ||
Comparison between two types of composite nanofibers
It is easier to prepare nanofibers doped with DB18C6 in comparison with PDB18C6, however, problems in adsorption efficiency and stability of DB18C6 cannot be ignored. Table 4 shows the extraction efficiency of CAs obtained by using two types of composite nanofibers, and it was found that the PS–PDB18C6 composite nanofiber is preferred for CA pretreatment. Tas et al. reported the recovery of K+ in aqueous solutions by using electrospun PAN nanofibers functionalized with DB18C6.17 However, a low efficiency of the PS–DB18C6 composite nanofiber was obtained in this study. The reason was probably because the PFSPE column was pretreated with methanol, and the solubility of DB18C6 in methanol led to insufficient adsorption sites for CAs. In contrast, the adsorption sites cannot be affected because of the insolubility of PDB18C6 in methanol. Thus, electrospun PS nanofibers functionalized with PDB18C6 showed a better adsorption stability, which is more suitable for use with PFSPE in this study.| Nanofibers | Extraction efficiency of CAs | Solubility in methanol | |||
|---|---|---|---|---|---|
| NE (%) | E (%) | IS (%) | DA (%) | ||
| PS–PDB18C6 | 93.5 ± 5.3 | 89.6 ± 7.1 | 85.4 ± 5.5 | 94.1 ± 0.9 | PDB18C6 cannot dissolve in methanol |
| PS–DB18C6 | 65.3 ± 9.7 | 54.6 ± 11.8 | 60.4 ± 10.2 | 62.7 ± 7.8 | DB18C6 can dissolve in methanol |
Conclusions
PS/PS–PDB18C6 composite nanofibers containing different weight fractions of PDB18C6 and PS were prepared by electrospinning. The SEM microscopy images showed that the addition of PDB18C6 resulted in a rough and porous fiber surface. Uniform composite fibers can be obtained when the concentration of PS and PDB18C6 were in an appropriate ratio range. From the results of extraction of CAs, it was also found that composite fiber with a uniform morphology and cotton like appearance is more favorable for reloading the column and adsorption of CAs. PS/PDB18C6 composite nanofibers showed a better stability in adsorption sites than nanofibers doped with crown ether monomers. Furthermore, PDB18C6 functionalized nanofibers packed in columns for SPE is convenient for the simultaneous analysis of human CAs, and showed better extraction efficiency and resolution.Ethical standards
The data presented in the paper were testing data that had been obtained previously and stored anonymously.Conflict of interest
The authors declare no conflicts of interest.Acknowledgements
This work was supported by the National Natural Science Foundation of China (Nos. 81302469, 81330064) and the Tianjin Medical University Science Foundation (No. 2012KYM11).References
- G. W. Gokel, W. M. Leevy and M. E. Weber, Chem. Rev., 2004, 104, 2723–2750 CrossRef CAS PubMed.
- A. G. Vendilo, V. I. Chistov, J. M. Dikareva and К. I. Popov, Macroheterocycles, 2015, 8, 181–184 CrossRef CAS.
- M. Lee, S. Y. Oh, T. S. Pathak, I. R. Paeng, B. Y. Cho and K. J. Paeng, J. Chromatogr. A, 2007, 1160, 340–344 CrossRef CAS PubMed.
- M. Nogami, T. Haratani, Y. Tachibana, T. Kaneshiki, M. Nomura and T. Suzuki, J. Radioanal. Nucl. Chem., 2014, 303, 1549–1553 CrossRef.
- M. Ahmadi, T. Madrakian and A. Afkhami, Talanta, 2016, 148, 122–128 CrossRef CAS PubMed.
- S. Malehiat and J. Brodbelt, J. Am. Chem. Soc., 1993, 115, 2837–2843 CrossRef.
- J. A. Ortuño, J. M. Olmos, E. Torralba and A. Molina, Sens. Actuators, B, 2016, 222, 930–936 CrossRef.
- S. V. Smirnova, I. I. Torocheshnikova, A. A. Formanovsky and I. V. Pletnev, Anal. Bioanal. Chem., 2004, 378, 1369–1375 CrossRef CAS PubMed.
- L. Cai, Y. Zhao, S. Gong, L. Dong and C. Wu, Chromatographia, 2003, 58, 615–621 CAS.
- R. Kuhn, J. Chromatogr. A, 1994, 666, 367–373 CrossRef CAS.
- M. L. Colombo, S. McNeil, N. Iwai, A. Chang and M. Shen, J. Electrochem. Soc., 2015, 163, H3072–H3076 CrossRef.
- S. Mane, S. Ponrathnam and N. Chavan, J. Appl. Polym. Sci., 2016, 133(1), 42849 CrossRef.
- T. Subbiah, G. S. Bhat, R. W. Tock, S. Parameswaran and S. S. Ramkumar, J. Appl. Polym. Sci., 2005, 96, 557–569 CrossRef CAS.
- X. Kang, C. Pan, Q. Xu, Y. Yao, Y. Wang, D. Qi and Z. Gu, Anal. Chim. Acta, 2007, 587, 75–81 CrossRef CAS PubMed.
- L. Q. Chen, Y. Wang, J. S. Qu, J. J. Deng and X. J. Kang, Biomed. Chromatogr., 2015, 29, 103–109 CrossRef CAS PubMed.
- L. Chen, X. Zhu, J. Shen and W. Zhang, Anal. Bioanal. Chem., 2016, 408, 4987–4994 CrossRef CAS PubMed.
- S. Tas, O. Kaynan, E. Ozden-Yenigun and K. Nijmeijer, RSC Adv., 2016, 6, 3608–3616 RSC.
- H. Mao, Dissertation Dissertation, Chengdu University of Technology, 2008 Search PubMed.
- B. Vantomme, J. Donck, S. V. Hooland, A. Wauters, M. D. Clippele, V. Neirynck and F. Huysman, Hemodialysis International, 2016, 20, E6–E9 CrossRef PubMed.
- K. Yamamoto, N. Namba, T. Kubota, T. Usui, K. Takahashi, T. Kitaoka, M. Fujiwara, Y. Hori, S. Kogaki, T. Oue, E. Morii and K. Ozono, Clin. Pediatr. Endocrinol., 2016, 25, 59–65 CrossRef PubMed.
| This journal is © The Royal Society of Chemistry 2017 |

