 Open Access Article
Creative Commons Attribution 3.0 Unported Licence
Mn3O4 hollow microcubes and solid nanospheres derived from a metal formate framework for electrochemical capacitor applications†
Zhihe Liu,
Li Zhang *,
Guancheng Xu
 ,
Lu Zhang,
Dianzeng Jia* and
Chuyang Zhang
Key Laboratory of Energy Materials Chemistry (Xinjiang University), Ministry of Education, Key Laboratory of Advanced Functional Materials, Autonomous Region, Physics and Chemistry Detecting Center, Xinjiang University, Urumqi, 830046, Xinjiang, P. R. China. E-mail: zhanglixju@163.com; jdz0991@gmail.com; Fax: +86-991-8580586; Tel: +86-991-8580586
First published on 13th February 2017
Abstract
Mn3O4 hollow microcubes and solid nanospheres were selectively fabricated from a metal formate framework ([CH3NH3][Mn(HCOO)3]) by employing the ion exchange reaction in alkaline solution under different hydrothermal conditions. The relationships between Mn3O4 morphology and reaction molar ratio and reaction time were investigated. When used as the electrode materials for supercapacitors, Mn3O4 hollow microcubes and solid nanospheres had specific capacitances of 176 and 150 F g−1 respectively at a current density of 0.3 A g−1 in 1 M Na2SO4. The specific capacitance retentions of the Mn3O4 hollow microcubes and solid nanospheres were 95% and 86% respectively after 8000 charge–discharge cycles at a current density of 2 A g−1. Electrochemical results show that the Mn3O4 hollow microcubes and solid nanospheres exhibit acceptable specific capacitance and excellent cycling stability.
Introduction
In recent years, dramatic increases of fossil fuel consumption and environmental pollution have already become severe challenges, so it is urgent to develop sustainable energy storage and conversion devices. Widely regarded as clean energy-storage devices, supercapacitors have attracted great attention due to their rapid charging and discharging, high power density and long-term cycling stability.1–3 Generally, based on the energy storage mechanisms, there are two types of energy storage devices, i.e. electrical double layer capacitors (EDLCs) and pseudocapacitors.4,5 EDLCs store energy through fast reversible adsorption and desorption of ions on the electrode and electrolyte interface,6–9 and pseudocapacitors do so relying on fast redox reaction on the surface of electrode materials.10,11 Electrode materials affect the performance of electrochemical capacitors.Numerous electrode materials with high energy densities, such as NiO,12 RuO2,13 Co3O414 and MnO2,15 have been developed. Among various transition metal oxides, manganese oxides are promising electrode materials, mainly due to large potential window, low cost and environmental friendliness. However, the poor electrical/ionic conductivity and cycling stability of manganese oxides still limit their potential applications,16 which has been overcome by fabricating materials with hollow microstructures. Such attractive structures not only provide more active faradaic sites but also facilitate the transport of electrons and electrolyte ions.
In addition, materials with hollow microstructures have been applied in Li-ion batteries and supercapacitors due to large surface area, low density, and tunable architecture. At present, hollow structures have generally been prepared by the template method. Various templates (carbon spheres,17,18 polystyrene spheres,19 cuprous oxide, etc.20,21) have been developed to synthesize different hollow metal oxides, involving tedious template preparation and removal procedures though. Therefore, it is desirable to develop a facile approach to prepare metal oxides with hollow structures.
Metal–organic frameworks (MOFs) have attracted much interest owing to large surface area and porosity, thus having become promising candidates for catalysis,22,23 energy storage,24 and gas separation.25–28 Recently, MOFs have been used as novel templates to construct metals/metal oxides, carbon materials and metal oxide hybrids with well-defined morphologies under appropriate thermolysis conditions. For instance, Xu et al. fabricated porous α-Fe2O3 by annealing MIL-88-Fe.29 Salunkhe et al. synthesized porous carbon and cobalt oxide through thermolysis of ZIF-67.30 Zhang et al. synthesized Fe2O3 microboxes by annealing Fe4[Fe(CN)6]3.31 Moreover, some hollow metal oxides have been fabricated by alkaline-solution treatment of MOFs templates. For example, Zhang et al. prepared Fe2O3 hollow microboxes by alkaline-solution treatment of Fe4[Fe(CN)6]3.32 Zhang et al. synthesized Co3O4 hollow nanoboxes by reacting KCo[Fe(CN)6]·3H2O with NaOH solution.33 However, most synthetic procedures involve template calcination, so a facile approach is still in need to prepare hollow metal oxides.
In this study, we reported a facile strategy to prepare Mn3O4 hollow microcubes and solid nanospheres by employing the ion exchange reactions between a metal formate framework [CH3NH3][Mn(HCOO)3] and alkaline solution under different hydrothermal conditions. More importantly, when applied as supercapacitor electrode materials, Mn3O4 hollow microcubes and solid nanospheres had high specific capacitances of 176 F g−1 and 150 F g−1 respectively at a current density of 0.3 A g−1. The specific capacitance retentions of Mn3O4 hollow microcubes and solid nanospheres were 95% and 86% respectively after 8000 charge–discharge cycles at a current density of 2 A g−1.
Experimental
Chemicals
Manganese chloride (MnCl2·4H2O, 99%), methylamine (30–33% in methanol), anhydrous formic acid (98.5%), polyvinylpyrrolidone K30 (PVP-K30), sodium hydroxide and ethanol were commercially available and used without further purification.Synthesis of [CH3NH3][Mn(HCOO)3] microcube precursor
Cubic [CH3NH3][Mn(HCOO)3] precursor was synthesized as follows: CH3NH2 (5 mmol, 0.5171 g), HCOOH (5 mmol, 0.2301 g) and PVP-K30 (0.5 g) were dissolved in 25 mL of ethanol solution. Then 1 mmol MnCl2·4H2O (0.1979 g) and PVP-K30 (0.5 g) were dissolved in another 25 mL of ethanol, forming a homogeneous solution. Subsequently, the homogeneous solution was added dropwise into the former solution and reacted for 2 h. Finally, the white products were washed with ethanol several times and dried at 50 °C for 12 h.Synthesis of Mn3O4 hollow microcubes
Mn3O4 hollow microcubes were obtained by reacting precursor [CH3NH3][Mn(HCOO)3] with NaOH in a molar ratio of 10![[thin space (1/6-em)]](https://www.rsc.org/images/entities/char_2009.gif) :
:![[thin space (1/6-em)]](https://www.rsc.org/images/entities/char_2009.gif) 1. [CH3NH3][Mn(HCOO)3] (1 mmol, 0.2212 g) was dispersed into 50 mL of ethanol, and 0.1 mmol NaOH (0.004 g) was dissolved in 20 mL of ethanol and then added to the precursor solution with constant stirring. The mixture was transferred into a 100 mL autoclave and heated at 120 °C for 6 h. The final products were washed with deionized water and dried in an oven at 80 °C for 12 h.
1. [CH3NH3][Mn(HCOO)3] (1 mmol, 0.2212 g) was dispersed into 50 mL of ethanol, and 0.1 mmol NaOH (0.004 g) was dissolved in 20 mL of ethanol and then added to the precursor solution with constant stirring. The mixture was transferred into a 100 mL autoclave and heated at 120 °C for 6 h. The final products were washed with deionized water and dried in an oven at 80 °C for 12 h.
Synthesis of Mn3O4 solid nanospheres
Mn3O4 solid nanospheres were obtained by reacting precursor [CH3NH3][Mn(HCOO)3] with NaOH in a molar ratio of 1![[thin space (1/6-em)]](https://www.rsc.org/images/entities/char_2009.gif) :
:![[thin space (1/6-em)]](https://www.rsc.org/images/entities/char_2009.gif) 2. [CH3NH3][Mn(HCOO)3] (0.1 mmol, 0.0221 g) were dispersed in 50 mL of ethanol, and 0.2 mmol NaOH (0.008 g) was dissolved in 20 mL of ethanol and then added to precursor solution with constant stirring. The mixture was transferred into a 100 mL autoclave and heated at 120 °C for 24 h. The products were washed with deionized water and dried in an oven at 80 °C for 12 h.
2. [CH3NH3][Mn(HCOO)3] (0.1 mmol, 0.0221 g) were dispersed in 50 mL of ethanol, and 0.2 mmol NaOH (0.008 g) was dissolved in 20 mL of ethanol and then added to precursor solution with constant stirring. The mixture was transferred into a 100 mL autoclave and heated at 120 °C for 24 h. The products were washed with deionized water and dried in an oven at 80 °C for 12 h.
Characterizations
Powder X-ray diffraction (XRD) was carried out to examine the phase of the samples using a Bruker D8 X-ray diffractometer equipped with Cu-Kα radiation (λ = 1.5418 Å) ranging from 10° to 80°. The morphologies and microstructures of the samples were characterized by scanning electron microscopy (SEM, Hitachi, S-4800H) and transmission electron microscopy (TEM, JEOL, JEM-2010F). Fourier transform-infrared spectroscopy (FT-IR) was carried out on a BRUKER EQUINOX55 instrument. X-ray photoelectron spectra (XPS) were measured on Thermo ESCALAB 250 Xi instrument.Electrochemical measurements
Electrochemical performances of the Mn3O4 products were conducted using a three-electrode cell. The working electrode was prepared by mixing as-synthesized Mn3O4 with acetylene black and polytetrafluoroethylene at a weight ratio of 80![[thin space (1/6-em)]](https://www.rsc.org/images/entities/char_2009.gif) :
:![[thin space (1/6-em)]](https://www.rsc.org/images/entities/char_2009.gif) 15
15![[thin space (1/6-em)]](https://www.rsc.org/images/entities/char_2009.gif) :
:![[thin space (1/6-em)]](https://www.rsc.org/images/entities/char_2009.gif) 5 to form a homogeneous slurry. Then the slurry was pressed on the nickel foam current and dried at 60 °C for 12 h in a vacuum oven. The mixture pressed on the nickel foam was approximately 2.5 mg cm−2. Pt electrode and saturated calomel electrode (SCE) electrode were regarded as the counter and reference electrodes, respectively. All electrochemical measurements were performed at room temperature using an electrochemical workstation (CHI660D Chenhua, China) in a conventional three-electrode cell in 1 M Na2SO4 solution. Cyclic voltammetry (CV) was carried out at different scan rates ranging from 5 to 50 mV s−1 in the potential window of −0.2 to 0.8 V. The galvanostatic charge–discharge (GCD) curves were measured at different current densities within the potential window between −0.2 and 0.8 V. Electrochemical impedance spectroscopy (EIS) was conducted at a frequency range of 105 to 10−2 Hz.
5 to form a homogeneous slurry. Then the slurry was pressed on the nickel foam current and dried at 60 °C for 12 h in a vacuum oven. The mixture pressed on the nickel foam was approximately 2.5 mg cm−2. Pt electrode and saturated calomel electrode (SCE) electrode were regarded as the counter and reference electrodes, respectively. All electrochemical measurements were performed at room temperature using an electrochemical workstation (CHI660D Chenhua, China) in a conventional three-electrode cell in 1 M Na2SO4 solution. Cyclic voltammetry (CV) was carried out at different scan rates ranging from 5 to 50 mV s−1 in the potential window of −0.2 to 0.8 V. The galvanostatic charge–discharge (GCD) curves were measured at different current densities within the potential window between −0.2 and 0.8 V. Electrochemical impedance spectroscopy (EIS) was conducted at a frequency range of 105 to 10−2 Hz.
Results and discussion
Fig. 1a shows the schematic illustration of the formation of Mn3O4 hollow microcubes and solid nanospheres. The fabrication process was carried out through a two-step route.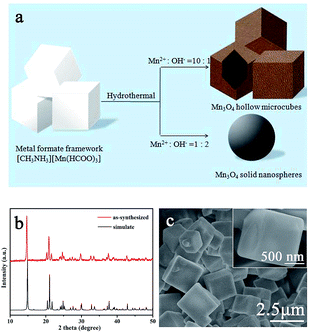 | ||
| Fig. 1 (a) Schematic illustration of the formation of Mn3O4 hollow microcubes and solid nanospheres. XRD patterns (b) and SEM images (c) of precursor. | ||
In the first step, metal formate framework [CH3NH3][Mn(HCOO)3] templates were synthesized by a modified precipitation method.34 Mn2+ reacted with formic acid neutralized by methylamine in ethanol solution at room temperature. The obtained precursors were characterized by XRD. As shown in Fig. 1b, all the diffraction peaks correspond to the simulated results, indicating they were single-phase products. The morphology of precursor was investigated by low-magnification SEM (Fig. 1c). The precursor had cubic shape and an average size of about 2 μm, and the surface was smooth.
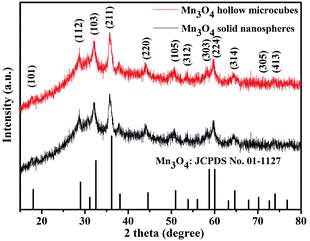
In the next step, Mn3O4 was obtained by alkaline-solution treatment of the precursor under hydrothermal condition. According to the XRD results (Fig. 2), all the diffraction peaks can be well indexed to the tetragonal phase of Mn3O4 (space group I41/amd) with JCPDS card no. 01-1127, indicating high purity of the samples. Note that all the diffraction peaks of the products are significantly broaden in width and weaken in intensity, suggested that the as-obtained Mn3O4 are essentially constructed with nanosized primary crystallites. Additionally, the chemical compositions of the products were also analyzed by XPS. As shown in Fig. 3a and b, the main peaks located at 284.9, 530.1 and 641.0 correspond to C 1s, O 1s and Mn 2p, respectively. The Mn 2p spectra (Fig. 3c) were disassembled into four peaks: 641.2 and 654.1 eV corresponding to Mn2+, while the peaks located at 642.9 and 652.9 eV corresponding to Mn3+.35 Particularly, the spin orbital separation between the binding energy peaks of Mn 2p1/2 and Mn 2p3/2 was 11.7 eV, which was in good agreement with those reported for Mn3O4.36,37 Moreover, in the O 1s spectra (Fig. 3d), the binding energy located at 529.8 and 531.4 eV can be attributed to the lattice oxygen in Mn3O4 and H2O, respectively.36 Therefore, both XRD and XPS results verified successful synthesis of Mn3O4.
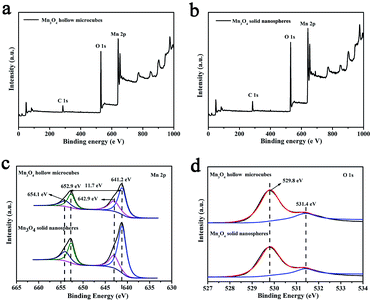 | ||
| Fig. 3 XPS survey spectra for Mn3O4 hollow microcubes (a) and solid nanospheres (b); XPS spectra of Mn 2p (c) and O 1s (d). | ||
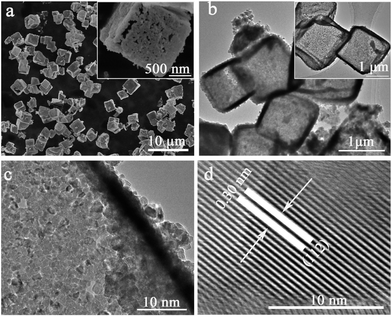
The morphologies and microstructures of the products were characterized by SEM and TEM. SEM images (Fig. 4a) show that Mn3O4 hollow microcubes inherit the cubic shape of precursor with the average size of about 2 μm. Moreover, inset of Fig. 4a reveals the porous structure of hollow microcubes. TEM images (Fig. 4b and c) further confirm that Mn3O4 hollow microcubes are comprised of a large number of small nanoparticles. HRTEM image (Fig. 4d) shows that the d-spacing value is approximately 0.30 nm, corresponding to the (112) plane of Mn3O4.
In alkaline solution, the ion exchange reaction took place as described below: [CH3NH3][Mn(HCOO)3](s) + 2OH−(aq) = Mn(OH)2(s) + 3HCOO−(aq) + CH3NH3+(aq). With the reaction proceeding, OH− ions continuously flowed inward and Mn2+ ions diffused outward to maintain this reaction. Then the precursor microcubes were gradually depleted, followed by growth of the Mn(OH)2 shell. The ion exchange reaction was verified by FT-IR analyses (Fig. S1†). In the FT-IR spectrum of precursor, the dominant peaks located at 1350 and 1600 cm−1 were attributed to HCOO−. The broad peaks located at 2865 and 3112 cm−1 were attributed to C–H and C–N stretching, respectively.34 After NaOH treatment, the peaks of HCOO−, C–H and C–N were decreased obviously, while OH− peak (3500 cm−1) was appeared in the FI-TR spectrum of the product. The FT-IR spectra results evidenced the ion exchange reaction between HCOO− and OH−. As Mn(OH)2 can be easily oxidized by oxygen in autoclave during the hydrothermal process,38–40 Mn3O4 was formed, and the formation process can be postulated below:
| 4Mn(OH)2(s) + O2(g) = 4MnOOH(s) + 2H2O | (1) |
| 2Mn(OH)2(s) + 4MnOOH(s) = 2Mn3O4(s) + 4H2O | (2) |
The effects of reaction conditions (reaction time and molar ratio) on the morphology of Mn3O4 were further investigated. When precursor [CH3NH3][Mn(HCOO)3] reacted with NaOH in a molar ratio of 10![[thin space (1/6-em)]](https://www.rsc.org/images/entities/char_2009.gif) :
:![[thin space (1/6-em)]](https://www.rsc.org/images/entities/char_2009.gif) 1 and the reaction time was 6 h, OH− ions were insufficient, and the ion exchange reaction was slow and incomplete. Finally, the residual precursors were dissolved in water, giving Mn3O4 hollow microcubes. When the molar ratio of [CH3NH3][Mn(HCOO)3] to NaOH was kept at 10
1 and the reaction time was 6 h, OH− ions were insufficient, and the ion exchange reaction was slow and incomplete. Finally, the residual precursors were dissolved in water, giving Mn3O4 hollow microcubes. When the molar ratio of [CH3NH3][Mn(HCOO)3] to NaOH was kept at 10![[thin space (1/6-em)]](https://www.rsc.org/images/entities/char_2009.gif) :
:![[thin space (1/6-em)]](https://www.rsc.org/images/entities/char_2009.gif) 1 and the hydrothermal reaction time was prolonged to 12 h, the product was still pure Mn3O4 (Fig. S2†). However, Mn3O4 hollow microcubes were partly broken with the shell thickness increased (Fig. S3†). When the molar ratio was changed to 1
1 and the hydrothermal reaction time was prolonged to 12 h, the product was still pure Mn3O4 (Fig. S2†). However, Mn3O4 hollow microcubes were partly broken with the shell thickness increased (Fig. S3†). When the molar ratio was changed to 1![[thin space (1/6-em)]](https://www.rsc.org/images/entities/char_2009.gif) :
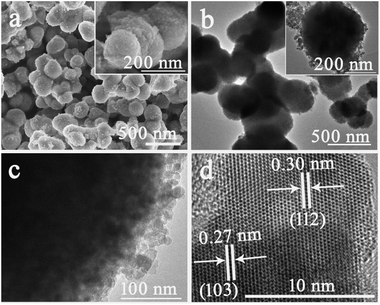
:![[thin space (1/6-em)]](https://www.rsc.org/images/entities/char_2009.gif) 2 and the reaction time was 6 h, Mn3O4 nanoparticles were obtained (Fig. S4†). As the reaction time was then prolonged to 24 h, Mn3O4 solid nanospheres with larger sizes were generated instead. SEM image (Fig. 5a) shows that Mn3O4 solid nanospheres are randomly arranged into a cluster with coarse surface, and the average diameter is about 300 nm. TEM images (Fig. 5b and c) display the solid nanospheres consist of numerous nanoparticles, evidencing the formation of Mn3O4 solid nanospheres through the assembly of small nanoparticles. HRTEM image (Fig. 5d) presents that the lattice spacings are about 0.27 and 0.30 nm, which can be assigned to the (103) and (112) planes of Mn3O4 respectively.
2 and the reaction time was 6 h, Mn3O4 nanoparticles were obtained (Fig. S4†). As the reaction time was then prolonged to 24 h, Mn3O4 solid nanospheres with larger sizes were generated instead. SEM image (Fig. 5a) shows that Mn3O4 solid nanospheres are randomly arranged into a cluster with coarse surface, and the average diameter is about 300 nm. TEM images (Fig. 5b and c) display the solid nanospheres consist of numerous nanoparticles, evidencing the formation of Mn3O4 solid nanospheres through the assembly of small nanoparticles. HRTEM image (Fig. 5d) presents that the lattice spacings are about 0.27 and 0.30 nm, which can be assigned to the (103) and (112) planes of Mn3O4 respectively.
Based on the above results, we propose the formation mechanism for the Mn3O4 hollow microcubes and solid nanospheres with secondary structures. As the alkaline solution is insufficient firstly, Mn(OH)2 nanoparticles are formed. When the concentration of OH− ions is appropriate, OH− ions continuously flow inward and Mn2+ ions diffuse outward, leading to the formation of well-distributed Mn(OH)2 shell on the precursor surface. Finally, Mn3O4 hollow microcubes are obtained with the dissolution of the residual precursors. When the concentration of OH− ions is increased, the excess OH− ions significantly accelerate the ion exchange reaction. The cubic structure is destroyed completely in the initial stage of the ion exchange reaction. Therefore, Mn3O4 nanoparticles and solid nanospheres are generated with the extension of the reaction time.
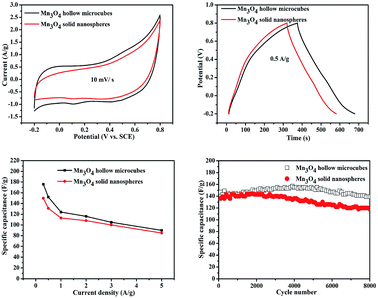
The electrochemical properties of Mn3O4 electrode materials were evaluated by CV, GCD and cycling stability in 1 M aqueous Na2SO4 solution. Fig. S5† shows the CV and GCD curves of Mn3O4 hollow microcubes and solid nanospheres at various scan rates (from 5 to 50 mV s−1) and current densities (from 0.3 to 5 A g−1). Fig. 6a shows the CV curves of Mn3O4 hollow microcubes and solid nanospheres electrodes at the scan rate of 10 mV s−1 in the potential window of −0.2 to 0.8 V vs. SCE. Each CV curve has almost rectangular shape and symmetry, indicating a typical pseudocapacitor feature. Fig. 6b gives the measured GCD curves of Mn3O4 hollow microcubes and solid nanospheres electrodes at the current density of 0.5 A g−1. The specific capacitances can be calculated from the discharge curves according to the following equation:
| C = IΔt/mΔV | (3) |
The long-term cycling stability of Mn3O4 hollow microcubes and solid nanospheres is shown in Fig. 6d. The specific capacitance of Mn3O4 solid nanospheres remained in the first 3000 cycles and decreased slightly over the next 5000 cycles. The specific capacitance of Mn3O4 hollow microcubes increased slightly in the first 5000 cycles and decreased slightly over the next 3000 cycles. The results can mainly be ascribed to the activation of electrode materials, as the electrolyte needed time to penetrate their inner space.41
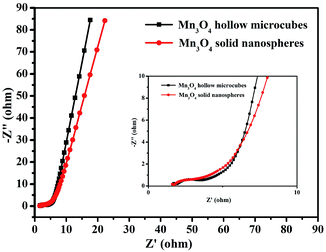
EIS was performed to evaluate the electrochemical performances of the two Mn3O4 electrodes with different morphologies. As exhibited in Fig. 7, the two depressed semicircles in the high-frequency region correspond to the resistances of electrolyte. The resistances of Mn3O4 hollow microcubes and solid nanospheres were 1.43 and 1.76 Ω, respectively, revealing that the formers had higher electron transfer ability. A straight line in the low-frequency region represented the Warburg impedance, as the electrolyte diffusion into electrode materials. Since Mn3O4 hollow microcubes exhibit a more vertical line than Mn3O4 solid nanospheres do, the formers had lower diffusive resistance. In short, the better electrochemical performance of Mn3O4 hollow microcubes can be attributed to the more active sites and lower diffusive resistance. We compared the electrochemical performance of Mn3O4 hollow microcubes and solid nanospheres with the reported Mn3O4 based electrode materials especially taking into consideration the existence of additional carbon modifications, which are listed in Table S1.†42–46 The comparison further suggests that the Mn3O4 hollow microcubes and solid nanospheres exhibit improved electrochemical performance with better capacitance and excellent cycling stability.
Conclusions
In summary, we reported a facile strategy to prepare two Mn3O4 products with different morphologies from an MOF template. When used as supercapacitor electrode materials, Mn3O4 hollow microcubes and solid nanospheres had high specific capacitances of 176 F g−1 and 150 F g−1 respectively at a current density of 0.3 A g−1, and the specific capacitance retentions were 95% and 86% respectively after 8000 charge–discharge cycles at a current density of 2 A g−1. Mn3O4 hollow microcubes had higher specific capacitance than that of Mn3O4 solid nanospheres, because the formers had more active sites and lower diffusive resistance. The fabricated Mn3O4 hollow microcubes and solid nanospheres are promising for supercapacitor applications.Acknowledgements
This work was financially supported by National Science Foundation of China (No. 21661029, 21471127, 21301146), Key Laboratory Open Research Foundation (No. 2016D03008), Technological Innovation Youth Training Project of Xinjiang Autonomous Region (No. 2013721017) and Natural Science Fund for Distinguished Young Scholars of Xinjiang Autonomous Region (No. 2013711008).Notes and references
- J. R. Miller and P. Simon, Science, 2008, 321, 651–652 CrossRef CAS PubMed.
- M. F. El-Kady, V. Strong, S. Dubin and R. B. Kaner, Science, 2012, 335, 1326–1330 CrossRef CAS PubMed.
- P. Simon, Y. Gogotsi and B. Dunn, Science, 2014, 343, 1210–1211 CrossRef CAS PubMed.
- X. Zhao, B. M. Sanchez, P. J. Dobson and P. S. Grant, Nanoscale, 2011, 3, 839–855 RSC.
- G. Wang, L. Zhang and J. Zhang, Chem. Soc. Rev., 2012, 41, 797–828 RSC.
- Y. Huang, J. Liang and Y. Chen, Small, 2012, 8, 1805–1834 CrossRef CAS PubMed.
- H. Jiang, P. S. Lee and C. Li, Energy Environ. Sci., 2013, 6, 41–53 CAS.
- G. Salitra, A. Soffer, L. Eliad, Y. Cohen and D. Aurbach, J. Electrochem. Soc., 2000, 147, 2486–2493 CrossRef CAS.
- C. Vix-Guterl, E. Frackowiak, K. Jurewicz, M. Friebe, J. Parmentier and F. Béguin, Carbon, 2005, 43, 1293–1302 CrossRef CAS.
- H. Ye, Y. Cheng, T. Hobson and L. Jie, Nano Lett., 2010, 10, 2727–2733 CrossRef PubMed.
- Y. Wang, S. F. Yu, C. Y. Sun, T. J. Zhu and H. Y. Yang, J. Mater. Chem., 2012, 22, 17584–17588 RSC.
- J. Chen, Y. Huang, C. Li, X. Chen and X. Zhang, Appl. Surf. Sci., 2015, 360, 534–539 CrossRef.
- Y. G. Wang, Z. D. Wang and Y. Y. Xia, Electrochim. Acta, 2005, 50, 5641–5646 CrossRef CAS.
- B. Vidyadharan, R. A. Aziz, I. I. Misnon, G. M. A. Kumar, J. Ismail, M. M. Yusoff and R. Jose, J. Power Sources, 2014, 270, 526–535 CrossRef CAS.
- J. Ma, Q. Cheng, V. Pavlinek, P. Saha and C. Li, New J. Chem., 2013, 37, 722–728 RSC.
- W. Wei, X. Cui, W. Chen and D. G. Ivey, Chem. Soc. Rev., 2011, 40, 1697–1721 RSC.
- R. Zhang, T. Zhou, L. Wang, Z. Lou, J. Deng and T. Zhang, New J. Chem., 2016, 40, 6796–6802 RSC.
- M. M. Titirici, A. Markus Antonietti and A. Thomas, Chem. Mater., 2006, 18, 3808–3812 CrossRef CAS.
- M. Agrawal, S. Gupta, A. Pich, N. E. Zafeiropoulos and M. Stamm, Chem. Mater., 2009, 21, 5343–5348 CrossRef CAS.
- L. Zhang and H. Wang, ACS Nano, 2011, 5, 3257–3267 CrossRef CAS PubMed.
- M. Pang and H. C. Zeng, Langmuir, 2010, 26, 5963–5970 CrossRef CAS PubMed.
- J. Gascon, A. Corma, F. Kapteijn and F. X. L. I. Xamena, ACS Catal., 2013, 4, 361–378 CrossRef.
- P. Kaur, J. T. Hupp and S. B. T. Nguyen, ACS Catal., 2011, 42, 819–835 CrossRef.
- J. K. Sun and Q. Xu, Energy Environ. Sci., 2014, 7, 2071–2100 CAS.
- L. Li, X. Wang, J. Liang, Y. B. Huang, H. F. Li, Z. J. Lin and R. Cao, ACS Appl. Mater. Interfaces, 2016, 8, 9777–9781 CAS.
- S. Xiong, Y. He, R. Krishna, B. Chen and Z. Wang, Cryst. Growth Des., 2013, 13, 2670–2674 CAS.
- Z. J. Zhang, Z. Z. Yao, S. C. Xiang and B. L. Chen, Energy Environ. Sci., 2014, 7, 2868–2899 CAS.
- Z. J. Lin, Y. B. Huang, T. F. Liu, X. Y. Li and R. Cao, Inorg. Chem., 2013, 52, 3127–3132 CrossRef CAS PubMed.
- X.D. Xu, R.J. Cao, S. Jeong and J. Cho, Nano Lett., 2012, 12, 4988–4991 CrossRef CAS PubMed.
- R. R. Salunkhe, J. Tang, Y. Kamachi, T. Nakato, J. H. Kim and Y. Yamauchi, ACS Nano, 2015, 9, 6288–6296 CrossRef CAS PubMed.
- L. Zhang, H. B. Wu, S. Madhavi, H. H. Hng and X. W. Lou, J. Am. Chem. Soc., 2012, 134, 17388–17391 CrossRef CAS PubMed.
- L. Zhang, H. B. Wu and X. W. Lou, J. Am. Chem. Soc., 2013, 135, 10664–10672 CrossRef CAS PubMed.
- J. Zhang, Z. Lyu, F. Zhang, L. Wang, P. Xiao, K. Yuan, M. Lai and W. Chen, J. Mater. Chem. A, 2016, 4, 6350–6356 CAS.
- Z. Wang, B. Zhang, T. Otsuka, H. Kobayashi and M. Kurmoo, Dalton Trans., 2004, 15, 2209–2216 RSC.
- Y. Umezawa and C. N. Reilley, Anal. Chem., 1978, 50, 1290–1295 CrossRef CAS.
- Y. Qiao, Q. Sun, H. Cui, D. Wang, F. Yang and X. Wang, RSC Adv., 2015, 5, 31942–31946 RSC.
- F. Davar, M. Salavati-Niasari, N. Mir, K. Saberyan, M. Monemzadeh and E. Ahmadi, Polyhedron, 2010, 29, 1747–1753 CrossRef CAS.
- J. Zhang, Y. Luan, Z. L. Yu, L. Wang, L. Xu, K. Yuan, F. Pan, M. Lai, Z. Liu and W. Chen, Nanoscale, 2015, 7, 14881–14888 RSC.
- L. C. Dong, Y. B. Zhong, S. Zhe, T. Y. Zheng and H. Wang, RSC Adv., 2016, 6, 21037–21042 RSC.
- L. Balan, C. M. Ghimbeu, L. Vidal and C. Vix-Guterl, Green Chem., 2013, 15, 2191–2199 RSC.
- Y. Cao, F. Yuan, M. Yao, J. H. Bang and J. H. Lee, CrystEngComm, 2014, 16, 826–833 RSC.
- M. Fang, X. L. Tan, M. Liu, S. H. Kang, X. Y. Hu and L. D. Zhang, CrystEngComm, 2011, 13, 4915–4920 RSC.
- Z. X. Liu, Y. Xing, S. M. Fang, X. W. Qu, D. P. Wu, A. Q. Zhang and B. Xu, RSC Adv., 2015, 5, 54867–54872 RSC.
- J. W. Lee, A. S. Hall, J. D. Kim and T. E. Mallouk, Chem. Mater., 2012, 24, 1158–1164 CrossRef CAS.
- K. B. Wang, X. B. Shi, A. M. Lu, X. Y. Ma, Z. Y. Zhang, Y. N. Lu and H. J. Wang, Dalton Trans., 2014, 44, 151–157 RSC.
- J. Y. Qu, F. Gao, Q. Zhou, Z. Y. Wang, H. Han, B. B. Li, W. B. Wan, X. Z. Wang and J. S. Qiu, Nanoscale, 2013, 5, 2999–3005 RSC.
Footnote |
| † Electronic supplementary information (ESI) available: The FT-IR results of the precursor and the obtained product by NaOH treatment of precursor, XRD patterns, SEM and TEM images of Mn3O4 prepared at different reaction condition, and the detail electrochemical performances of Mn3O4 hollow microcubes and solid nanospheres. See DOI: 10.1039/c7ra00435d |
| This journal is © The Royal Society of Chemistry 2017 |

