 Open Access Article
Comparatively studying the local atomic structures of metallic glasses upon cyclic-loading by computer simulations†
M. H. Yang ,
J. H. Li* and
B. X. Liu
Key Laboratory of Advanced Materials (MOE), School of Materials Science and Engineering, Tsinghua University, Beijing 100084, China. E-mail: lijiahao@mail.tsinghua.edu.cn
First published on 27th March 2017
Abstract
Based on a newly constructed Ni–Zr potential, Molecular dynamics and Monte Carlo simulations predict the amorphization driving force for each alloy and pinpoint the optimized value of 40 at% Zr. Through a variety of local structural analysis methods, it is revealed that NixZr100−x MGs exhibit a combination of icosahedral-, fcc- and hcp-like configurations, while the icosahedra or distorted icosahedra cover a dominant fraction. Interestingly, the lower-CN clusters, such as 〈0,2,8,1〉, may play a significant role in atomic mobility, while the icosahedron is less sensitive to the faster mobility.
1 Introduction
Understanding the relationship between local atomic structures and mechanical behaviors in metallic glasses (MGs) is of vital importance for current applications and emerging technologies.1–6 There is increasing evidence to suggest that the deformation behavior of MGs is driven by the cooperative organization of irreversible rearrangements of small dynamical clusters, which are triggered by the nonlocal redistribution of elastic stress.7–9 The sequence of such plastic events can contribute to an avalanche process characterized by a power-law scaling of the average stress or energy drop with system size.10,11 In addition, the local atomic-level structure of MGs varies from site to site due to their intrinsic structure. The spatial connectivity and various kinds of local structural motifs in MGs significantly influence the mechanical response of the macroscopic sample under loading. In this case, the structural heterogeneity necessarily contributes to the mechanical heterogeneity, and this structural–mechanical heterogeneity still remains a mystery and needs further insightful research.In practical applications, service conditions that introduce cyclic variations in stresses are inevitably involved, and the resistance of MGs to the onset and progression of localized deformation under cyclic loading has attracted considerable scientific and technological interests.12,13 Due to the small length scales and short time scales, the atomic-scale processes underlying shear localization under cyclic deformation are difficult to study experimentally. Meanwhile, atomistic simulations, particularly Molecular dynamics (MD), are playing a significant role in elucidating the structure of MGs and monitoring the evolution of the atomic structure during mechanical deformation. It is well accepted that icosahedra or distorted icosahedra are important local structural motifs for the dynamical slowdown in metallic supercooled liquids, stability of supercooled liquids against crystallization, and formation of metallic glasses.14 For example, the enhanced full icosahedral ordering with increasing Cu content in Cu–Zr models matches hand in hand with the appropriate composition ratios and bond types, and these chemical, topological and kinetic structural effects lead to the higher resistance to shear transformations and hence also reduce the propensity for plasticity.15 Although Ni and Cu are neighbors in the periodic table and have many similarities, there is so far little or no atomic-level understanding of the structural–mechanical properties in Ni–Zr MGs under cyclic deformation.
In the present work, Molecular dynamics (MD) and Monte Carlo (MC) simulations are applied to study the local atomic structure characteristics, and their effect on the mechanical properties of the Ni–Zr MGs was further explored. The paper is organized as follows: based on the newly proposed potential, the local atomic structure of Ni–Zr binary alloys was quantitatively determined in terms of the pair-correlation functions, static structure factor S(q),16 Honeycutt–Andersen pair analysis,17 coordination number, Voronoi tessellation method18 and cluster alignment method.19 In addition, the recently proposed molecular dynamics simulation of dynamic mechanical spectroscopy (MD-DMS) was used to analyze the internal friction (IF) characteristics, which are responsible for the transport and damping properties of amorphous materials. We attempt to provide an explicit picture of the local atomic structures in Ni–Zr MGs and to further clarify the structure–property relationship.
2 Method and model
2.1 Molecular dynamics (MD) and Monte Carlo (MC) simulations
In practice, the process of producing metallic glass always occurs under non-equilibrium conditions, and the related kinetic conditions are extremely restricted. As a result, the phase competing against the amorphous phase is the solid solution with one of the three simple structures, i.e. fcc, hcp, or bcc. Recent studies have revealed that there exists no pronounced differences in the local atomic structure and mechanical behaviour between solid-state amorphization and liquid melt quenching (LMQ) production methods.20 Applying the newly constructed long-range empirical Ni–Zr potential,21 a sequence of MD simulations was implemented using Large-scale Atomic/Molecular Massively Parallel Simulator (LAMMPS) packages to study the relative stabilities of Ni–Zr solid solutions versus their amorphous counterparts.Ni50Zr50 and Ni65Zr35 belong to a fcc solid solution model with dimensions of ∼60.0 × 60.0 × 60.0 Å3, while Ni35Zr65 belongs to a hcp solid solution model with dimensions of ∼45.3 × 78.4 × 73.9 Å3. Both the fcc and hcp solid solution models consist of 15 × 15 × 15 × 4 = 13![[thin space (1/6-em)]](https://www.rsc.org/images/entities/char_2009.gif) 500 atoms. Periodic boundary conditions were adopted in three Cartesian directions. With a time step of 5 femtoseconds, MD simulation was performed in the framework of an isothermal–isobaric ensemble, and conducted at 300 K and 0 Pa for 1 million time steps to be fully relaxed. As shown in the ESI,† the glass transition temperature Tg of the Ni35Zr65, Ni50Zr50 and Ni65Zr35 alloys are about 1000 K, 1100 K and 1200 K, respectively. Meanwhile, a series of Monte Carlo (MC) simulations were implemented to calculate the formation energy of the solid solutions. MC simulations were performed at 300 K and 0 Pa in the isothermal–isobaric ensemble.22
500 atoms. Periodic boundary conditions were adopted in three Cartesian directions. With a time step of 5 femtoseconds, MD simulation was performed in the framework of an isothermal–isobaric ensemble, and conducted at 300 K and 0 Pa for 1 million time steps to be fully relaxed. As shown in the ESI,† the glass transition temperature Tg of the Ni35Zr65, Ni50Zr50 and Ni65Zr35 alloys are about 1000 K, 1100 K and 1200 K, respectively. Meanwhile, a series of Monte Carlo (MC) simulations were implemented to calculate the formation energy of the solid solutions. MC simulations were performed at 300 K and 0 Pa in the isothermal–isobaric ensemble.22
2.2 Simulation of dynamic mechanical spectroscopy
To simulate the real case of dynamic mechanical spectroscopy experiments, a time-period sinusoidal strain ε(t) = εA![[thin space (1/6-em)]](https://www.rsc.org/images/entities/char_2009.gif) sin(2πfωt) was applied in the x direction of the obtained MGs, where fω is the frequency of the oscillation period and is selected as 1, 10 and 100 GHz in the present work. We fixed the strain rate amplitude εA as 2.0% in the linear elastic deformation stage. For every MD-DMS, 20 full period cycles were used and thus t was in the range of 0, 20/fω. The resultant stress was fitted as σ(t) = σ0 + σA
sin(2πfωt) was applied in the x direction of the obtained MGs, where fω is the frequency of the oscillation period and is selected as 1, 10 and 100 GHz in the present work. We fixed the strain rate amplitude εA as 2.0% in the linear elastic deformation stage. For every MD-DMS, 20 full period cycles were used and thus t was in the range of 0, 20/fω. The resultant stress was fitted as σ(t) = σ0 + σA![[thin space (1/6-em)]](https://www.rsc.org/images/entities/char_2009.gif) sin(2πfωt + δ), where σ0 is a constant term and usually small, and δ is the phase difference between stress and strain. The storage (E′) and loss (E′′) modulus are calculated and expressed by
sin(2πfωt + δ), where σ0 is a constant term and usually small, and δ is the phase difference between stress and strain. The storage (E′) and loss (E′′) modulus are calculated and expressed by
E′ = σA/εA![[thin space (1/6-em)]](https://www.rsc.org/images/entities/char_2009.gif) cos(δ), cos(δ),
| (1) |
E′′ = σA/εA![[thin space (1/6-em)]](https://www.rsc.org/images/entities/char_2009.gif) sin(δ). sin(δ).
| (2) |
At a given temperature, the MD-DMS was performed under a constant number, volume and temperature (NVT) ensemble during the cyclic deformations.23,24
2.3 Cluster alignment method
A recently developed order-mining scheme, i.e. an atomic cluster alignment method, has been adopted to identify and characterize not only the short-range but also medium-range structural order in metallic liquids and glasses.25–27 In this method, one cluster is fixed as a template and aligned with other clusters by rigid translation and rotation to minimize the overall mean square distances between the atoms in different clusters. In the present work, a cluster around the Ni atoms is extracted from the snapshot and aligned against an ideal bcc, fcc, hcp and ICO template. In order to describe the structural similarity between the template and the aligned cluster, an alignment score is defined as19
 | (3) |
![[r with combining right harpoon above (vector)]](https://www.rsc.org/images/entities/i_char_0072_20d1.gif) ic and
ic and ![[r with combining right harpoon above (vector)]](https://www.rsc.org/images/entities/i_char_0072_20d1.gif) it are the atom positions in the aligned cluster and template, respectively and α is a coefficient to allow an appropriate scaling for the bond length in the templates. A smaller score indicates a higher similarity between the two independent cluster motifs. In order to achieve the global optimum alignment configuration, we adopted 2000 alignment runs with different random initial cluster rotations and obtained the minimum fitting score to measure the structural similarity.
it are the atom positions in the aligned cluster and template, respectively and α is a coefficient to allow an appropriate scaling for the bond length in the templates. A smaller score indicates a higher similarity between the two independent cluster motifs. In order to achieve the global optimum alignment configuration, we adopted 2000 alignment runs with different random initial cluster rotations and obtained the minimum fitting score to measure the structural similarity.
3 Results and discussion
3.1 Metallic glass formation of Ni–Zr alloys
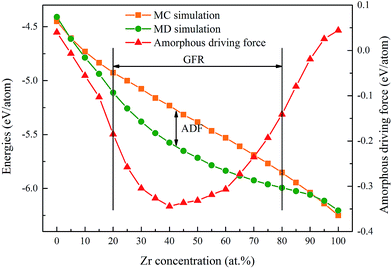
The concept of glass-forming ability (GFA) is frequently related to the ease or difficulty of the ability to form glass, and this term can be understood in two distinct ways. Firstly, the glass-forming ability can be considered as the frustration of crystallization during freezing of the liquid melt for a specific alloy. In practice, a few simple criteria have been proposed, such as the critical dosage Dc,29 the supercooled liquid region ΔTxg (=Tx − Tg)30 and the new parameter γ = Tx/(Tg + Tm),31 to describe the GFA of an alloy. Secondly, the glass-forming ability can be depicted as a competition between the crystalline and amorphous phases as an alloy composition function for a specific alloy system. In this case, the glass-forming range (GFR) is employed to indicate the composition range within which the amorphous phase is energetically favored to form.32 Therefore, the GFA of an alloy system is quantitatively related to its GFR, i.e. the wider the GFR, the greater the GFA of an alloy system.According to the simulation results of a Ni–Zr–Mo system,33 the GFA/GFR of the Ni–Zr system is determined to be within 20–80 at% Zr as shown in Fig. 1, matching well with the mechanical alloying experimental results of 17–76 at% Zr.34 In addition, we define the Eam as the energy per atom of the NixZr100−x amorphous phase, and ENi and EZr are the lattice energies of the Ni and Zr atoms in the ground state,35 respectively. The formation energy ΔEam for the amorphous phase can be calculated in the MD simulations and is expressed by
| ΔEam = Eam − [xENi + (1 − x)EZr]. | (4) |
In addition, a MC simulation was performed to compute the formation energy of the solid solutions, i.e. ΔEs.s. The Es.s is defined as the energy per atom of the NixZr100−x solid solutions, and the formation energy ΔEs.s of the NixZr100−x solid solutions can be calculated by
| ΔEs.s = Es.s − [xENi + (1 − x)EZr]. | (5) |
As a result, the formation energy difference between the amorphous phase and the solid solution can be expressed by
| ΔEam–s.s = Eam − Es.s, | (6) |
3.2 Partial pair correlations and structure factor
At first, the structural changes in the obtained Ni–Zr MGs are monitored using the pair-correlation function (PCF) g(r), which can provide valuable information of liquid and amorphous alloys. The total pair correlation function, g(r), could be obtained using the following formula:
 | (7) |
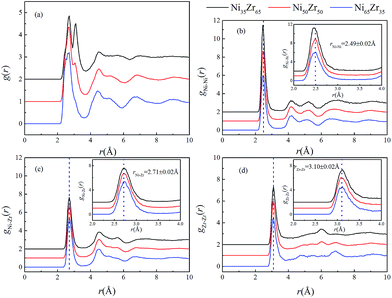
Using the atomic coordinates from the MD simulations at 300 K, the total and partial PCFs of the NixZr100−x (x = 35, 50 and 65) MGs are displayed in Fig. 2, indicating the amorphous nature of the three alloys. The average interatomic distance rij can be determined from the position of the first peak on the gij(r) function. It can be seen that the gNi–Ni(r) curves of the three alloys overlap around the highest peak with r = 2.49 ± 0.02 Å, while the first peaks of the gNi–Zr(r) and gZr–Zr(r) curves shift to a larger distance of r = 2.71 ± 0.02 Å and 3.10 ± 0.02 Å, respectively. It follows that the PCF peaks shift to a larger interatomic distance with the enrichment of Zr, considering the fact that Zr (rZr = 1.60 Å) has a much larger atomic radius than Ni (rNi = 1.24 Å).35 Similar observations have also been obtained in Zr2Ni metallic glass at 300 K via X-ray diffraction (XRD) experiments and ab initio MD simulations.36
In addition, the static structure factor S(q) is a quantity that can be directly measured by scattering experiments such as XRD and neutron diffraction (ND). The S(q) can be recognized as firm evidence to identify the amorphous phase and is calculated by16
 | (8) |
 , bk is the scattering length, and q and rk are the scattering vector and the position vector of atom k, respectively. It should be noted that the S(q) calculated by eqn (8) is not normalized.
As shown in Fig. 3, all of the peaks beyond the second peak for the S(q) curves of the NixZr100−x MGs have smeared out, exhibiting a typical short-range ordered and long-range disordered feature. The prepeak for the S(q) curves in the reciprocal space marked by the arrow should correspond to a certain medium-range correlation in real space.37 For comparison, the S(q) curve of the Ni64Zr36 MGs obtained from the experimental XRD and ND for the natNi-containing samples are also shown in Fig. 3.28 Although some compositional differences exist, the simulated S(q) in the present study exhibits an acceptable match with the experimental ones regarding the height of the peaks and the overall shape of the curve, confirming the reliability of the atomistic structures generated from the solid-state amorphization.
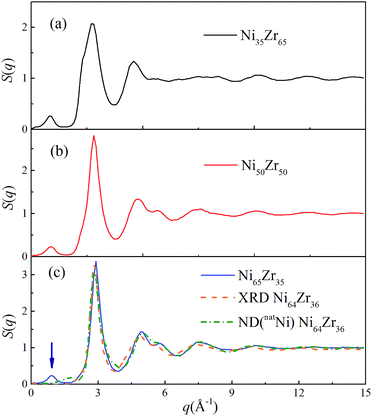 | ||
| Fig. 3 Total structural factors S(q) for the Ni35Zr65, Ni50Zr50 and Ni65Zr35 metallic glasses at 300 K. The orange and olive dotted lines represent the S(q) for the Ni64Zr36 metallic glasses obtained from the experimental XRD and ND on the natNi-containing samples,28 respectively. | ||
3.3 Local atomic structure analysis
In the present work, 3D atomic models were used to analyze the local atomic configuration. Here we used the Honeycutt–Andersen pair analysis, cluster alignment method, coordination number and Voronoi tessellation method to analyze the local structural order in the simulated Ni–Zr MG model.To provide a microscopic picture of the structural origin for the NixZr100−x MGs, Honeycutt–Andersen pair analysis was first applied to characterize the topological short-range order (SRO). With the Ni concentration increasing, one can see from Table 1 that the fraction of the bond pairs with 1441 and 142 indices decreases, whereas the fraction of the bond pairs with 1551, 1541, 1431 and 1661 indices increases. Meanwhile, a large number of the icosahedral ordering 1551 index are found in the NixZr100−x MGs, suggesting that the local fivefold symmetry is indeed encouraged in metallic glasses. Besides, the distorted fivefold bond pairs with 1431 and 1541 indices are dominant in these metallic glasses, covering a fraction of 32–38%. Moreover, the fcc- and hcp-like pairs with 1421 and 1422 indices cover a relatively larger fraction due to the original crystal structure, while only a small fraction of the bcc-like pairs with 1661 and 1441 indices are discovered in the NixZr100−x MGs. It has been reported that the fcc or hcp arrangements are shown to minimize the system energy, because of the smaller binding energies than that of the icosahedral order.38 Therefore, it is revealed that the local structures in the NixZr100−x MGs exhibit a combination of icosahedral-, fcc- and hcp-like configurations.
| ico1551 | dico1431 | dico1541 | bcc1661 | bcc1441 | fcc/hcp142 | |
|---|---|---|---|---|---|---|
| Ni35Zr65 | 16.770 | 20.470 | 11.828 | 0.800 | 1.455 | 18.067 |
| Ni50Zr50 | 25.803 | 21.415 | 12.462 | 1.487 | 1.288 | 12.222 |
| Ni65Zr35 | 31.917 | 22.475 | 15.341 | 1.847 | 1.242 | 10.890 |
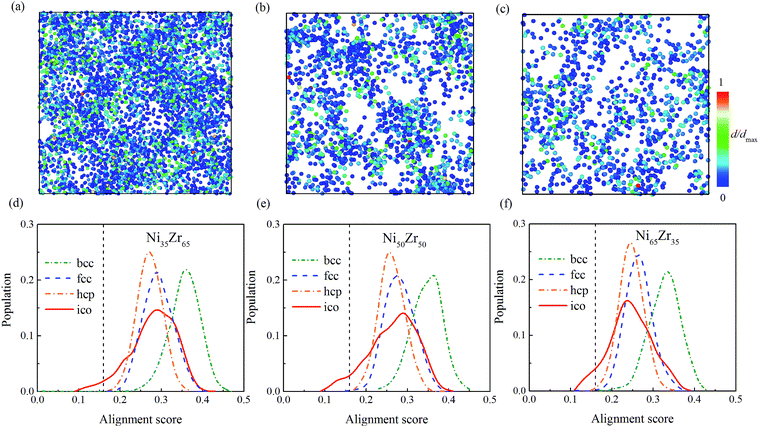
To give more information, the local structure was quantitatively analyzed using a cluster alignment method. The distribution of the alignment score for the NixZr100−x (x = 35, 50 and 65) MGs is plotted in Fig. 4. The smaller the alignment score, the less deviation the aligned cluster has compared with the template. In this case, all of the MG samples exhibit better icosahedral order when compared with the bcc-, fcc- and hcp-like configurations, as the distribution function gradually shifts towards the lower values of the alignment score.
 | ||
| Fig. 4 The distribution of the alignment score for the Ni-centered clusters extracted from the (a) Ni35Zr65, (b) Ni50Zr50 and (c) Ni65Zr35 metallic glasses. | ||
In addition to the cluster alignment method and Honeycutt–Andersen pair analysis, the coordination number and Voronoi tessellation method are also widely used to provide a more complete geometrical construction of the central atom in relation to the neighboring atoms. Specifically, an envelope of a family of perpendicular bisectors between the central atom and all of the neighboring atoms constitutes the surface of a Voronoi polyhedron for the central atom, indexed by 〈n3, n4, n5, n6,…〉, where ni denotes the number of i-edged faces of the Voronoi polyhedron and Σni is the total CN.
We present the overall CN distributions for the NixZr100−x (x = 35, 50 and 65) MGs in Fig. 5(a). It can be seen that the dominant clusters for these MGs are centered around CN = 12. As the Ni content increases, the total CN distributions in the MGs have undergone a noticeable decrease in the fraction of low-CN clusters, whereas an inverse trend is observed for high-CN clusters. This is mainly attributed to the fact that an increasing percentage of smaller Ni atoms are supposed to serve as solutes, which therefore favors higher CNs. To further investigate the local packing around each individual type of atom, the evolution of the CN distributions around the Ni and Zr atoms was analyzed and is shown in Fig. 5(b) and (c). It is revealed that the CNs of the Ni-centered clusters are centered around CN = 11 and 12, while the CNs of the Zr-centered clusters are centered around high-CN clusters. For the Ni65Zr35 MGs, the Ni atoms with dominant concentration are more likely to serve as solvents and also act as ‘glue’ for the glassy structure.39 Therefore, it is plausible to expect that the Zr atoms could more readily adopt a favored local packing at their preference, while the Ni atoms would experience more flexible local environments.
 | ||
| Fig. 5 The distribution of the major coordination numbers (CNs) for the (a) total, (b) Ni-centered, and (c) Zr-centered clusters of the Ni35Zr65, Ni50Zr50 and Ni65Zr35 metallic glasses. | ||
The populations of the dominant Voronoi polyhedra around the constituent elements for the NixZr100−x (x = 35, 50 and 65) MGs were then calculated and are illustrated in Fig. 6(a), (b) and (c), respectively. One can see that the dominant polyhedra in the NixZr100−x (x = 35, 50 and 65) MGs are 〈0, 0, 12, 0〉, 〈0, 2, 8, 1〉, 〈0, 2, 8, 2〉 and 〈0, 1, 10, 2〉. It is well-known that the icosahedron 〈0, 0, 12, 0〉 has been widely considered as being responsible for reducing the total energy and stabilizing the glassy state.36 In addition, the distorted icosahedra 〈0, 2, 8, 1〉, 〈0, 2, 8, 2〉 and 〈0, 1, 10, 2〉 are also populated around Ni and Zr due to the fact that these clusters have 11–13 neighboring atoms and a high percentage of fivefold-coordinated vertices, thus making them similar to icosahedra. The above analysis results match well with the cluster alignment method and Honeycutt–Andersen pair analysis, indicating that the icosahedra or distorted icosahedra have a rather high fraction in the NixZr100−x (x = 35, 50 and 65) MGs.
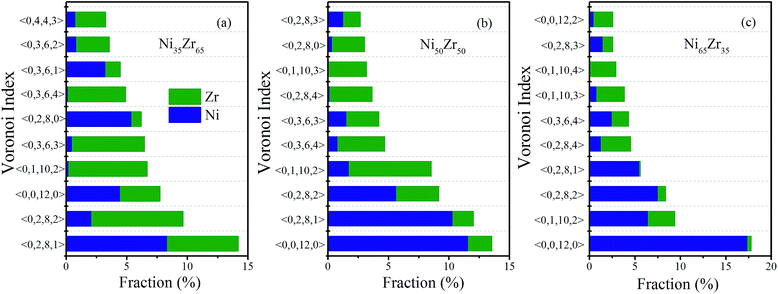 | ||
| Fig. 6 Fraction of the dominant Voronoi clusters centered on Ni and Zr atoms for the (a) Ni35Zr65, (b) Ni50Zr50 and (c) Ni65Zr35 metallic glasses. | ||
3.4 Internal friction structure features
According to the cooperative shear model (CSM),40,41 the atoms that jump more than half of the distance to the average nearest neighbor govern the internal friction in the model MGs, and are defined as activating atoms in the present work. As shown in Fig. 7, the lower-CN clusters, such as 〈0,2,8,1〉, occupy more of the population in the activating atoms and may play a significant role in the atomic mobility. In order to further illustrate the relationship between the activating atoms and the local atomic structure, the perspective view and corresponding cluster alignment score of the activating atoms in the NixZr100−x (x = 35, 50 and 65) MGs at 900 K and fω = 1 GHz after 20 cycle deformations are presented in Fig. 8. It is found that the lower the Ni concentration, the higher the concentration of the activating atoms, and vice versa. This may be understood in the view of the coordination distribution. It can be seen from Fig. 5 that the Ni65Zr35 MGs prefer the lower-CN clusters, which are prone to move faster with a smaller size and number of atoms. Compared with the bcc, fcc and hcp configurations, the activating atoms prefer the icosahedra order due to the lower value of the cluster alignment score as shown in Fig. 8(d)–(f). A cutoff alignment score of 0.15–0.16, where the population is close to the first peak of the icosahedral order distribution for each alloy in Fig. 4, was applied to collect icosahedral clusters for all the samples. Furthermore, the population of the icosahedral clusters for all atoms and activating atoms collected from NixZr100−x (x = 35, 50 and 65) MGs are displayed in Fig. 9. By comparing the fraction of icosahedral clusters for all atoms and the activating atoms, there exists a large difference in the fraction for both groups, indicating that the icosahedron is less sensitive to the faster mobility. However, whether there exists the determined local atomic structure influencing the atomic mobility still needs further insightful discussion. | ||
| Fig. 7 Fraction of the dominant Voronoi clusters centered on the Ni and Zr atoms for the (a) Ni35Zr65, (b) Ni50Zr50 and (c) Ni65Zr35 metallic glasses. | ||
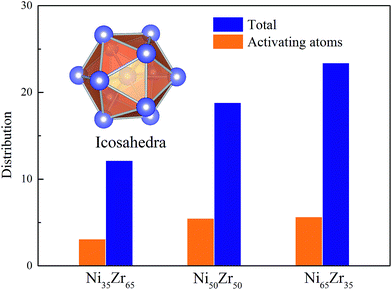 | ||
| Fig. 9 The fraction of icosahedral clusters for all atoms and for the activating atoms in the NixZr100−x (x = 35, 50 and 65) MGs. A cutoff alignment score of 0.16 was used to collect the icosahedra. | ||
4 Conclusions
Taking a long-range empirical Ni–Zr n-body potential as the starting base, Molecular Dynamics and Monte Carlo simulations not only pinpoint the glass forming range of the Ni–Zr system as 20–80 at% Zr, but also predict the amorphization driving force with the peak value of 40 at% Zr. The pair-correlation function g(r) and static structure factor S(q) curves of the NixZr100−x (x = 35, 50 and 65) alloys present a typical short-range ordered and long-range disordered feature. Furthermore, the obtained atomic structures have been characterized by the pair-correlation functions, static structure factor, Honeycutt–Andersen pair analysis, coordination number, Voronoi tessellation method and cluster alignment method. It is revealed that the NixZr100−x (x = 35, 50 and 65) MGs exhibit a combination of the icosahedral-, fcc- and hcp-like configurations, while the icosahedra or distorted icosahedra cover a dominant fraction. Interestingly, the lower-CN clusters, such as 〈0,2,8,1〉, occupy more of the population in the activating atoms and may play a significant role in the atomic mobility. By comparing the fraction of icosahedral clusters for all atoms and for the activating atoms, there exists a large difference in the fraction for both groups, indicating that the icosahedron is less sensitive to the faster mobility.Acknowledgements
The authors are grateful for the financial support from the National Natural Science Foundation of China (51571129, 51631005), the Administration of Tsinghua University, and Tsinghua Fudaoyuan Research Fund.References
- M. D. Ediger and P. Harrowell, J. Chem. Phys., 2012, 137, 080901 CrossRef CAS PubMed.
- S. Adibi, P. S. Branicio and R. Ballarini, RSC Adv., 2016, 6, 13548–13553 RSC.
- J. C. Zhang, C. Chen, Q. X. Pei, Q. Wan, W. X. Zhanga and Z. D. Sha, RSC Adv., 2016, 6, 100899–100907 RSC.
- H.-L. Chen, C.-H. Su, S.-P. Ju, S.-H. Liu and H.-T. Chen, RSC Adv., 2015, 5, 103925–103935 RSC.
- J. Varghese, T. Siponkoski, M. Teirikangas, M. T. Sebastian, A. Uusimäki and H. Jantunen, ACS Sustainable Chem. Eng., 2016, 4, 3897–3904 CrossRef CAS.
- J. Varghese, S. Gopinath and M. T. Sebastian, Mater. Chem. Phys., 2013, 137, 811–815 CrossRef CAS.
- N. V. Priezjev, Phys. Rev. E: Stat., Nonlinear, Soft Matter Phys., 2013, 87, 052302 CrossRef PubMed.
- K. Martens, L. Bocquet and J.-L. Barrat, Phys. Rev. Lett., 2011, 106, 156001 CrossRef PubMed.
- A. Lemaître and C. Caroli, Phys. Rev. Lett., 2009, 103, 065501 CrossRef PubMed.
- N. P. Bailey, J. Schiøtz, A. Lemaître and K. W. Jacobsen, Phys. Rev. Lett., 2007, 98, 095501 CrossRef PubMed.
- E. Lerner and I. Procaccia, Phys. Rev. E: Stat., Nonlinear, Soft Matter Phys., 2009, 79, 066109 CrossRef PubMed.
- C. C. Wang, Y. W. Mao, Z. W. Shan, M. Dao, J. Li, J. Sun, E. Ma and S. Suresh, Proc. Natl. Acad. Sci. U. S. A., 2013, 110, 19725–19730 CrossRef CAS PubMed.
- G. Sainath, P. Rohith and B. K. Choudhary, Trans. Indian Inst. Met., 2016, 69, 489–493 CrossRef.
- Z. W. Wu, M. Z. Li, W. H. Wang and K. X. Liu, Phys. Rev. B: Condens. Matter Mater. Phys., 2013, 88, 054202 CrossRef.
- Y. Q. Cheng, H. W. Sheng and E. Ma, Phys. Rev. B: Condens. Matter Mater. Phys., 2008, 78, 014207 CrossRef.
- C. Suryanarayana and M. G. Norton, X-ray diffraction: a practical approach, Plenum Press, New York, 1998 Search PubMed.
- J. D. Honeycutt and H. C. Andersen, J. Phys. Chem., 1987, 91(19), 4950–4963 CrossRef CAS.
- J. L. Finney, Proc. R. Soc. London, Ser. A, 1970, 319, 479–493 CrossRef CAS.
- Y. Sun, F. Zhang, Z. Ye, Y. Zhang, X. W. Fang, Z. J. Ding, C. Z. Wang, M. I. Mendelev, R. T. Ott, M. J. Kramer and K. M. Ho, Sci. Rep., 2016, 6, 23734 CrossRef CAS PubMed.
- M. H. Yang, J. H. Li and B. X. Liu, Sci. Rep., 2016, 6, 29722 CrossRef CAS PubMed.
- Y. Dai, J. H. Li and B. Liu, J. Appl. Phys., 2011, 109, 053505 CrossRef.
- J. H. Li, S. Z. Zhao, Y. Dai, Y. Y. Cui and B. X. Liu, J. Appl. Phys., 2011, 109, 113538 CrossRef.
- H. B. Yu, K. Samwer, W. H. Wang and H. Y. Bai, Nat. Commun., 2013, 4, 2204 Search PubMed.
- H. B. Yu, R. Richert, R. Maaß and K. Samwer, Phys. Rev. Lett., 2015, 115, 135701 CrossRef CAS PubMed.
- X. W. Fang, C. Z. Wang, Y. X. Yao, Z. J. Ding and K. M. Ho, Phys. Rev. B: Condens. Matter Mater. Phys., 2010, 82, 184204 CrossRef.
- X. W. Fang, L. Huang, C. Z. Wang, K. M. Ho and Z. J. Ding, J. Appl. Phys., 2014, 115, 053522 CrossRef.
- Y. Sun, Y. Zhang, F. Zhang, Z. Ye, Z. J. Ding, C. Z. Wang and K. M. Ho, J. Appl. Phys., 2016, 120, 015901 CrossRef.
- I. Kabana, P. Jóváric, V. Kokotind, O. Shuleshovaa, B. Beuneue, K. Sakslf, N. Matterna, J. Eckerta and A. Greerg, Acta Mater., 2013, 61, 2509–2520 CrossRef.
- M. H. Yang, J. H. Li and B. X. Liu, RSC Adv., 2015, 5, 16400 RSC.
- A. Inoue, T. Zhang and T. Masumoto, Mater. Trans., JIM, 1990, 31, 177–183 CrossRef CAS.
- Z. P. Lu and C. T. Liu, Acta Mater., 2002, 50, 3501–3512 CrossRef CAS.
- H. Li, X. D. Dai, S. H. Liang, K. P. Tai, Y. Kong and B. X. Liu, Phys. Rep., 2008, 455, 1–134 CrossRef.
- M. H. Yang, S. N. Li, Y. Li, J. H. Li and B. X. Liu, Phys. Chem. Chem. Phys., 2015, 17, 13355–13365 RSC.
- A. W. Weeber and H. Bakker, J. Phys. F: Met. Phys., 1988, 18, 1359 CrossRef CAS.
- C. Kittel, Introduction to solid state physics, Wiley, New York, 7th edn, 1996 Search PubMed.
- L. Huang, C. Z. Wang, S. G. Hao, M. J. Kramer and K. M. Ho, Phys. Rev. B: Condens. Matter Mater. Phys., 2010, 81, 094118 CrossRef.
- Y. Q. Cheng and E. Ma, Prog. Mater. Sci., 2011, 56, 379–473 CrossRef CAS.
- F. C. Frank, Proc. R. Soc. London, Ser. A, 1952, 215, 43–46 CrossRef CAS.
- H. W. Sheng, W. K. Luo, F. M. Alamgir, J. M. Bai and E. Ma, Nature, 2006, 439, 419–425 CrossRef CAS PubMed.
- W. L. Johnson and K. Samwer, Phys. Rev. Lett., 2005, 95, 195501 CrossRef CAS PubMed.
- H. B. Yu and K. Samwer, Phys. Rev. B: Condens. Matter Mater. Phys., 2014, 90, 144201 CrossRef.
Footnote |
| † Electronic supplementary information (ESI) available. See DOI: 10.1039/c7ra00570a |
| This journal is © The Royal Society of Chemistry 2017 |

