 Open Access Article
Templated fabrication of pH-responsive poly(L-glutamic acid) based nanogels via surface-grafting and macromolecular crosslinking
Shifeng Yan*a,
Yuanyuan Suna,
An Chena,
Lei Liub,
Kunxi Zhanga,
Guifei Lia,
Yourong Duan *b and
Jingbo Yin
 *a
*a
aDepartment of Polymer Materials, Shanghai University, 333 Nanchen Road, Shanghai 200444, People's Republic of China. E-mail: yansf@staff.shu.edu.cn; jbyin@oa.shu.edu.cn
bShanghai Cancer Institute, Renji Hospital, School of Medicine, Shanghai Jiao Tong University, Shanghai 200032, People's Republic of China. E-mail: yrduan@shsci.org
First published on 7th March 2017
Abstract
A novel class of pH-responsive hollow poly(L-glutamic acid)/chitosan (PLGA/CS) nanogels was fabricated by a templating approach, which was mild and surfactant free, and combined with a “grafting from” method and intermacromolecular crosslinking technique. The surface grafting, crosslinking reaction, nanogel fabrication and microstructure were investigated by FTIR, 1H NMR, XRD, TGA, light scattering, and electron microscopy. The size of the resultant PLGA/CS nanogels could be accurately controlled by simply changing the size of the silica template. The nanogels responded to changes in environmental pH, elucidated according to the variation of the size of the nanogels and zeta potential at different pH values. Taking water-soluble antineoplastic agent mitoxantrone (MTX) as a model drug, the nanogels presented high loading ability at high-pH environment and rapid MTX release behavior under acidic conditions. MTT assays used to study the in vitro cytotoxicity of PLGA/CS nanogels showed a negligible cytotoxicity in mouse fibroblast L929 cells. Compared with bare MTX, MTX loaded PLGA/CS nanogels exhibited an enhanced inhibition effect to human gastric carcinoma SGC7901 cells. Fluorescence microscopy and flow cytometry analysis results demonstrated efficient cellular uptake of the PLGA/CS nanogels into the cells. These studies suggest that such pH-responsive PLGA/CS hollow nanogels might have great potential in controlled drug delivery systems.
1. Introduction
Nanogels are nanometer sized hydrogel nanoparticles formed by physically or chemically cross-linked polymer networks. Nanogels are currently attracting significant attention and becoming a research target of great significance for their potential use in advanced technologies such as drug delivery systems and bioimaging.1,2 As smart nanocarriers, they can trigger the release of bioactive agents, such as drugs, genes, and proteins, in response to specific cellular signals.Various methods have been adopted to obtain nanogels. The commonly used emulsion polymerization shows the drawbacks of the use of organic solvents/surfactants, and the need of energy (e.g., sonication) to form the emulsion, which may inactivate the entrapped therapeutic molecules. Also, the obtained nanogels are often strongly polydisperse in size.3,4 For biomedical applications, the formation of nanogels with controllable size and polydispersity, while avoiding the use of solvents/surfactants is highly desirable and presents a challenge.5
Recently, the nano template methods have been developed and attracted great attention because they avoid the use of organic solvents/surfactants, and regulate the particle size using well-defined templates.6 Hollow nanogels can be prepared using nanoparticles (e.g., monodispersive gold5 or silica6 nanoparticles) as a sacrificial template, which are of particular interest because they also possess the ability to function as nanocapsules. Meanwhile, to prevent dissolution of the nanogel in the aqueous environment, chemical crosslinks involving the formation of covalent bonds are preferred to physical crosslinks.7
However, the major challenge of using nano template methods for nanogel preparation is colloidal stability. The versatile precipitation method proposed by Mohwald et al.8 for the synthesis of hollow capsules was based on polymer precipitation onto the templates, which easily led to particle aggregation under poor solvent conditions for polymer shells.6
Moreover, the polymer materials employed for the encapsulation of the sacrificial nanosized template mainly focussed on non-degradable synthetic hydrophilic polymers, such as most commonly studied thermoresponsive poly(N-isopropylacrylamide),5 pH-responsive polymethacrylic acid/polymethyl acrylate.9 These non-degradable polymers, however, is typically regarded as not appropriate for many applications in drug delivery. Moreover, in the process of crosslinking of grafted or absorbed polymer chains on the surface of nanosized template, some cytotoxic reagents, such as crosslinking agent, initiator, and monomer are often used, which are the major obstacles in the use of drug carriers.
Thus, there still exists a need to develop a nano template method for yielding biodegradable and biocompatible hollow nanogels with good control over the properties and dimensions in the nanometer range.
Poly(L-glutamic acid) (PLGA) is a synthetic polypeptide that can biodegrade into naturally occurring glutamic acid. The pendent-free carboxyl groups in each repeating unit make it responsive to external stimuli (such as pH and electrolytes), and provide functionality for drug attachment. These features make PLGA a promising candidate for application in the drug delivery. The pH-responsive PLGA based nanogels are of special interest in the delivery of anti-cancer drugs due to the acidic extracellular pH environment of solid tumors and the numerous pH gradients that exist in the body.10,11 However, few reports showed that PLGA served as a nanogel in drug delivery systems.
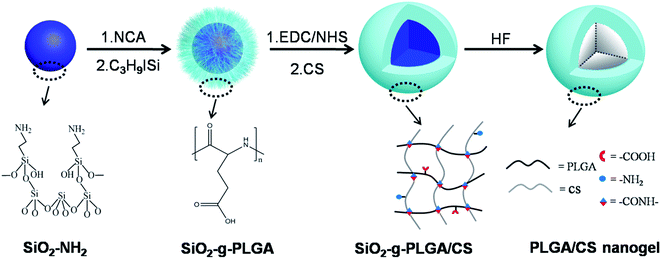
In this report, we described a strategy for synthesizing hollow PLGA based nanogels using SiO2 as the sacrificed template. We have combined the templating approach with a “grafting from” method and intermacromolecules crosslinking technique. The synthetic route toward the formation of hollow PLGA based nanogels involved the surface-initiated ring-opening polymerization (ROP) of γ-benzyl-L-glutamate N-carboxyanhydride (BLG-NCA) and grafting of PLGA onto SiO2 nanoparticles, then crosslinking of PLGA using chitosan (CS) as macromolecular crosslinking agent, followed by dissolution of the SiO2 core as depicted in Scheme 1.
This work provided a complementary methodology for the synthesis of hollow polypeptide based nanogels. Advantages of the method include: (1) “grafting from” method enabling high grafting density of polypeptides and well-dispersion of SiO2 templates, (2) preparation of hollow nanogels based on only water-soluble biodegradable materials (synthetic polypeptides and nature polymers) without using organic solvents and surfactants, (3) fabrication of hollow nanogels from stable covalently cross-linked networks using macromolecular crosslinking agent without introduction of toxic small molecule crosslinking agent, initiator, and monomer, (4) easy control over the nanogel dimensions and wall thickness, (5) expected pH-dependent behavior of nanogels considering the component polymers were both weak polyelectrolytes.
The surface grafting of PLGA onto template nanoparticles, and fabrication of PLGA/CS nanogels were described. Various physicochemical characteristics including micromorphology, hollow structure, particle size, surface charge, pH responsiveness, drug loading and release were investigated. Biological investigations including cytotoxicity evaluation and cellular uptake cytotoxicity assays were performed.
2. Experimental
2.1. Materials
γ-Benzyl-L-glutamate (BLG) was purchased from Jier Biochemical Company and used without any further purification. BLG-NCA was synthesized as our previous work with slight modification.12 Trimethylsilyl iodide (C3H9SiI), trifluoroacetic acid (TFA) and 3-aminopropyltriethoxysilane (APTS) were purchased from Aladdin Reagent Company (Shanghai). Tetraethyl orthosilicate (TEOS), ethanol (EtOH), ammonium hydroxide (NH3·H2O, 25–28%), hydrofluoric acid (HF, 40%), 1,4-dioxane and dichloromethane (CH2Cl2) were purchased from Shanghai Chemical Reagent Co., Ltd. 1,4-Dioxane and dichloromethane were further distilled before use. Chitosan (CS) (Mv = 4.0 × 10⁴) was purchased from Jinan Haidebei Marine Bioengineering Corp. (Shandong, China). 1-Ethyl-3-(3-dimethylaminopropyl) carbodiimide hydrochloride (EDC) and 1-hydroxypyrrolidine-2,5-dione (NHS) were purchased from Covalent Chemical Technology Co., Ltd. (Shanghai, China). Mitoxantrone (MTX) was purchased from Beijing Shilian Hengtong Chemical Technology Co., Ltd. (Beijing, China).Methyl thiazolyl tetrazolium (MTT), rhodamine B (RB), paraformaldehyde (PFA) and dihydrochloride 2-(4amidinophenyl)-6-indolecarbamidine (DAPI) were obtained from the Sigma-Aldrich Co., Ltd. The common mouse fibroblast L929 cells and the human gastric carcinoma SGC7901 cells were obtained from the Shanghai Cancer Institute were grown in DMEM medium (Paisley, UK) containing 10% fetal bovine serum (FBS) at 37 °C in a humidified environment containing 5% CO2.
2.2. Preparation of SiO2-g-PLGA nanoparticles
SiO2 nanoparticles were then functionalized with a layer of primary amine groups by APTS grafting. In this process, SiO2 nanoparticles (1.2 g) were dispersed in 184 mL of anhydrous ethanol. The dispersion was sonicated for 20 min before APTS was added. The mixture was refluxed at 85 °C for 6–8 h and followed by centrifugation, washing with ethanol for several times, and drying overnight under vacuum at 40 °C for 12 h. The obtained amino-functionalized SiO2 nanoparticles were denoted as SiO2–NH2.
To remove the γ-benzyl protection groups and obtain the SiO2-g-PLGA composite particles, the so-called “deprotection” step was accomplished by dissolving the SiO2-g-PBLG (1 g) in dry CH2Cl2 (20 mL) followed by addition of excess C3H9SiI (0.4 mL). The resulting pale yellow solution was stirred under nitrogen at 40 °C for 24 h in dark. The SiO2-g-PLGA was isolated by addition of a mixture solution containing EtOH, water and petroleum ether (with volume ratio 1![[thin space (1/6-em)]](https://www.rsc.org/images/entities/char_2009.gif) :
:![[thin space (1/6-em)]](https://www.rsc.org/images/entities/char_2009.gif) 1
1![[thin space (1/6-em)]](https://www.rsc.org/images/entities/char_2009.gif) :
:![[thin space (1/6-em)]](https://www.rsc.org/images/entities/char_2009.gif) 8), followed by filtration, washing with the mixture solution for several times, and drying overnight under vacuum at room temperature for 24 h.
8), followed by filtration, washing with the mixture solution for several times, and drying overnight under vacuum at room temperature for 24 h.
2.3. Fabrication of PLGA/CS nanogels
To synthesize PLGA/CS nanogels, SiO2-g-PLGA nanoparticles were dissolved in distilled water to obtain a 3 mg mL−1 solution. The pH of the solution was adjusted to 7 by the addition of 0.1 M HCl or NaOH solution. Then, EDC and NHS were added for activation of the carboxyl groups of SiO2-g-PLGA. The molar ratio of NHS to EDC was set at 1![[thin space (1/6-em)]](https://www.rsc.org/images/entities/char_2009.gif) :
:![[thin space (1/6-em)]](https://www.rsc.org/images/entities/char_2009.gif) 5, while –COOH of PLGA to EDC was 1
5, while –COOH of PLGA to EDC was 1![[thin space (1/6-em)]](https://www.rsc.org/images/entities/char_2009.gif) :
:![[thin space (1/6-em)]](https://www.rsc.org/images/entities/char_2009.gif) 1, 2
1, 2![[thin space (1/6-em)]](https://www.rsc.org/images/entities/char_2009.gif) :
:![[thin space (1/6-em)]](https://www.rsc.org/images/entities/char_2009.gif) 1, 3
1, 3![[thin space (1/6-em)]](https://www.rsc.org/images/entities/char_2009.gif) :
:![[thin space (1/6-em)]](https://www.rsc.org/images/entities/char_2009.gif) 1, 4
1, 4![[thin space (1/6-em)]](https://www.rsc.org/images/entities/char_2009.gif) :
:![[thin space (1/6-em)]](https://www.rsc.org/images/entities/char_2009.gif) 1 and 5
1 and 5![[thin space (1/6-em)]](https://www.rsc.org/images/entities/char_2009.gif) :
:![[thin space (1/6-em)]](https://www.rsc.org/images/entities/char_2009.gif) 1, respectively. A turbid solution was obtained after the dropwise addition of activated SiO2-g-PLGA to an aqueous solution of CS (5 mg mL−1, pH = 4.4). The molar ratio of –COOH of SiO2-g-PLGA to –NH2 of CS was set at 1
1, respectively. A turbid solution was obtained after the dropwise addition of activated SiO2-g-PLGA to an aqueous solution of CS (5 mg mL−1, pH = 4.4). The molar ratio of –COOH of SiO2-g-PLGA to –NH2 of CS was set at 1![[thin space (1/6-em)]](https://www.rsc.org/images/entities/char_2009.gif) :
:![[thin space (1/6-em)]](https://www.rsc.org/images/entities/char_2009.gif) 3. The reaction was allowed to proceed at room temperature for 12 h. Excess CS was removed by 2 cycles of centrifugation (13
3. The reaction was allowed to proceed at room temperature for 12 h. Excess CS was removed by 2 cycles of centrifugation (13![[thin space (1/6-em)]](https://www.rsc.org/images/entities/char_2009.gif) 000 rpm, 20 min) and washing with acetic acid solution (0.05 M, pH = 5.5).
000 rpm, 20 min) and washing with acetic acid solution (0.05 M, pH = 5.5).
Hollow PLGA/CS nanogels were obtained by dissolving the SiO2 core of SiO2-g-PLGA/CS composite nanoparticles in 4 mL of HF (5 M) aqueous solution for 2 h. After several cycles of centrifugation (13![[thin space (1/6-em)]](https://www.rsc.org/images/entities/char_2009.gif) 000 rpm, 20 min) and washing with deionized water, the sedimentation of the PLGA/CS nanogel obtained was redispersed into deionized water or lyophilized for further use.
000 rpm, 20 min) and washing with deionized water, the sedimentation of the PLGA/CS nanogel obtained was redispersed into deionized water or lyophilized for further use.
2.4. Physicochemical characterization
The FTIR spectra were recorded using a FT-IR spectrophotometer (AVATAR 370, Nicolet, USA) in the region of 4000–500 cm−1.The 1H NMR spectra were obtained by an AV 500 NMR from BRUKER. Deuterated water (D2O) was used as solvent for all the samples.
X-ray diffraction (XRD) patterns were analyzed using a diffractometer (D/MAX2550, Rigaku) with Cu Kα radiation at a voltage of 40 kV and 40 mA. The samples were scanned between 2θ = 5–60° with a scanning speed of 4° min−1.
The thermal gravimetric analysis was examined by means of thermogravimetry with a heating rate of 10 °C min−1 in nitrogen atmosphere on TA Q-500 instruments.
To determine the molecular weight of PLGA chains, SiO2-g-PLGA was dissolved in TFA. Then HF aqueous solution was added to etch SiO2 cores. After 2 hours, PLGA was precipitated by abundant EtOH. The fibrous polymer was washed with EtOH/water (1![[thin space (1/6-em)]](https://www.rsc.org/images/entities/char_2009.gif) :
:![[thin space (1/6-em)]](https://www.rsc.org/images/entities/char_2009.gif) 1, v/v) solution, isolated and vacuum dried. The viscosity-average molecular weight (Mv) was determined using an HH-W600 Ubbelohde viscometer (Ningbo Tianheng, China). The capillary diameter of the viscometer was 0.38 mm, and the experiment was performed in 0.4 M NaCl/0.01 M NaH2PO4 buffer solution (pH 7.05) at 25 °C. Mv was obtained from the Mark–Houwink equation: intrinsic viscosity [η] = KmMvα, where Km = 2.93 × 10⁵, and α = 0.923.14,15
1, v/v) solution, isolated and vacuum dried. The viscosity-average molecular weight (Mv) was determined using an HH-W600 Ubbelohde viscometer (Ningbo Tianheng, China). The capillary diameter of the viscometer was 0.38 mm, and the experiment was performed in 0.4 M NaCl/0.01 M NaH2PO4 buffer solution (pH 7.05) at 25 °C. Mv was obtained from the Mark–Houwink equation: intrinsic viscosity [η] = KmMvα, where Km = 2.93 × 10⁵, and α = 0.923.14,15
Zeta potentials were determined with Malvern Zetasizer 3000HS equipped with MPT-1 titrator (Malvern, Worcestershire, UK) at 25 °C. Electrophoretic mobilities were converted to zeta potentials using Smoluchowski's equation.
The morphology of PLGA/CS nanogel was observed by scanning electron microscopy (SEM, JEOL, JSM-6700F) and transmission electron microscopy (TEM, FEI, Tecnai G220 TWIN). Samples for SEM observation were prepared by depositing suspensions of nanogels on Si slides. The samples for TEM observation were dripped onto nitrocellulose-covered copper grids at room temperature.
The mean hydrodynamic particle diameter and particle size distribution (polydispersity index, PDI) in aqueous media were determined at λ = 632.8 nm and a scattering angle of 90° based on the cumulant method using an ALV/CGS-3 apparatus equipped with a 22 mW He–Ne laser as the light source. The angular dependence of the autocorrelation functions was measured using the same instrument as described above. Correlation functions were also analyzed by the cumulant method at varying angles. To assess the geometrical morphology of the PLGA/CS nanogel, the mean hydrodynamic radius (Rh) was obtained at a scattering angle of 90° based on the CONTIN method. The root-mean-square radius of gyration (Rg) was evaluated by the angular dependent measurements of the light scattering intensity. A Zimm plot of the scattering intensity (KC/Rvv(q), Rvv(q) is known as the Rayleigh ratio) versus the square of the scattering vector (q2) was used to determine Rg.16
UV-vis spectra were recorded on an Agilent 8453 UV-vis spectrophotometer.
2.5. Drug loading and release
In order to study the effect of pH value on the loading capacity of nanogels, 1 mg of the nanogels were incubated in 5 mL of mitoxantrone (MTX, 0.4 mg mL−1) aqueous solution at different pH values (4, 5, 6, 7.4 and 9.5). After being incubated under various conditions for 1 h, the MTX-loaded nanogels were centrifuged (13![[thin space (1/6-em)]](https://www.rsc.org/images/entities/char_2009.gif) 000 rpm, 20 min), washed for 2 times with deionized water and lyophilized for further use in release experiments. The concentration of MTX remained in the supernatant after centrifugation was measured at 609 nm wavelength, which was the UV-vis spectroscopy characteristic absorption wavelength. The MTX loading inside the nanogels was calculated from the change of MTX concentrations in the supernatant. All the data were averaged from 3 parallel experiments.
000 rpm, 20 min), washed for 2 times with deionized water and lyophilized for further use in release experiments. The concentration of MTX remained in the supernatant after centrifugation was measured at 609 nm wavelength, which was the UV-vis spectroscopy characteristic absorption wavelength. The MTX loading inside the nanogels was calculated from the change of MTX concentrations in the supernatant. All the data were averaged from 3 parallel experiments.
For the examination of MTX release, 5 mg of MTX-loaded nanogels were carefully enveloped into dialysis bags and exposed to 100 mL of buffer solution at different pH values of 4, 5, 6 and 7.4, respectively. Five milliliters buffer solution was fetched from release system with reconstitution of 5 mL fresh buffer solution at every predetermined time. The concentration of the MTX released from this drug delivery system was monitored at 609 nm of UV absorbance.
2.6. Cytotoxicity evaluation of PLGA/CS nanogels and antitumor activity of MTX-loaded PLGA/CS nanogels
The cytotoxicity of PLGA/CS nanogels was evaluated using the MTT assay in the common mouse fibroblast L929 cells. Briefly, the cells (5 × 10³ per well) were seeded in 96-well plates and incubated for 24 h. Then PLGA/CS nanogels were added into each well at different concentrations ranging from 5 to 400 μg mL−1. After 24 h and 48 h of incubation, 100 μL of stock solution of MTT was added to each well, and the cells were further incubated for 4 h at 37 °C. The culture medium was then removed from each well and replaced with 150 μL of DMSO. The absorbance was measured at 490 nm using a microplate reader (Bio-RAD, model 550). Untreated cells were taken as control with 100% viability.The antitumor activity of MTX-loaded PLGA/CS nanogels was evaluated by MTT method. Human gastric carcinoma SGC7901 cells (5 × 10³ per well) were cultured on a 96-well plates, and then incubated for 24 h. Then, the MTX and MTX-loaded nanogels were added to the wells at the MTX concentration of 0.1, 0.25, 0.5, 1.0, 1.5, 2.0, 3.0, 4.0 μg mL−1, and the cells were incubated for an additional 24 h and 48 h. 100 μL of MTT solution (0.5 mg mL−1) was added to each well, and the cells were further incubated for 4 h at 37 °C. The culture medium was then removed from each well and replaced with 150 μL of DMSO. The absorbance was measured at 490 nm using a microplate reader (Bio-RAD, model 550). Untreated cells were taken as control with 100% viability.
The inhibitory rate of SGC7901 cells was calculated according to following equation:
The experimental data were expressed as means ± standard deviation (SD). Single factor analysis for variance (ANOVA) was used to assess the statistical significance of the results. Statistical significance was set to a p value ≤0.05.
2.7. Cellular uptake of fluorescent PLGA/CS nanogels
Rhodamine B (RB) was used as a fluorescence probe to facilitate the observation of cellular uptake of the PLGA/CS nanogels. Free RB was removed from the RB-loaded PLGA/CS nanogels by ultrafiltration. Human gastric carcinoma SGC7901 cells (5 × 10⁴ per well) were seeded in 24-well plates and incubated for 24 h. The RB and RB-loaded nanogels were added to the wells at the RB concentration of 10, 50 and 100 μg mL−1, and the cells were incubated for an additional 4 h. After removing the supernatant, the cells were fixed with 4% paraformaldehyde for 20 min and then 10 μg mL−1 4,6-diamidino-2-phenylindole dihydrochloride (DAPI) was added for 10 min incubation. Subsequently, the cells were washed with PBS and sealed with glycerine. The cellular uptake was observed using the Olympus IX-51 fluorescence microscopy from Olympus Optical Company, Ltd (Tokyo, Japan).2.8. Flow cytometer analysis of PLGA/CS nanogels
SGC7901 cells (2 × 10⁵ per well) were seeded in 6-well plates and incubated for 24 h. The RB and RB-loaded nanogels were added to the wells at RB concentration of 50 μg mL−1. After incubating for 4 h, the cells were then washed with PBS, trypsinized, harvested and resuspended in PBS. The cellular binding of the PLGA/CS nanogels was measured using a Sorp Fascaria II flow cytometer (Becton Dickinson, USA).3. Result and discussion
3.1. Synthesis of SiO2-g-PLGA nanoparticles
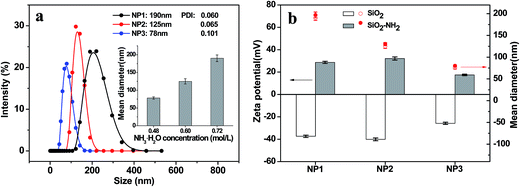
The zeta potential and size of SiO2 nanoparticles before and after surface amination were displayed in Fig. 1b. As the existence of silanol groups on the surface, NP1, NP2 and NP3 showed the negative zeta potentials of −37.4, −40.1 and −25.8 mV, respectively. After amination, the zeta potentials changed to positive value of 28.7, 32.1 and 17.5 mV. Meanwhile, a slight increase in size was observed. All these findings indicated successful surface functionalization of SiO2 nanoparticles with amino groups.
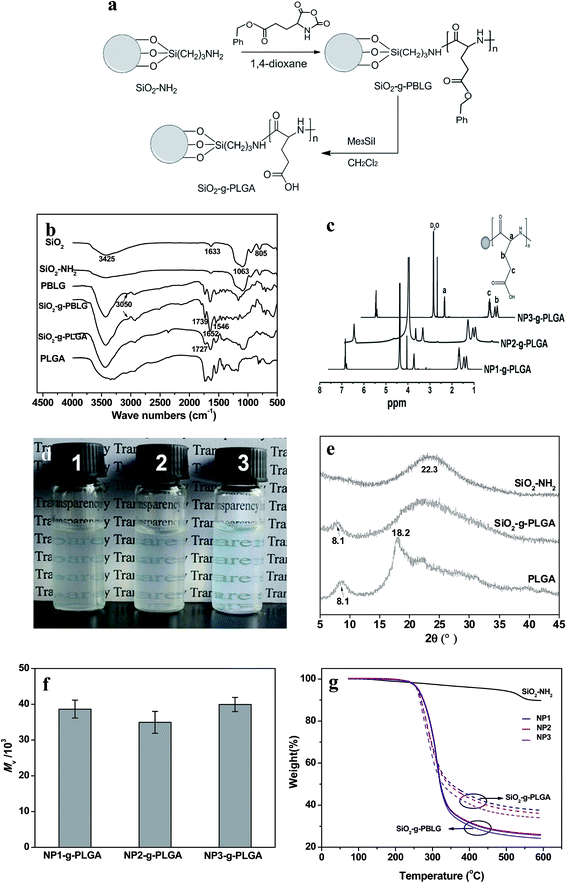
Surface grafting of PLGA was confirmed by FTIR, XRD, and 1H NMR spectra. Fig. 2b demonstrated FTIR spectra of SiO2 before and after surface modification. The SiO2 nanoparticles showed the characteristic bands at about 1063, 805 and 1633 cm−1, which were ascribed to Si–O–Si, O–Si–O and Si–OH bands, respectively.22 Compared with SiO2, SiO2–NH2 nanoparticles exhibited a broader peak at 3425 cm−1, corresponding to the co-existence of both –OH and –NH2 groups. Surface grafting of poly(γ-benzyl-L-glutamate) onto SiO2 nanoparticles was monitored by observation of new peaks of ν(C![[double bond, length as m-dash]](https://www.rsc.org/images/entities/char_e001.gif) O) at 1739 cm−1, amide I and II at 1652 and 1546 cm−1, ν(Csp2–H of benzene ring) at 3050 cm−1. For SiO2-g-PLGA, the peak at 3050 cm−1 disappeared, indicating successful deprotection of the benzyl group. Meanwhile, the peak at 1739 cm−1 shifted to 1727 cm−1 and became broader, indicating the appearance of carboxy groups.23
O) at 1739 cm−1, amide I and II at 1652 and 1546 cm−1, ν(Csp2–H of benzene ring) at 3050 cm−1. For SiO2-g-PLGA, the peak at 3050 cm−1 disappeared, indicating successful deprotection of the benzyl group. Meanwhile, the peak at 1739 cm−1 shifted to 1727 cm−1 and became broader, indicating the appearance of carboxy groups.23
The representative 1H NMR spectra of SiO2-g-PLGA with different core size of SiO2 nanoparticles were presented in Fig. 2c. The alphabetically labeled peaks were assigned to the corresponding protons shown in inset scheme. The peaks at 1.78, 1.88, 2.11 and 4.16 ppm were characteristic of proton peaks of PLGA, which was in accordance with previous result.24
Bare SiO2 nanoparticles precipitated rapidly in water. The grafted PLGA played an important role in the dispersion of SiO2 nanoparticles. It could be obviously seen from Fig. 2d that the SiO2-g-PLGA nanoparticles were soluble in water. The solutions were stable for more than 1 month without any precipitation. The excellent solubility of SiO2-g-PLGA nanoparticles also confirmed the existence of grafted PLGA shell, and would be beneficial for further preparation of PLGA/CS nanogels.
The comparison of typical XRD patterns of SiO2 before and after surface grafting of PLGA was displayed in Fig. 2e. For SiO2 nanoparticles, a broad peak centered at 22.3° was observed, corresponding to the characteristic diffraction of amorphous silica. The diffractogram of PLGA consisted of two weak crystallization peaks at 2θ = 8.1° and 19.8°,23 due to its low crystallizability. For SiO2-g-PLGA nanoparticles, the peak at 2θ = 8.1° was still observed, and a broad peak over the range of 15–35° was detected, ascribing to the overlap of the peaks for both PLGA and SiO2. This indicated the PLGA was grafted onto SiO2 nanoparticles, and the surface grafting did not destruct the original crystalline structure of PLGA.
To determine the molecular weight of grafted PLGA chains, the grafted PLGA was collected and measured after dissolving the silica core. As shown in Fig. 2f, all of the SiO2-g-PLGA nanoparticles (NP1, NP2 and NP3) exhibited similar viscosity-average molecular weight (Mv) of grafted PLGA with the value of about 4 × 10⁴.
The grafted amount of PBLG and PLGA was estimated by TGA.25 Before heated to 600 °C, all samples were heated to 120 °C to eliminate water or solvent, so the weight loss of composite particles minus that of SiO2–NH2 could be approximately the amount of grafted PBLG or PLGA.26 As shown in Fig. 2g, SiO2–NH2 and NP1-g-PBLG, NP2-g-PBLG and NP3-g-PBLG showed weight loss of 10.7, 74.3, 73.5 and 70.5 wt%, respectively. After deprotection of the benzyl group, SiO2-g-PLGA showed the corresponding weight loss of 66, 65.7 and 63.4 wt%. Therefore, the grafted amount of PLGA was in the range of 52–55%, the values of which were very similar for NP1, NP2 and NP3.
3.2. Fabrication of PLGA/CS nanogels
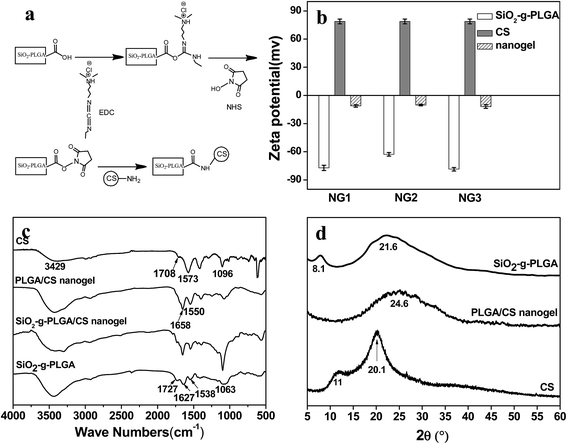
To prepare the PLGA/CS nanogels, PLGA shell of SiO2-g-PLGA nanoparticles was crosslinked using chitosan (CS) as macromolecular, followed by dissolution of the SiO2 core. PLGA/CS complexation between PLGA and CS in the form of porous scaffolds27 and porous microspheres28 has been scrutinized in our previous work. However, the stable PLGA/CS nanogels based on electrostatic interaction could not be obtained because of the dissolution and collapse of the PLGA/CS polyelectrolyte complex shell during removal of silica core in HF solution. Thus, the chemical crosslinking between SiO2-g-PLGA and CS was highly desirable.EDC and NHS were used as the carboxylic acid activators, which were non-toxic and could realize “zero length” amide crosslinks between carboxyl groups from SiO2-g-PLGA and amino groups from CS.29,30 As presented in Fig. 3a, EDC was used as a dehydrating agent to activate carboxyl groups to a reactive O-acylisourea, followed by formation of a semi-stable NHS ester. Aminolysis of NHS ester with amino groups of CS resulted in a stable network structure crosslinked by amide bonds.
The EDC amount had a great effect on stability of the resulting PLGA/CS nanogels. Stable PLGA/CS nanogels could only be obtained when EDC/–COOH molar ratio was not less than 3![[thin space (1/6-em)]](https://www.rsc.org/images/entities/char_2009.gif) :
:![[thin space (1/6-em)]](https://www.rsc.org/images/entities/char_2009.gif) 1. Less amount of EDC led to the collapse of the hydrogel and precipitate of PLGA during removal of silica core in HF solution, which might be ascribed to low activation efficiency and crosslinking density between PLGA and CS.
1. Less amount of EDC led to the collapse of the hydrogel and precipitate of PLGA during removal of silica core in HF solution, which might be ascribed to low activation efficiency and crosslinking density between PLGA and CS.
Three kinds of nanogels named NG1, NG2 and NG3 were fabricated using SiO2-g-PLGA with the silica core of NP1, NP2 and NP3 as precursors. The molar ratio of EDC to –COOH was set at 5![[thin space (1/6-em)]](https://www.rsc.org/images/entities/char_2009.gif) :
:![[thin space (1/6-em)]](https://www.rsc.org/images/entities/char_2009.gif) 1.
1.
The procedure in the fabrication of nanogels was followed by microelectrophoresis, as shown in Fig. 3b. SiO2-g-PLGA possessed negative charge with the zeta potential ranging from −62 to −78 mV because some carboxylate groups ionized in aqueous solution, while CS with NH3+ was positive charged with the zeta potential of 79 mV. Compared with SiO2-g-PLGA, the PLGA/CS nanogels decreased drastically in zeta potential, confirming the consumption of carboxyl groups from grafted PLGA and the introduction of amino groups from CS.
The FTIR spectra were displayed in Fig. 3c. For SiO2-g-PLGA, the absorption bands located at 1727, 1627 and 1538 cm−1 originated from C![[double bond, length as m-dash]](https://www.rsc.org/images/entities/char_e001.gif) O, amide I and II groups of PLGA, while the absorption band at 1063 cm−1 was attributed to the Si–O–Si stretching vibration.22 With respect to CS, the characteristic absorption band at 3429 cm−1 was attributed to the stretching vibration of the N–H group bonded to the O–H group, the peaks at 1657 cm−1 were ascribed to amide groups,31 and the peak at 1101 cm−1 was attributed to vibrational modes of the saccharide units.32 As for SiO2-g-PLGA/CS nanogels, the original characteristic absorption bands of C
O, amide I and II groups of PLGA, while the absorption band at 1063 cm−1 was attributed to the Si–O–Si stretching vibration.22 With respect to CS, the characteristic absorption band at 3429 cm−1 was attributed to the stretching vibration of the N–H group bonded to the O–H group, the peaks at 1657 cm−1 were ascribed to amide groups,31 and the peak at 1101 cm−1 was attributed to vibrational modes of the saccharide units.32 As for SiO2-g-PLGA/CS nanogels, the original characteristic absorption bands of C![[double bond, length as m-dash]](https://www.rsc.org/images/entities/char_e001.gif) O group at 1727 cm−1 and amide II group at 1538 cm−1 for PLGA almost disappeared, also did those of amide bands for CS. New absorption bands appeared at peaks of 1658 and 1550 cm−1, revealing chemical cross-linking between PLGA and CS. After core removal, the intensity of the silica's characteristic absorption band at 1063 cm−1 decreased greatly in the spectrum of PLGA/CS nanogels. Considering the existence of adjacent peak at 1101 cm−1 for CS, the weak absorption centered at 1063 cm−1 could be ascribed to trace residual silica.
O group at 1727 cm−1 and amide II group at 1538 cm−1 for PLGA almost disappeared, also did those of amide bands for CS. New absorption bands appeared at peaks of 1658 and 1550 cm−1, revealing chemical cross-linking between PLGA and CS. After core removal, the intensity of the silica's characteristic absorption band at 1063 cm−1 decreased greatly in the spectrum of PLGA/CS nanogels. Considering the existence of adjacent peak at 1101 cm−1 for CS, the weak absorption centered at 1063 cm−1 could be ascribed to trace residual silica.
XRD diffractogram was used to investigate the crystalline properties of CS, SiO2-g-PLGA and PLGA/CS nanogels, as shown in Fig. 3d. The diffractogram of CS consisted of two major crystalline peaks at 11 and 20.1°, indicating a certain degree of crystallinity. SiO2-g-PLGA exhibited weak peaks at around 8.1 and 21.6°, due to its low crystallizability. However, for the PLGA/CS nanogels, only a broad peak centered at 24.6° was detected. This indicated that the cross-linking between SiO2-g-PLGA and CS resulted in destruction of the original crystalline structure of component polymers.
3.3. Micromorphology and microstructure of PLGA/CS nanogels
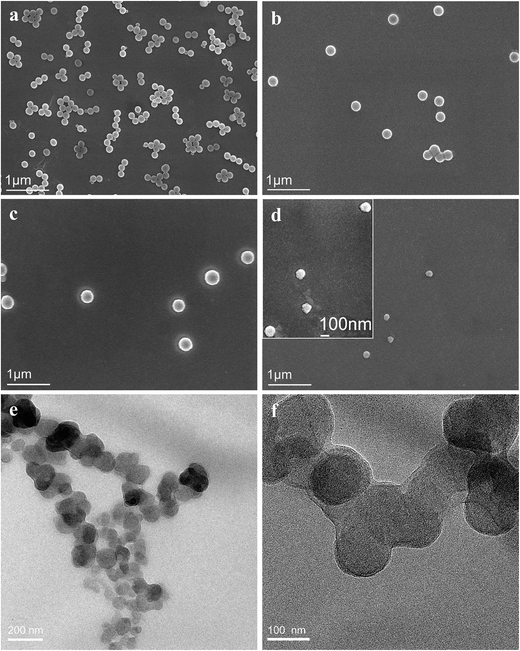
The spherical, uncoated SiO2 nanoparticles (NP1) were dispersed with a slight agglomeration (Fig. 4a). The average diameter was about 190 nm, in accordance with the result in Fig. 1a. The diameter of SiO2 nanoparticles increased to 230 nm after PLGA surface grafting (Fig. 4b). After crosslinking with CS, the SiO2-g-PLGA/CS nanogels showed a much larger diameter of 295 nm (Fig. 4c). After core removal, PLGA/CS nanogels retained the original shape with no sign of rupture or collapse, but the size of which (ca. 100 nm) was much smaller than that of SiO2-g-PLGA/CS nanogels. We believed that during the drying process, hollow nanogels for TEM sample preparation tended to shrink without internal support from silica template. The shrinkage of polymer-based spheres after dissolving the inner templates was also reported previously.33
TEM observation also showed that the PLGA/CS nanogels were spherical in shape, with a uniform particle size of about 100 nm (Fig. 4e and f), which was in good agreement with the SEM result. However, we failed to observe a hollow structure, which could be attributed to the great volume contraction of the swollen hollow PLGA/CS nanogels with thick shell (Part 3.3.2 and 3.3.3) upon evaporation of water during TEM sample preparation.34
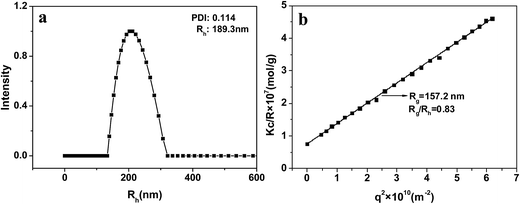
Rg/Rh is very sensitive to the particle morphology. Generally, the Rg/Rh values for spheres, vesicles with thin wall, and vesicles with wall thickness of about 1/3 their outer radius are 0.77, 1.0, and 0.86, respectively.36,37 The DLS and SLS results for NG1 at 25 °C and pH 7.4 are shown in Fig. 5. DLS curve of PLGA/CS nanogels with Rh = 189.3 nm was presented in Fig. 5a. The Rg value was obtained from the partial Zimm plot of KC/Rvv(q) versus q2 by angle-dependent SLS measurements (Fig. 5b).38 The Rg/Rh ratio of ca. 0.83 was essentially identical to the theoretical value (0.86), which indicated a hollow spherical shape of the nanogels with thick shell. The thick shell of the hollow PLGA/CS nanogels was in accordance with the wall thickness of about 90 nm displayed in Fig. 6b.
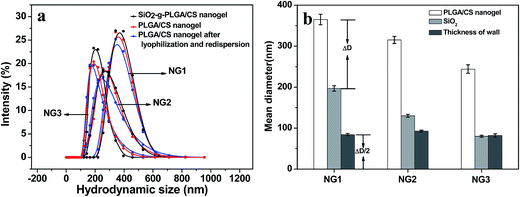
The nanogel size increased with silica template size. Using diameter of the nanogel and silica template as an outer diameter (Dnanogel) and inner diameter (Dsilica) respectively, the nanogel had a wall thickness equal to half of the difference between Dnanogel and Dsilica. As shown in Fig. 6b, the wall thickness calculated was about 90 nm. There was not obvious difference in the wall thickness among NG1, NG2 and NG3. The nanogel size could be estimated from the following formula: Dnanogel = Dsilica + ΔD (polymer wall: ∼180 nm). Therefore, the nanogel size could be effectively and accurately controlled by simply changing the silica template size. Similarly, it was reported that the size of the poly(N-isopropylacrylamide)-co-acrylic acid hydrogel cages could be controlled by using silica template core of varied size and different amount of monomers.39 Xing et al.40 also reported that the size and shape of the nanogel were controlled by SiO2 template.
3.4. pH responsiveness, drug loading and release of PLGA/CS nanogels
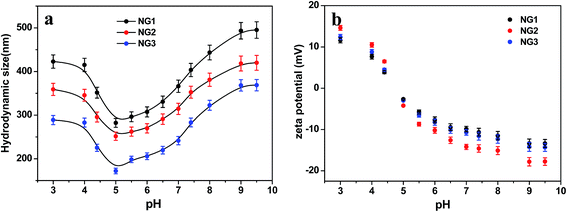 | ||
| Fig. 7 pH responsiveness of PLGA/CS nanogels. Variation of (a) size and (b) zeta potential of PLGA/CS nanogels at different pH values. | ||
As expected, the hydrodynamic diameter of nanogel was found to vary with pH values of medium. The size of nanogels reached the minimum in the pH range of 4 to 6.5, and became significantly larger under both high and low pH conditions. Meanwhile, the zeta potential showed a monotonous decrease from positive values to negative ones in the pH range of 3.0 to 9.5. The size variation of the hydrodynamic diameter was governed by the internal osmotic pressure due to the mobile counter-ions contained within the nanogel containing pH-responsive groups, which balance the internal electrostatic repulsion.41 In the case of low pH and high pH, the dominant charges in the nanogels were protonated amino groups (–NH3+) from CS and dissociated carboxylic groups (–COO−) from PLGA, respectively. The electrostatic repulsion between these ionized groups induced swelling of nanogels. When the pH of medium was in range of pKa of PLGA (4.4)11 and pKa of CS (6.3),42 both PLGA and CS were partly ionized, and they could form compact interpolyelectrolyte complexes by electrostatic interaction. Therefore, the size of nanogels reduced to a minimum. Dai et al.23 also found the electrostatic bonding of –COOH of PLGA and –NH2 of CS was strongest at pH = 4–5.
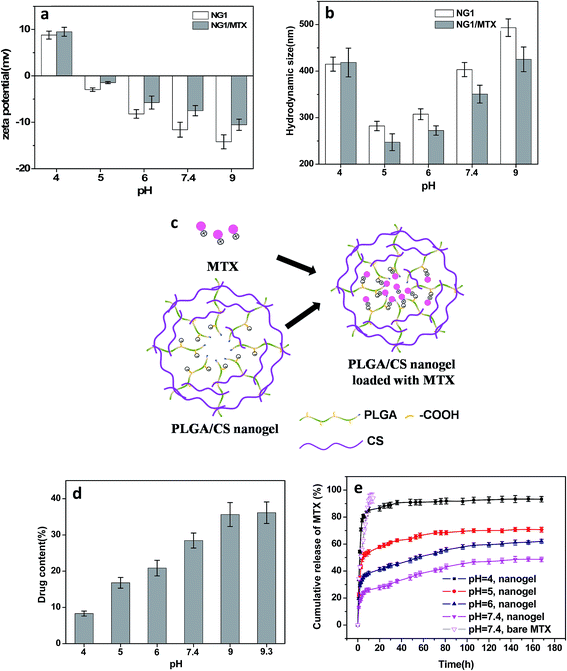
Compared with blank PLGA/CS nanogels, the zeta potential after MTX loading was significantly increased, as shown in Fig. 8a. Meanwhile, the size of drug loaded PLGA/CS nanogels reduced obviously at a pH ranging from 5 to 9 (Fig. 8b). As previously reported, MTX bore positive charge because of positively charged nitrogen atoms from the lateral chains of the drug,43 while the PLGA/CS nanogels were negatively charged at a pH 5 to 9.3. The increasing zeta potential and decreasing size of PLGA/CS nanogels after MTX loading could be ascribed to electrostatic interaction between nanogels and MTX, as schematically illustrated in Fig. 8c. Chen et al.44 also found the size of poly(acrylic acid) nanogels decreased after loading bovine serum albumin (BSA) with opposite charge.
Fig. 8d demonstrated the influence of pH value on the MTX loading capacity. The loading content increased greatly with the increase of pH value, from 14.3% of loading capacity at pH 4 to 43.6% at pH 9. The pH dependence of MTX loading could be ascribed to two factors. On one hand, there existed electrostatic interaction between MTX and nanogels, since MTX was positively charged at pH under 9.3,45 while PLGA/CS nanogels showed negative charge at a pH ranging from 5 to 9.3 (Fig. 7b and 8a). It was reported that the percentages of positively charged MTX decreased from 100 to 58.5%, when pH value increased from 4.0 to 7.4.45 However, the zeta potential of PLGA/CS nanogels decreased greatly from 8.79 to −14.2 mV when pH increased from 4.0 to 9.0. The strength of this interaction between nanogels and MTX predominantly depended on the charge of –COOH groups, which became stronger with increasing pH values due to the higher degree ionization of –COOH groups of PLGA chains, resulting in increased loading content. On the other hand, the size increased with increasing pH, facilitating the drug penetration and diffusion. At the pH value of 4, it was surprising that positively charged PLGA/CS nanogels (Fig. 7b and 8a) were capable of loading positive MTX, which might be ascribed to the hydrogen bonding between nanogels and MTX, and the cavity inside the hollow nanogels. Recently, Toh et al.46 also reported the successful loading of MTX into nanodiamonds with positive charge via physical adsorption.
The release behavior of MTX from PLGA/CS nanogels (NG1) as a function of pH were shown in Fig. 8e. For comparison, the release profile of bare MTX was also depicted. The bare MTX in pH 7.4 buffer released rapidly. The initial burst release was severe with a release amount of 75.3% within 9 h. Compared with bare MTX, the release of MTX from PLGA/CS nanogels was obviously delayed. The pH value greatly affected the release profile of MTX loaded PLGA/CS nanogels. Quick release still could be observed within the first 10 h at pH 4, followed by a release balance with a cumulative release of 93.2%. This was due to the electrostatic repulsion between positively charged hydrogels and MTX bearing the same charge. Moreover, remarkable swelling at pH 4 was conducive to drug penetration and release. The cumulative release of MTX was only 35% within a week under the physiological conditions (pH 7.4). However, by adjusting the solution pH to acidity, MTX was released in significant amounts from the drug-loaded hydrogels into the external environment, i.e., 47.9% at pH 6 and 62.1% at pH 5 within a week. Actually, the hydrodynamic diameter of PLGA/CS nanogels increased with increasing pH value in the pH range of 5 to 7.4, which might accelerate MTX penetration and release. Nevertheless, drug release was greatly restricted at higher pH value, which could be ascribed to the dominant effect of electrostatic interaction. As discussed above, the electrostatic interaction between PLGA/CS nanogels and MTX was stronger at higher pH value, greatly restricting drug release. Similarly, Ma et al. had reported a pH-responsive release of MTX by varying the electrostatic interaction between negatively charged silicate and positively charged MTX under designed pH 4–7.4 in PBS solution.45 Duan et al. also found rapid MTX release at low-pH environment from supramolecular vesicles self-assembled by host–guest inclusion complex, they ascribed this phenomenon to pH triggered vesicles collapse.47
All the above evidences illustrated the electrostatic interaction between PLGA/CS nanogels and MTX was the key driving force for drug loading and release. The MTX release from PLGA/CS nanogels showed a good response to physiologically relevant pH (pH 4.0–7.4). It was well known the microenvironment of tumor cells was acidic for both intracellular and extracellular compartments, the rapid release of MTX from MTX-loaded hydrogels could be triggered by the acidic microenvironment of tumor cells, which was extremely significant for specific targeted therapy.45,47
Although the pH-responsive drug delivery systems for MTX have been developed based on mesoporous silica nanoparticles,45 nanodiamond,46 supramolecular vesicles self-assembled by pillar[6]arene and ferrocene derivative,47 etc. However, the unsatisfactory biodegradability of inorganic nanoparticles, and instability of supramolecular vesicles in physiological environment have been limiting their effective applications. Comparatively, PLGA/CS nanogels have been found to be more desirable pH-responsive carriers for MTX delivery, because of their various advantages, such as biodegradability, stability in physiological environment, high loading and controllable release.
3.5. Cytotoxicity of PLGA/CS nanogels and anticancer effect of MTX-loaded PLGA/CS nanogels
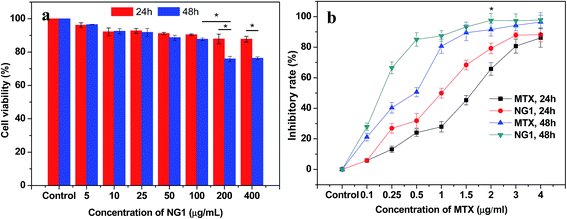
The cytotoxicity of PLGA/CS nanogels was evaluated in fibroblast L929 cells via an MTT assay. As shown in Fig. 9a, the cell cytotoxicity of L929 cells treated with blank PLGA/CS nanogels (NG1) was above 90% when the final concentration of the nanogels was less than 100 μg mL−1. Besides, there was no significant difference in cellular viability at 24 h and 48 h. All these indicated that the blank PLGA/CS nanogels showed a negligible cytotoxicity at a concentration of no more than 100 μg mL−1. When the concentration was further increased to 200 and 400 μg mL−1, the cell viability was decreased to approximately 80% at 48 h, showing the cell viability had a dose and time dependence. The result suggested that the NG was cytocompatible and suitable for future biological applications.48The potential applications in the biomedical fields were assessed by investigating the cancer cell inhibition of MTX-loaded PLGA/CS nanogels against the human gastric carcinoma SGC7901 cells using the MTT assay. As revealed by Fig. 9b, both MTX and MTX loaded PLGA/CS nanogels (NG1) exhibited obvious inhibition effect on the cancer cells. And the inhibitory rate was higher upon 48 h incubation than that at 24 h incubation on the condition of the same concentration of MTX (≤2 μg mL−1). SGC7901 cells treated with the MTX-loaded PLGA/CS nanogels showed the substantially higher inhibitory rate than those treated with the same concentration MTX, which might be attributed to the efficient delivery of the drug into the cells in the absence of PLGA/CS nanogels.
3.6. Cellular uptake of PLGA/CS nanogels
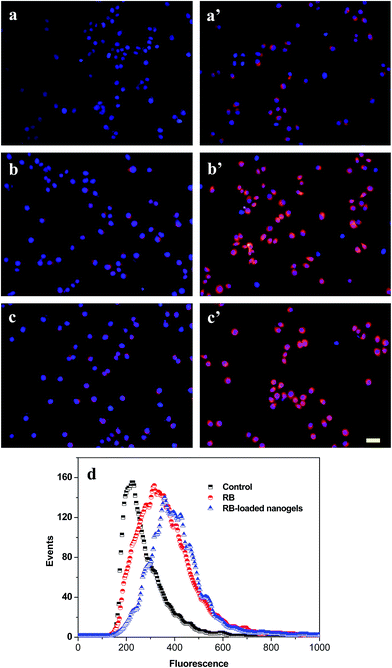
The cellular uptake of PLGA/CS nanogels was evaluated with fluorescence microscopy and flow cytometry. Fluorescence microscopy was used to visualize the internalization of RB and RB-loaded PLGA/CS nanogels (NG1) into the gastric carcinoma SGC7901 cells. Fig. 10a–c shows that in the SGC7901 cells, the nucleus exhibited a red layer of fluorescence after 4 h of culture with the RB. The fluorescent signal in the SGC7901 cells treated with the RB-loaded nanogels (Fig. 10a′–c′) was much stronger than in cells treated with the RB alone. It was reported that CS decorated on the nanoparticle surface facilitates cellular internalization via the unspecified sugar receptors on the cell membrane.49 PLGA/CS nanogels adsorbed onto the surface of the cell membrane could be internalized by an endocytotic means, which permitted the delivery of high concentration of drug into cell.50The cellular uptake of the PLGA/CS nanogels by SGC7901 cells was further demonstrated by flow cytometer analysis after 24 h of incubation with RB, RB-loaded PLGA/CS nanogels. As shown in Fig. 10d, the fluorescence intensity of cells incubated with RB-loaded PLGA/CS nanogels (NG1) was significantly higher than that of cells incubated with the RB in the test concentration range, suggesting that the internalization ability of the RB-loaded nanogels for the cancer cells are greater than that of the bare RB.
These results suggested that the PLGA/CS nanogels could efficiently enhance the cellular uptake by SGC7901 cells, which would contribute to increase the therapy efficacy for tumor.51
4. Conclusions
In this study, we have synthesized a series of novel hollow PLGA/CS nanogel by combining templating approach with a “grafting from” method and intermacromolecules crosslinking technique. This strategy was showed to be versatile, simple, and suitable for precise control of the nanogel size. The resultant PLGA/CS nanogels exhibited pH-dependent response, which was elucidated according to the variation of size of nanogels and zeta potential at different pH values. The loading capacity of MTX increased greatly from 14.3 to 43.6% when the pH value increased from 4 to 9. The release behavior of MTX from the PLGA/CS hydrogels could also be controlled by changing solution pH values. Rapid release could be observed in acidic condition with significant cumulative drug release amounts from the MTX-loaded hydrogels, i.e., 47.9% at pH 6, 62.1% at pH 5, and 93.2% at pH 4 within a week. MTT assays indicated that the PLGA/CS nanogels showed negligible cytotoxicity and were highly compatible with mouse fibroblast L929 cells. MTX loaded PLGA/CS nanogels exhibited higher inhibition effect on the cancer cells than free MTX. Fluorescence microscopy and flow cytometer analysis demonstrated that PLGA/CS nanogels could be efficiently delivered into the SGC7901 cells.Therefore, the excellent pH responsiveness, quick release of MTX at acidic pH environment, efficient drug delivery and improved cytotoxicity to the human gastric carcinoma SGC7901 cells enabled the MTX-loaded PLGA/CS hydrogels to be used as a promising and effective carrier for controlled drug release and anti-tumour therapies.
Acknowledgements
The work was supported by the National Natural Science Foundation of China (no. 51473090 and 51373094), the Natural Science Foundation of Shanghai City (no. 14ZR1414600) and the Science and Technology Commission of Shanghai Municipality (No. 15JC1490400). Mr Yuliang Chu from Instrumental Analysis and Research Centre (Shanghai University) is acknowledged for their help in SEM measurement.References
- A. N. Koo, H. J. Lee, S. E. Kim, J. H. Chang, C. Park, C. Kim, J. H. Park and S. C. Lee, Chem. Commun., 2008, 6570–6572 RSC.
- W. Q. Shen, Y. L. Chang, G. Y. Liu, H. F. Wang, A. N. Cao and Z. S. An, Macromolecules, 2011, 44, 2524–2530 CrossRef CAS.
- H. A. Abd El-Rehim, E. A. Hegazy, A. A. Hamed and A. E. Swilem, Eur. Polym. J., 2013, 49, 601–612 CrossRef CAS.
- T. G. Van Thienen, B. Lucas, F. M. Flesch, C. F. van Nostrum, J. Demeester and S. C. De Smedt, Macromolecules, 2005, 38, 8503–8511 CrossRef CAS.
- N. Singh and L. A. Lyon, Chem. Mater., 2007, 19, 719–726 CrossRef CAS.
- M. Motornov, H. Royter, R. Lupitskyy, Y. Roiter and S. Minko, Langmuir, 2011, 27, 15305–15311 CrossRef CAS PubMed.
- F. Maggi, S. Ciccarelli, M. Diociaiuti, S. Casciardi and G. Masci, Biomacromolecules, 2011, 12, 3499–3507 CrossRef CAS PubMed.
- V. Dudnik, G. B. Sukhorukov, I. L. Radtchenko and H. Mohwald, Macromolecules, 2001, 34, 2329–2334 CrossRef CAS.
- S. Argentiere, L. Blasi, G. Morello and G. Gigli, J. Phys. Chem. C, 2011, 115, 16347–16353 CAS.
- T. Zhou, C. F. Xiao, J. Fan, S. M. Chen, J. Shen, W. T. Wua and S. Q. Zhou, Acta Biomater., 2013, 9, 4546–4557 CrossRef CAS PubMed.
- C. Li, Adv. Drug Delivery Rev., 2002, 54, 695–713 CrossRef CAS PubMed.
- Y. C. Chang and C. W. Frank, Langmuir, 1996, 12, 5824–5829 CrossRef CAS.
- W. Stöber, A. Fink and E. Bohn, J. Colloid Interface Sci., 1968, 26, 62–69 CrossRef.
- M. Idelson and E. R. Blout, J. Am. Chem. Soc., 1958, 80, 4631–4634 CrossRef CAS.
- I. Irurzun, J. J. Bou, G. Perez-Camero, C. Abad, A. Campos and S. Munoz-Guerra, Macromol. Chem. Phys., 2001, 202, 3253–3256 CrossRef CAS.
- C. Wu and S. Q. Zhou, Phys. Rev. Lett., 1996, 77, 3053–3055 CrossRef CAS PubMed.
- K. Nozawa, H. Gailhanou, L. Raison, P. Panizza, H. Ushiki, E. Sellier, J. P. Delville and M. H. Delville, Langmuir, 2005, 21, 1516–1523 CrossRef CAS PubMed.
- M. Kar, P. S. Vijayakumar, B. L. V. Prasad and S. S. Gupta, Langmuir, 2010, 26, 5772–5781 CrossRef CAS PubMed.
- F. Audouin, M. Fox, R. Larragy, P. Clarke, J. Huang, B. O'Connor and A. Heise, Macromolecules, 2012, 45, 6127–6135 CrossRef CAS.
- G. Subramanian, R. P. Hjelm, T. J. Deming, G. S. Smith, Y. Li and C. R. Safinya, J. Am. Chem. Soc., 2000, 122, 26–34 CrossRef CAS.
- E. S. Cantu, S. T. Selcuk, J. Qiu, Z. Zhou and P. S. Russo, Langmuir, 2010, 26, 15604–15613 CrossRef PubMed.
- S. F. Yan, W. Ling and E. L. Zhou, J. Cryst. Growth, 2004, 17, 226–233 CrossRef.
- Z. Z. Dai, J. B. Yin, S. F. Yan, T. Cao, J. Ma and X. S. Chen, Polym. Int., 2007, 56, 1122–1127 CrossRef CAS.
- B. Cao, S. F. Yan, L. Cui, X. S. Chen and Y. T. Xie, Macromol. Biosci., 2011, 11, 427–434 CrossRef CAS PubMed.
- J. L. Hong, H. W. Choi, K. J. Kim and S. C. Lee, Chem. Mater., 2006, 18, 5111–5118 CrossRef.
- J. Zheng, X. J. Tian, Y. F. Sun, D. R. Lu and W. L. Yang, Int. J. Pharm., 2013, 450, 296–303 CrossRef CAS PubMed.
- J. Fang, Y. Zhang, S. Yan, Z. Liu, S. He, L. Cui and J. Yin, Acta Biomater., 2014, 10, 276–288 CrossRef CAS PubMed.
- S. Yan, K. Zhang, Z. Liu, X. Zhang, L. Gan, B. Cao, X. Chen, L. Cui and J. Yin, J. Mater. Chem. B, 2013, 1, 1541–1551 RSC.
- S. Park, J. Park, H. Kim, M. J. Song and H. Suh, Biomaterials, 2002, 23, 1205–1212 CrossRef CAS PubMed.
- M. J. B. Wissink, R. Beernink, J. S. Pieper, A. A. Poot, G. H. M. Engbers, T. Beugeling, W. G. Van-Aken and J. Feijen, Biomaterials, 2001, 22, 151–163 CrossRef CAS PubMed.
- Z. J. Song, J. B. Yin, K. Luo, Y. Z. Zheng, Y. Yang, Q. Li, S. F. Yan and X. S. Chen, Macromol. Biosci., 2009, 9, 268–278 CrossRef CAS PubMed.
- J. Xu, S. Strandman, J. X. Zhu, J. Barralet and M. Cerruti, Biomaterials, 2015, 37, 395–404 CrossRef CAS PubMed.
- C. Wang, C. He, Z. Tong, X. Liu, B. Ren and F. Zeng, Int. J. Pharm., 2006, 308, 160–167 CrossRef CAS PubMed.
- L. J. Shi and C. Berkland, Macromolecules, 2007, 40, 4635–4643 CrossRef CAS PubMed.
- E. Kokufuta, K. Ogawa, R. Doi, R. Kikuchi and R. S. Farinato, J. Phys. Chem. B, 2007, 111, 8634–8640 CrossRef CAS PubMed.
- W. M. Wan, X. L. Sun and C. Y. Pan, Macromolecules, 2009, 42, 4950–4952 CrossRef CAS.
- H. J. Dou, M. Jiang, H. S. Peng, D. Y. Chen and Y. Hong, Angew. Chem., Int. Ed., 2003, 42, 1516–1519 CrossRef CAS PubMed.
- C. Wu and S. Q. Zhou, Phys. Rev. Lett., 1996, 77, 3053–3055 CrossRef CAS PubMed.
- J. X. Gu, F. Xia, Y. Wu, X. Z. Qu, Z. Z. Yang and L. Jiang, J. Controlled Release, 2007, 117, 396–402 CrossRef CAS PubMed.
- Z. M. Xing, C. L. Wang, J. Yan, L. Zhang, L. Li and L. S. Zha, Soft Matter, 2011, 7, 7992–7997 RSC.
- W. T. Wu, J. Shen, P. Banerjee and S. Q. Zhou, Biomaterials, 2010, 31, 8371–8381 CrossRef CAS PubMed.
- C. K. S. Pillai, W. Paul and C. P. Sharma, Prog. Polym. Sci., 2009, 34, 641–678 CrossRef CAS.
- M. Enache and E. Volanschi, J. Pharm. Sci., 2011, 100, 558–565 CrossRef CAS PubMed.
- Y. Chen, X. Zheng, H. Qian, Z. Mao, D. Ding and X. Jiang, ACS Appl. Mater. Interfaces, 2010, 2, 3532–3538 CAS.
- Y. H. Ma, L. Zhou, H. Q. Zheng, L. Xing, C. G. Li, J. H. Cui and S. N. Che, J. Mater. Chem., 2011, 21, 9483–9486 RSC.
- T. B. Toh, D. K. Lee, W. Hou, L. N. Abdullah, J. Nguyen, D. Ho and E. K. H. Chow, Mol. Pharmaceutics, 2014, 11, 2683–2691 CrossRef CAS PubMed.
- Q. P. Duan, Y. Cao, Y. Li, X. Y. Hu, T. X. Xiao, C. Lin, Y. Pan and L. Y. Wang, J. Am. Chem. Soc., 2013, 135, 10542–10549 CrossRef CAS PubMed.
- D. C. Che, X. X. Zhu, H. Z. Wang, Y. R. Duan, Q. H. Zhang and Y. G. Li, J. Colloid Interface Sci., 2016, 463, 1–7 CrossRef CAS PubMed.
- P. H. Weigel and J. H. Yik, Biochim. Biophys. Acta, 2002, 1572, 341–363 CrossRef CAS.
- Y. T. Wang, S. S. Xu, W. F. Xiong, Y. Q. Pei, B. Li and Y. J. Chen, Colloids Surf., B, 2016, 146, 107–113 CrossRef CAS PubMed.
- P. F. Liu, H. Yu, Y. Sun, M. J. Zhu and Y. R. Duan, Biomaterials, 2012, 33, 4403–4412 CrossRef CAS PubMed.
| This journal is © The Royal Society of Chemistry 2017 |

