 Open Access Article
Creative Commons Attribution 3.0 Unported Licence
A fast track for the accurate determination of methoxyl and ethoxyl groups in lignin
Ivan Sumerskii*,
Thomas Zweckmair,
Hubert Hettegger,
Grigory Zinovyev,
Markus Bacher,
Thomas Rosenau and
Antje Potthast *
*
Division of Chemistry of Renewable Resources, Department of Chemistry, University of Natural Resources and Life Sciences, Konrad-Lorenz-Str. 24, A-3430 Tulln, Austria. E-mail: ivan.sumerskii@boku.ac.at; antje.potthast@boku.ac.at
First published on 26th April 2017
Abstract
A method based on headspace-isotope dilution (HS-ID) GC-MS for the quantitative analysis of methoxyl and ethoxyl groups in any kind of lignin has been developed. The method involves the application of an isotopically labeled internal standard (4-(methoxy-d3)-benzoic acid and 4-(ethoxy-d5)-benzoic acid), which, together with lignin, undergoes standard hydroiodic acid cleavage of methoxyl and ethoxyl groups, followed by headspace GC-MS analysis of the respective deuterated and non-deuterated iodomethanes and iodoethanes. As also the internal standard is generated in situ during ether cleavage, any variations in the procedure are levelled out. The application of the isotopically labeled internal standard essentially increased the robustness of the overall approach. The accuracy and precision of methoxyl and ethoxyl group quantification in lignins have been assessed, and the data were compared to the classical Zeisel–Vieböck–Schwappach method for methoxyl groups in lignins. The novel approach for methoxyl and ethoxyl group determination showed a more satisfactory precision, accuracy, and also a much higher sample throughput, with approximately 40 samples per day.
Introduction
Lignin is one of the most abundant renewable aromatic biopolymers, which is inevitably generated in large quantities in different industrial conversion processes of plant matter. The presence of vast amounts of lignin has recently triggered research in academia and industry in order to create commodities such as biofuels and bio-based chemicals, and also materials of higher value.Taking a considered view on possible lignin utilization, significant progress in fast lignin analytics is necessary before it becomes a versatile and widely used feedstock for future industries. In this regard, one of the key parameters of lignin is the content of methoxyl groups.
Methoxyl groups contained in lignin have been reported to act as a stabilizer for phenoxyl radicals formed during scavenging of free radicals.1–4 This phenomenon is closely connected to the antioxidant capacity of lignin, which has been the focus of many studies.1–4
Recently, plant methoxyl groups were discovered to have both distinct stable hydrogen and carbon isotope values upon which studies of environmental and paleoclimate processes can be based as well as investigations of the geographical origin and authenticity of biomaterials.5,6
Recent studies on β-O-4 bond cleavage of lignin model compounds during alkaline pulping processes have demonstrated distinctly accelerated reaction rates when methoxyl groups were present.7
Currently, many endeavors are devoted to lignin demethylation in order to increase the number of hydroxyl groups and thus to improve its overall reactivity in specific applications. Various chemical and biological approaches for demethylation have been proposed.8–10 With regard to analysis in most cases the authors avoided application of conventional methods for direct methoxyl group analysis which admittedly are rather tedious and time-consuming – and opted for rough estimation of the hydroxyl increase or methanol release according to spectroscopic or chromatographic methods.
Overall, reliable quantification of the methoxyl group content provides not only lignin structural information, but also indicates structural changes during processing or lignin modification, and can thus serve as an internal reference in the analysis of other lignin functional groups.11
Within ongoing developments of ethanol-based organosolv or related biorefinery approaches, the analysis of the ethoxyl group content in technical lignin plays an important role as well.12 Knowledge of their content offers opportunities to characterize and design the conditions of the overall process, or, for example, to serve as a marker in lignin value-added products. In contrast to methoxyl groups that are genuinely contained in native lignin, ethoxyl groups are mainly introduced by processing.
In investigations dealing with biomass lignin content is a fundamental parameter. Most common methods for lignin content analysis are acetyl bromide or Klason procedures.13,14 However, there are cases when the biomass undergoes multiple transformations, rendering those common methods inapplicable to correctly report the actual lignin content. This is the case for all processes that generate covalent bonding between lignin and secondary components, which can be carbohydrates, carbohydrate condensation products, or grafted polymers and copolymers.
Methoxyl groups' cleavage by the classical hydroiodic treatment15 and quantification by a subsequent GC measurement16 were recommended as an alternative approach for evaluating the lignin content in mulch17 and compost18 because of the high stability of methoxyls upon biodegradation. The lignin content was calculated based on the assumption that one methoxyl group corresponds to one 200 Da monolignol C6–C3 unit. The results were significantly more accurate compared to conventional approaches.13,14
During decades of lignin research, many approaches were proposed for quantitative methoxyl group determination. However, only few of the most trustworthy and reliable ones remained and are in use at present. They belong to so-called destructive wet chemistry methods, where methoxyl functional groups are cleaved off by an acid treatment and the analyte released is further quantified. Methods differ by the type of acid applied and by the technique of subsequent analyte determination. One of the most widely used methods proposed by Zeisel, Vieböck, and Schwappach involves the quantitative cleavage of the methoxyl groups with 57% aqueous hydroiodic acid, followed by the formation of volatile methyl iodide, which is distilled off and “trapped” in a bromine solution by its conversion to the respective iodic acid.19–22 By reaction with potassium iodide, the iodic acid is further converted to iodine, which is then analyzed by standard iodometric titration.22,23 The formation of six atoms of iodine for each methoxyl group allowed the method to possess a relatively high degree of accuracy. Although the method involves many steps in addition to the application of special custom-made gas-tight glassware and toxic chemicals, it became firmly entrenched in lignin research.1,24–27
Analysis of lignin content in acid and alkaline wood hydrolysates by means of lignin chlorination followed by GC-FID quantification of the methanol formed from methoxyl groups has been demonstrated to give more credible results compared to conventional methods.14 However, the overall error of this method was rather large at approximately 10%.
Aiming at expanding the frontiers of methoxyl group analysis, numerous attempts to utilize gas chromatography (GC) have been made. The most promising one suggested hydrolytic cleavage of methoxyl groups by refluxing lignin in concentrated sulfuric acid, followed by distillation of formed methanol and its GC-FID detection.28 This approach was further modified by the implementation of butanol as an internal standard.29 Despite the uncertainties with respect to method precision, accuracy, and reproducibility, which were not reported in literature, this method is still applied.30,31
A real pragmatic step toward method simplification and time saving has been done just recently: it was suggested to perform standard lignin demethylation with hydroiodic acid in a closed vial, injection of an internal standard (ethyl iodide) after the reaction and extraction of analytes with pentane or tetrachloromethane, followed by subsequent GC-FID analysis.16,18,32,33 This approach allowed researchers to achieve values similar to the titrimetric method at a comparably low relative standard deviation (RSD, 2.5%). It was adapted for the analysis of ethoxyl groups in lignin by application of propyl iodide as the internal standard.16 In order to minimize the number of steps in sample preparation – and hence to decrease possible errors caused by sample handling – a headspace (HS) GC-FID approach was suggested.15 The peculiarity of the method consisted in carrying out the demethylation reaction driven by hydroiodic acid and the analysis of released methyl iodide in the same headspace vial sealed with a septum. The authors suggested external standard calibration of the HS-GC-FID measurement and with that demonstrated decently low RSD (<0.69%) confirming similar values for selected lignins by the conventional titrimetric method.15 However, the suggested methodology, involving a neutralization step prior to GC analysis and thus side reactions of the analyte, raises doubts on the stability of the analyte generated and therefore on the accuracy and precision of the entire method.
Currently, the development of lignin characterization methods involving chemometry and hence statistical models is also of great importance. Aiming at predicting the methoxyl content in lignin, a simple empirical correlation based on lignin ultimate analysis has been developed according to multiple regression methods.23 Though the average absolute error of the proposed correlation was rather high (14%), it required only hydrogen and oxygen contents in lignin as inputs.
In light of recent developments, also spectroscopic, nondestructive methods for the analysis of methoxyl content are worth mentioning. Various FTIR34 and NMR4,35 approaches were proposed, but due to the complexity of lignins and certain instrument limitations, they could only give either a relative value or just a rough estimation of methoxyl group content.36 Over the last few decades, the development of 13C-NMR techniques, providing well-resolved spectra in which methoxyl group signals are not overlapped, and the application of appropriate non-overlapping internal standards have permitted facile integration and methoxyl group quantification.37 Further developments have led to significant decreases of experimental time38 and demonstrated a strong correlation with values determined by the conventional wet chemistry GC-FID approach.32 Nevertheless, the availability of NMR hardware, the necessity of high purity, and sufficient solubility of lignin samples in an appropriate solvent, as well as still rather long experimental time, do not allow considering these approaches as routine methods for simple methoxyl group content determination.
In order to generate a high-throughput and robust method, we have developed a new headspace-isotope dilution (HS-ID) GC-MS approach for methoxyl and ethoxyl group analysis involving the application of in situ-generated, isotopically labeled internal standards upon hydroiodic acid treatment. A fast-track protocol was developed to analyze various technical lignins, such as kraft, organosolv or lignosulfonates, in much shorter time than hitherto possible, while showing superior analytical figures of merit.
Experimental
Materials and chemicals
Ethyl 4-hydroxybenzoate, iodomethane-d3 (99.5 atom% D) iodoethane-d3 (99.5 atom% D), HI (57%), HCl, acetone, ethyl acetate, methanol, diethyl ether, sodium hydroxide, potassium carbonate, magnesium sulfate, and sodium bicarbonate were obtained from Sigma-Aldrich GmbH (Schnelldorf, Germany). Indulin AT lignin was from MeadWestvaco (Charlston, SC, USA). Other technical lignin samples were provided by collaboration partners. Lignin samples were purified in accordance with procedures described in the literature.27,36 Prior to all analyses, lignin samples were freeze-dried followed by vacuum oven drying at 40 °C until complete dryness.Ethyl 4-(methoxy-d3)-benzoate (1)
Ethyl 4-hydroxybenzoate (2.50 g, 15.0 mmol) was dissolved in dry acetone (50 mL), and K2CO3 (3.22 g, 23.3 mmol) was added upon constant stirring. CD3I (1.40 mL, 22.5 mmol) was added to the suspension, and the reaction mixture was allowed to stir for 48 h at RT. The progress of the reaction was controlled by TLC (hexane/EtOAc 7![[thin space (1/6-em)]](https://www.rsc.org/images/entities/char_2009.gif) :
:![[thin space (1/6-em)]](https://www.rsc.org/images/entities/char_2009.gif) 3 v/v). The white suspension was filtered, acetone was evaporated, and after dissolution in CH2Cl2, the product was washed with saturated aqueous NaHCO3 solution followed by water until the washings were neutral. After washing with saturated brine, the organic phase was dried over anhydrous MgSO4, filtered on a sintered glass filter with application of a weak vacuum, and evaporated to dryness. The crude product (transparent oil) was purified by flash column chromatography with hexane/EtOAc (7
3 v/v). The white suspension was filtered, acetone was evaporated, and after dissolution in CH2Cl2, the product was washed with saturated aqueous NaHCO3 solution followed by water until the washings were neutral. After washing with saturated brine, the organic phase was dried over anhydrous MgSO4, filtered on a sintered glass filter with application of a weak vacuum, and evaporated to dryness. The crude product (transparent oil) was purified by flash column chromatography with hexane/EtOAc (7![[thin space (1/6-em)]](https://www.rsc.org/images/entities/char_2009.gif) :
:![[thin space (1/6-em)]](https://www.rsc.org/images/entities/char_2009.gif) 3 v/v) as the isocratic eluent. Fractions containing the pure product were combined, filtered, and evaporated to dryness under reduced pressure. The evaporation procedure was repeated twice after the addition of CHCl3 (app. 10 mL) yield: 2.65 g of transparent oil (14.5 mmol, 97%). TLC (hexane/EtOAc 7
3 v/v) as the isocratic eluent. Fractions containing the pure product were combined, filtered, and evaporated to dryness under reduced pressure. The evaporation procedure was repeated twice after the addition of CHCl3 (app. 10 mL) yield: 2.65 g of transparent oil (14.5 mmol, 97%). TLC (hexane/EtOAc 7![[thin space (1/6-em)]](https://www.rsc.org/images/entities/char_2009.gif) :
:![[thin space (1/6-em)]](https://www.rsc.org/images/entities/char_2009.gif) 3 v/v): ethyl 4-hydroxybenzoate Rf = 0.43, ethyl 4-(methoxy-d3)benzoate Rf = 0.77; FTIR: 2982 (C–H), 1706 (C
3 v/v): ethyl 4-hydroxybenzoate Rf = 0.43, ethyl 4-(methoxy-d3)benzoate Rf = 0.77; FTIR: 2982 (C–H), 1706 (C![[double bond, length as m-dash]](https://www.rsc.org/images/entities/char_e001.gif) O), 1604, 1509, 1257, 1168, 1096, 769 cm−1; 1H NMR (400.13 MHz, CDCl3) δ = 8.01 (d, J = 9.0 Hz, 2H, CarH), 6.92 (d, J = 9.0 Hz, 2H, CarH), 4.35 (q, J = 7.2 Hz, 2H, CH2), 1.39 ppm (t, J = 7.2 Hz, 3H, CH3); 2H NMR (61.42 MHz, CDCl3) δ = 3.84 ppm (s, 3D, CD3); 13C NMR (100.61 MHz, CDCl3) δ = 166.4 (C
O), 1604, 1509, 1257, 1168, 1096, 769 cm−1; 1H NMR (400.13 MHz, CDCl3) δ = 8.01 (d, J = 9.0 Hz, 2H, CarH), 6.92 (d, J = 9.0 Hz, 2H, CarH), 4.35 (q, J = 7.2 Hz, 2H, CH2), 1.39 ppm (t, J = 7.2 Hz, 3H, CH3); 2H NMR (61.42 MHz, CDCl3) δ = 3.84 ppm (s, 3D, CD3); 13C NMR (100.61 MHz, CDCl3) δ = 166.4 (C![[double bond, length as m-dash]](https://www.rsc.org/images/entities/char_e001.gif) O), 163.2 (Cq–O), 131.5 (CarH), 122.9 (Cq), 113.5 (CarH), 60.6 (CH2), 54.6 (sept, J = 21.3 Hz, 3D, OCD3), 14.4 ppm (CH3); purity according to 1H NMR: 95%.
O), 163.2 (Cq–O), 131.5 (CarH), 122.9 (Cq), 113.5 (CarH), 60.6 (CH2), 54.6 (sept, J = 21.3 Hz, 3D, OCD3), 14.4 ppm (CH3); purity according to 1H NMR: 95%.
4-(Methoxy-d3)-benzoic acid (2)
Ethyl 4-(methoxy-d3)benzoate (2.50 g, 13.7 mmol) was dissolved in MeOH (20 mL), and a solution of NaOH (0.87 g, 21.8 mmol) in water (20 mL) was added. MeOH was added until complete dissolution of all reagents. The clear solution was stirred for 3 h at reflux conditions. The reaction mixture was diluted with cold distilled water (20 mL), cooled to 0 °C, and then acidified with concentrated HCl to approximately a pH of 2. The product immediately precipitated as a white solid. The solid was filtered and washed with cold distilled water until the washings were neutral. The product was then lyophilized. Yield: 1.91 g of a white solid (12.3 mmol, 90%). TLC (DCM/EtOH 8![[thin space (1/6-em)]](https://www.rsc.org/images/entities/char_2009.gif) :
:![[thin space (1/6-em)]](https://www.rsc.org/images/entities/char_2009.gif) 1 v/v): 4-methoxybenzoic acid-d3 Rf = 0.79; FTIR: 3500–2000 (O–H), 1675 (C
1 v/v): 4-methoxybenzoic acid-d3 Rf = 0.79; FTIR: 3500–2000 (O–H), 1675 (C![[double bond, length as m-dash]](https://www.rsc.org/images/entities/char_e001.gif) O), 1601, 1575, 1513, 1429, 1299, 1270 cm−1; 1H NMR (400.13 MHz, DMSO-d6) δ = 12.54 (br. s, 1H, COOH), 7.88 (d, J = 8.6 Hz, 2H, CarH), 6.99 ppm (d, J = 8.9 Hz, 2H, CarH); 2H NMR (61.42 MHz, DMSO-d6) δ = 3.77 ppm (s, 3D, CD3); 13C NMR (100.61 MHz, DMSO-d6) δ = 167.2 (C
O), 1601, 1575, 1513, 1429, 1299, 1270 cm−1; 1H NMR (400.13 MHz, DMSO-d6) δ = 12.54 (br. s, 1H, COOH), 7.88 (d, J = 8.6 Hz, 2H, CarH), 6.99 ppm (d, J = 8.9 Hz, 2H, CarH); 2H NMR (61.42 MHz, DMSO-d6) δ = 3.77 ppm (s, 3D, CD3); 13C NMR (100.61 MHz, DMSO-d6) δ = 167.2 (C![[double bond, length as m-dash]](https://www.rsc.org/images/entities/char_e001.gif) O), 163.0 (Cq–O), 131.5 (CarH), 123.2 (Cq), 114.0 ppm (CarH), n.d. (OCD3); ESI-MS (8 ppm in MeOH, positive ionization mode): 156.0 m/z ([M + H]+, C8H6D3O3); melting point: 184–186 °C (water); purity according to 1H-NMR: 99%.
O), 163.0 (Cq–O), 131.5 (CarH), 123.2 (Cq), 114.0 ppm (CarH), n.d. (OCD3); ESI-MS (8 ppm in MeOH, positive ionization mode): 156.0 m/z ([M + H]+, C8H6D3O3); melting point: 184–186 °C (water); purity according to 1H-NMR: 99%.
Ethyl 4-(ethoxy-d5)-benzoate (3)
Ethyl 4-(ethoxy-d5)benzoate was synthesized according to the procedure described for compound (1). TLC (hexane/EtOAc 7![[thin space (1/6-em)]](https://www.rsc.org/images/entities/char_2009.gif) :
:![[thin space (1/6-em)]](https://www.rsc.org/images/entities/char_2009.gif) 3): ethyl 4-hydroxybenzoate Rf = 0.43, ethyl 4-(ethoxy-d5)-benzoate Rf = 0.80; FTIR: 1707 (C
3): ethyl 4-hydroxybenzoate Rf = 0.43, ethyl 4-(ethoxy-d5)-benzoate Rf = 0.80; FTIR: 1707 (C![[double bond, length as m-dash]](https://www.rsc.org/images/entities/char_e001.gif) O), 1605, 1508, 1255, 1167, 1097, 846, 769, 696 cm−1; 1H NMR (400.13 MHz, CDCl3) δ = 7.99 (dt, J = 8.9, 2.5 Hz, 2H, CarH), 6.90 (dt, J = 8.9, 2.5 Hz, 2H, CarH), 4.35 (q, J = 7.1 Hz, 2H, CH2), 1.38 ppm (t, J = 7.1 Hz, 3H, CH3); 2H NMR (61.42 MHz, CDCl3) δ = 4.06 (s, 2D, CD2), 1.39 ppm (s, 3D, CD3); 13C NMR (100.61 MHz, CDCl3) δ = 166.4 (C
O), 1605, 1508, 1255, 1167, 1097, 846, 769, 696 cm−1; 1H NMR (400.13 MHz, CDCl3) δ = 7.99 (dt, J = 8.9, 2.5 Hz, 2H, CarH), 6.90 (dt, J = 8.9, 2.5 Hz, 2H, CarH), 4.35 (q, J = 7.1 Hz, 2H, CH2), 1.38 ppm (t, J = 7.1 Hz, 3H, CH3); 2H NMR (61.42 MHz, CDCl3) δ = 4.06 (s, 2D, CD2), 1.39 ppm (s, 3D, CD3); 13C NMR (100.61 MHz, CDCl3) δ = 166.4 (C![[double bond, length as m-dash]](https://www.rsc.org/images/entities/char_e001.gif) O), 162.7 (Cq–O), 131.5 (CarH), 122.7 (Cq), 114.0 (CarH), 60.6 (CH2), n.d. (CD2), 14.4 ppm (CH3), n.d. (CD3); purity according to 1H NMR: 98%.
O), 162.7 (Cq–O), 131.5 (CarH), 122.7 (Cq), 114.0 (CarH), 60.6 (CH2), n.d. (CD2), 14.4 ppm (CH3), n.d. (CD3); purity according to 1H NMR: 98%.
4-(Ethoxy-d5)benzoic acid (4)
4-(Ethoxy-d5)benzoic acid was synthesized according to the procedure described for compound (2). TLC (DCM/MeOH 5![[thin space (1/6-em)]](https://www.rsc.org/images/entities/char_2009.gif) :
:![[thin space (1/6-em)]](https://www.rsc.org/images/entities/char_2009.gif) 1): 4-(ethoxy-d5)benzoic acid Rf = 0.72; FTIR: 3200–2300 (O–H), 1668 (C
1): 4-(ethoxy-d5)benzoic acid Rf = 0.72; FTIR: 3200–2300 (O–H), 1668 (C![[double bond, length as m-dash]](https://www.rsc.org/images/entities/char_e001.gif) O), 1605, 1432, 1300, 1268, 1175, 1100, 988, 932, 848, 772, 620 cm−1; 1H-NMR (400.13 MHz, DMSO-d6) δ = 7.87 (d, J = 9.0 Hz, 2H, CarH), 6.97 ppm (d, J = 9.0 Hz, 2H, CarH); 2H-NMR (61.42 MHz, DMSO-d6) δ = 4.04 (s, 2D, CD2), 1.29 ppm (s, 3D, CD3);13C-NMR (100.61 MHz, DMSO-d6) δ = 166.9 (C
O), 1605, 1432, 1300, 1268, 1175, 1100, 988, 932, 848, 772, 620 cm−1; 1H-NMR (400.13 MHz, DMSO-d6) δ = 7.87 (d, J = 9.0 Hz, 2H, CarH), 6.97 ppm (d, J = 9.0 Hz, 2H, CarH); 2H-NMR (61.42 MHz, DMSO-d6) δ = 4.04 (s, 2D, CD2), 1.29 ppm (s, 3D, CD3);13C-NMR (100.61 MHz, DMSO-d6) δ = 166.9 (C![[double bond, length as m-dash]](https://www.rsc.org/images/entities/char_e001.gif) O), 162.1 (Cq–O), 131.2 (CarH), 122.7 (Cq), 114.0 ppm (CarH), n.d. (CD2), n.d. (CD3); melting point: 197–199 °C (water); purity according to 1H NMR: 99%.
O), 162.1 (Cq–O), 131.2 (CarH), 122.7 (Cq), 114.0 ppm (CarH), n.d. (CD2), n.d. (CD3); melting point: 197–199 °C (water); purity according to 1H NMR: 99%.
HI acid treatment and sample preparation
Approximately 1 mL of HI acid (57%) was added to a 10 mL headspace screw cap vial (ND18 magnetic, Bruckner Analysentechnik, Linz, Austria) containing the lignin sample (5–10 mg), internal standards 4-(methoxy-d3)-benzoic acid (4–5 mg) and 4-(ethoxy-d5)-benzoic acid (2–3 mg), and a small magnetic stirring bar. The vials were tightly closed with screw caps equipped with PTFE-covered silicon septa (1.3 mm; Bruckner Analysentechnik, Linz, Austria) and placed in a heating/stirring module (Pierce Reacti-Therm III) for 3 h at 110 °C. Subsequently, the vials were cooled to room temperature, and 4 mL of water were injected through the septa. In experiments on the pH-dependent stability of analytes, in which excess HI was partially or completely neutralized, 4 mL of 1.1 or 2.2 M NaOH were injected. Thus, the volume of the liquid phase in all experiments was adjusted to approximately half of the total vial volume. This decreased the phase ratio and, together with heating of the vials in the headspace sampler, enriched the headspace with volatile analytes.Headspace GC-MS
GC-MS analysis was carried out on an Agilent 6890N gas chromatograph coupled to an Agilent 5975B inert XL mass selective detector (MSD). The GC was equipped with a split/splitless inlet and DB5-ms column (30 m × 0.25 mm i.d. × 0.25 μm film thickness; J&W Scientific, Folsom, CA, USA). The split/splitless inlet operated under the following conditions: constant column flow: 1.0 mL min−1 using helium carrier gas, split-ratio: 1![[thin space (1/6-em)]](https://www.rsc.org/images/entities/char_2009.gif) :
:![[thin space (1/6-em)]](https://www.rsc.org/images/entities/char_2009.gif) 50; injector: 250 °C. Oven temperature gradient profile: 40 °C (2 min), 10 °C min−1 to 150 °C (3 min) and back to initial values. The MSD was operated in EI mode at 70 eV ionization energy and 1.13 × 10⁻⁷ Pa. Ion source temperature: 230 °C, quadrupole: 150 °C, transfer line: 280 °C. The data were acquired in SIM mode at 50 ms dwell time for each ion group. A closed loop headspace sampler (Agilent Technologies 7697A equipped with a 20 μL loop) was used for injection. The sampler operated under the following conditions: vial temperature: 50 °C, loop temperature: 60 °C, transfer line temperature: 70 °C; vial equilibration time: 3 min, vial pressurization time: 0.2 min, loop fill time: 0.18 min, loop equilibration time: 0.05 min, injection time: 1 min.
50; injector: 250 °C. Oven temperature gradient profile: 40 °C (2 min), 10 °C min−1 to 150 °C (3 min) and back to initial values. The MSD was operated in EI mode at 70 eV ionization energy and 1.13 × 10⁻⁷ Pa. Ion source temperature: 230 °C, quadrupole: 150 °C, transfer line: 280 °C. The data were acquired in SIM mode at 50 ms dwell time for each ion group. A closed loop headspace sampler (Agilent Technologies 7697A equipped with a 20 μL loop) was used for injection. The sampler operated under the following conditions: vial temperature: 50 °C, loop temperature: 60 °C, transfer line temperature: 70 °C; vial equilibration time: 3 min, vial pressurization time: 0.2 min, loop fill time: 0.18 min, loop equilibration time: 0.05 min, injection time: 1 min.
Calibration of the headspace GC-MS method
Calibration of the HS-GC-MS method was performed by adding various amounts of vanillin (1–7 mg; 10 data points) and 4-ethoxybenzoic acid (0.05–3 mg; 10 data points) into a set of headspace vials containing known amounts (∼4 and 2 mg) of the internal standards (2) and (4), respectively, and then subjecting them to HI acid treatment (see above). The GC-MS response ratios of methyl and ethyl iodides and deuterated methyl and ethyl iodides were plotted against concentration ratios.Zeisel–Vieböck–Schwappach method
Determination of methoxyl groups was done by the Zeisel–Vieböck–Schwappach procedure described in the literature for comparison.22 A known amount of lignin (15–20 mg) was weighed directly into a round-bottom 25 mL reaction flask; 300–350 mg of phenol and 4 mL of 57% HI were added, and the flask was attached to the custom-made apparatus. All the ground glass joints were properly sealed with PTFE O-rings (Glindemann, Sigma-Aldrich, Austria). During the reaction of lignin with HI (1.5 h), the released methyl iodide was transferred by a flow of N2 carrier gas through the scavenger containing 1% of red phosphorous into the Vieböck–Schwappach apparatus filled with bromine solution. Released iodine was determined by titration with sodium thiosulfate solution (0.05 M).Results and discussion
The developed HS-ID GC-MS method uses the standard HI cleavage procedure22 as a starting point. Appropriate isotopically labeled internal standards are generated in situ upon hydroiodic acid treatment of their corresponding precursors, 4-(methoxy-d3)-benzoic acid (2) and 4-(ethoxy-d5)-benzoic acid (4).4-(Methoxy-d3)-benzoic acid (2), the actual component used for in situ generation of iodomethane-d3, was synthesized from ethyl 4-(methoxy-d3)-benzoate (1) by simple alkaline ester cleavage and re-acidification (Fig. 1). 1, in turn, was obtained by alkylation of the phenolic hydroxyl of ethylparaben with deuterated iodomethane in potassium carbonate/acetone (Claisen conditions). 4-(Ethoxy-d5)-benzoic acid (4) was synthesized analogously. The structures of the intermediates and the final products were confirmed by FTIR and NMR.
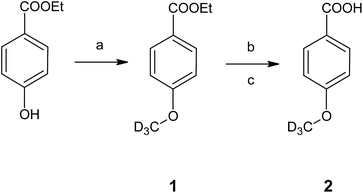 | ||
| Fig. 1 Synthesis of the internal standard 4-(methoxy-d3)-benzoic acid (2). Conditions: (a) CD3I, K2CO3, acetone, RT, 48 h; (b) NaOH, MeOH, H2O, reflux, 3 h; (c) HCl, H2O. | ||
As reported earlier, quantitative cleavage of methoxyl groups in lignins can be achieved by heating 10–20 mg of samples in 0.5 mL of HI (57%) at 130–140 °C for 30 min.25 In this study, we have applied those established conditions with minor changes. The volume of HI was increased to 1 mL in order to enhance method robustness, so that methoxyls and ethoxyls of completely unknown lignin samples – which might contain, for example, high amounts of impurities or acid quenchers – would still be quantitatively cleaved. Besides this, excess amounts of HI improve homogenization of the reactants and thus lower the probability of non-reacted matter being left over.
The sample amount applied in the method was set to about 5–10 mg, which is sufficient for the analysis and at the same time large enough for accurate weighing. The parameters of the HS-GC-MS analysis, such as HS loop size, GC split ratio, temperature, and time program, were optimized by experiments with vanillin as the source of methoxy groups to be split off (cf. Fig. 2).
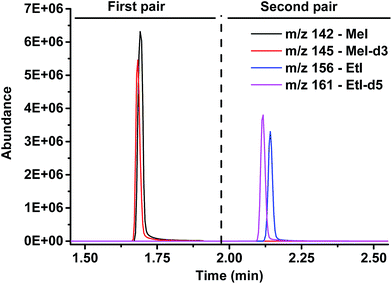 | ||
| Fig. 2 Chromatogram: separation of both analytes, methyl iodide and ethyl iodide, and detection of the natural and isotopically labeled counterparts. | ||
As the standards undergo the same cleavage reaction as the actual analyte samples, any variations in the cleavage procedure are corrected for. In the subsequent HS-GC-MS analysis, the methyl and ethyl iodides and the respective deuterated compounds are separated and detected in SIM mode. Two time windows with pairs of m/z-values (monoisotopic and isotopically labeled) were defined: 0–1.9 and 1.9–3.5 min as well as m/z 142/145 and 156/161, respectively, to detect iodomethanes and iodoethanes (Fig. 2).
Even though the application of the in situ-generated, isotopically labeled internal standard levels out all possible measurement errors, such as analyte leakage through the septa with resulting loss of alkyl iodides, it is still strongly recommended—due to the high toxicity of alkyl halides—to ensure that headspace vials are tightly closed. Additionally, it is important that the applied septa do not degrade and produce artifact signals in the chromatogram. Therefore, several types of septa (different thicknesses, silicone, and cover types) were tested. Silicon PTFE-covered septa were found to be the most stable and reliable. The 3 mm septa of the crimp cap could easily withstand the vapor pressure generated at the cleavage temperature of 130 °C.21,22,30 As a next step, screw caps with headspace vials were implemented in order to allow an automated methoxyl group determination by robot derivatization. However, 130 °C was too high for the 1.3 mm septa applied in screw caps. Therefore, lower temperatures of HI acid treatment were tested. At 110 °C, the 1.3 mm septa remain stable and do not give additional peaks in the chromatogram.
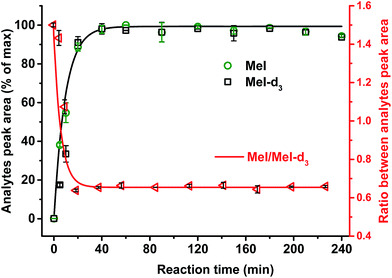
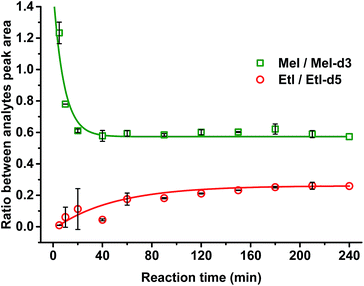
It was confirmed that a time of 60 min was sufficient for complete cleavage of methoxyl groups present in both isolated, purified kraft lignins and in lignosulfonates as well as in organosolv lignin (Fig. 3). The ratio between deuterated and non-deuterated methyl iodide generated in all cases remains stable after 30 min reaction time (Fig. 3). However, in the case of organosolv lignin, complete cleavage of ethoxyl groups and stabilization of the ratio between the corresponding ethyl iodide and deuterated ethyl iodide required 3 h (Fig. 4). Since longer reaction times did not affect the methyl iodide yield and its ratio of analyte to internal standard, it was decided to establish the universal method for any kind of lignin with an HI treatment for 3 h.
Precision and accuracy
The precision of the new method was investigated by quintuplicate independent analysis of methyl and ethyl iodide released from vanillin and 4-ethoxybenzoic acid, respectively. The RSD was evaluated at the lower, middle, and higher ends of the calibration curves.It was confirmed that the precision of the analysis of methoxyl and ethoxyl groups was decently high, and that the RSD for both functional groups did not exceed 3% over the whole calibration curve (Table 1). The limit of detection (LOD) and limit of quantification (LOQ) of compounds were calculated according to the 3σ and 10σ criteria, i.e., the threefold or tenfold standard deviation of the noise quantified by single point height calibration.39
| Internal standard | Analyte | m/z | R2, 2nd order polynom | Calibrated range, mmola | LOD, mmol | LOQ, mmol | RSD (n = 5), % | ||
|---|---|---|---|---|---|---|---|---|---|
| Lower end | Middle | Upper end | |||||||
| a Considering LOQ and the highest standard calibrated. | |||||||||
| 4-Methoxy-benzoic acid-d3 | 145 | ||||||||
| Methoxyl- | 142 | 0.999 | 0.71 × 10⁻³ to 45.0 × 10⁻³ | 0.21 × 10⁻³ | 0.71 × 10⁻³ | 2.56 | 0.59 | 2.08 | |
| 4-Ethoxy-benzoic acid-d3 | 161 | ||||||||
| Ethoxyl- | 156 | 1.000 | 0.42 × 10⁻³ to 17.4 × 10⁻³ | 0.13 × 10⁻³ | 0.42 × 10⁻³ | 1.83 | 2.04 | 1.15 | |
The accuracy of the methoxyl and ethoxyl groups content in technical lignins was evaluated by spiking known amounts of vanillin and 4-ethoxybenzoic acid into known amounts of a sample matrix. The kraft lignin, lignosulfonate (both before and after purification), and organosolv lignin yielded a methyl and ethyl iodide recovery in the range of 99.6–103.7% (Table 2).
| Lignin sample | Accuracy, % |
|---|---|
| Kraft | |
| Purified (1) | 99.64 |
| Non purified (1) | 103.76 |
| Purified (2) | 101.77 |
| Non purified (2) | 103.63 |
| Indulin AT | 101.89 |
![[thin space (1/6-em)]](https://www.rsc.org/images/entities/char_2009.gif) |
|
| Lignosulfonate | |
| Purified | 101.35 |
| Non purified | 100.55 |
![[thin space (1/6-em)]](https://www.rsc.org/images/entities/char_2009.gif) |
|
| Organosolv | |
| OMe | 103.74 |
| OEt | 100.99 |
The optimized HS-ID GC-MS method was tested on various technical lignins, in particular kraft, organosolv, lignosulfonates, hydrolysis lignins, and lignins after chemical modifications. The present HS-ID GC-MS method, compared to the conventional titrimetric method, provides methoxyl group contents with lower RSD (Table 3).
| Lignin sample | Headspace-isotope dilution GC-MS | Zeisel–Vieböck–Schwappach | ||||
|---|---|---|---|---|---|---|
| OMe, mmol g−1 | RSD (n = 3), % | OEt, mmol g−1 | RSD (n = 3), % | OMea, mmol g−1 | RSD (n = 5), % | |
| a Due to low method selectivity, i.e., inability to distinguish methoxyl and ethoxyl groups, these numbers are overestimated for ethoxyl-containing lignins. | ||||||
| 1 | 4.43 | 0.71 | — | — | 4.24 | 3.43 |
| 2 | 6.33 | 0.63 | — | — | 6.20 | 1.70 |
| 3 | 5.13 | 2.51 | 0.46 | 1.67 | 5.30 | 2.22 |
| 4 | 3.28 | 1.93 | — | — | 3.20 | 0.68 |
| 5 | 3.78 | 0.63 | 1.45 | 0.53 | 4.42 | 3.31 |
| 6 | 3.66 | 0.83 | — | — | 3.77 | 6.79 |
| 7 | 4.27 | 1.39 | — | — | 4.59 | 4.74 |
| 8 | 4.47 | 1.28 | — | — | 4.43 | 3.99 |
| 9 | 4.00 | 1.01 | 0.17 | 2.05 | 4.18 | 2.93 |
| 10 | 5.91 | 2.43 | — | — | 5.70 | 1.66 |
| 11 | 4.17 | 0.06 | 0.48 | 1.07 | 4.47 | 0.43 |
| 12 | 4.43 | 3.13 | 0.25 | 1.98 | 4.65 | 2.06 |
| 13 | 4.14 | 2.97 | 0.21 | 0.89 | 4.74 | 5.05 |
| 14 | 4.44 | 3.74 | 0.44 | 2.46 | 4.75 | 3.69 |
| 15 | 4.40 | 0.99 | 0.50 | 5.24 | 4.65 | 0.18 |
 |
1.62 | 1.99 | 2.86 | |||
Comparison of the methoxyl group content determined by HS-ID GC-MS and the Zeisel–Vieböck–Schwappach method showed the latter to overestimate in some cases (Table 3). As was shown by the HS-ID GC-MS method, those samples also contained additional ethoxyl groups.
When comparing the sum of methoxyl and ethoxyl groups obtained by HS-ID GC-MS and values attained by the Zeisel–Vieböck–Schwappach method, good agreement was found (Fig. 5). However, for some lignins, such as sample 5 (Table 3 and Fig. 5), containing relatively higher numbers of ethoxyl groups, the conventional method was not able to provide correct numbers for either methoxyl or ethoxyl contents (Fig. 5). This phenomenon can be explained by the fact that the HI treatment step in the titrimetric method was optimized only for the quantitative cleavage of methoxyl groups present in lignin, and, therefore, ethoxyl groups were cleaved only partially.
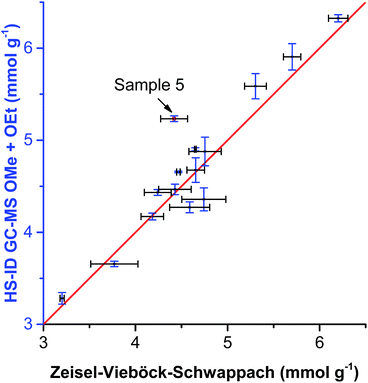 | ||
| Fig. 5 Comparison of OMe group content analyzed by HS-ID GC-MS vs. the Zeisel–Vieböck–Schwappach method. | ||
Robustness and stability
In order to evaluate the overall robustness of the method, the influence of variations of method parameters, such as the application of different headspace vials closed with screw or crimp caps, the pH of the reaction medium after methoxyl and ethoxyl group cleavage, time, and temperature of samples storage, etc., were carefully investigated.The application of different headspace vials with screw or crimp caps, together with the aforementioned different temperatures in the HI cleavage step, had no noticeable effect on the precision and accuracy of methoxyl group determination.
Several Indulin AT lignin samples prepared for the HS-ID GC-MS analysis were subject to additional heating at 50 °C and freezing at −80 °C for 24 h after hydroiodic acid treatment. Further analysis did not reveal any noticeable difference in the methoxyl group content and RSD compared to samples measured directly after the cleavage step.
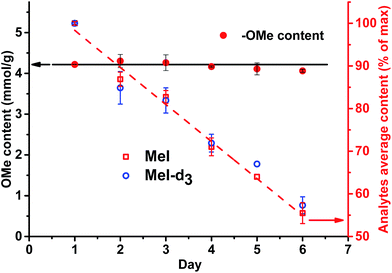
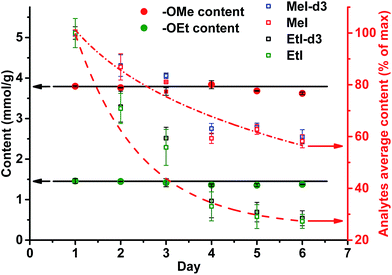
A different outcome was observed in case of pH variation in the reaction medium after HI cleavage with respect to the stability of the analytes generated. Three sets of experiments with six different lignins (two parallel repetitions each) were conducted. The residual hydroiodic acid after the cleavage process was either left as is or was partially or completely neutralized with NaOH solution, as recommended in the literature.15 In all three cases, the analytes generated were degrading with time apart from slow migration through the sample cap (Fig. 6 and 7). It was obvious that the degradation of the alkyl halides was caused by simple SN2 nucleophilic substitution by a hydroxyl ions when partial or complete HI neutralization was applied.40
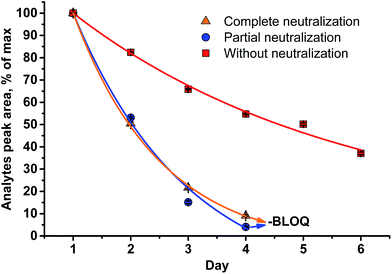 | ||
| Fig. 6 Stability of the analytes (MeI/MeI-d3) generated in the reaction medium upon standing for six d at RT (LOQ = limit of quantification). | ||
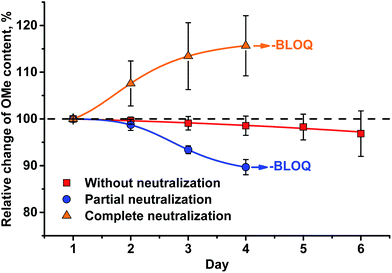 | ||
| Fig. 7 Change of HS-ID GC-MS methoxyl group quantification when analytes (MeI/MeI-d3) remain in the test vials upon standing for six d at RT. | ||
Application of complete or even partial neutralization of excess HI caused a steep decrease in analyte concentration. After 4 d, their concentration reached the limit of quantification of the HS-ID GC-MS method. In addition, also the deuterated/non-deuterated peak area ratio was affected (Fig. 7). In case of complete neutralization, the isotopically labeled methyl iodide degraded faster than the non-deuterated one, showing a clear reverse isotope effect. Hence, due to the different degradation speeds, the peak ratio cannot be used to level out differences induced by the side reaction caused by neutralization (Fig. 7). Partial neutralization did not affect the methoxyl/ethoxyl ratios, but, probably due to the gradual decrease of the analytes' concentrations, accuracy and precision of the HS-ID GC-MS quantification dropped (Fig. 7).
Only in case of non-neutralized HI was the degradation of analytes comparatively slow, and the ratio between them (MeI/MeI-d3 and EtI/EtI-d5) remained satisfyingly stable (Fig. 8 and 9), thus causing only minor influence on accuracy and precision. Over 6 d, the average relative change of methoxyl and ethoxyl group content determined in case of kraft, lignosulfonate, and organosolv lignins decreased by just 3–4%, and the average RSDs did not exceed 3% (Fig. 8 and 9).
Based on these tests, a neutralization as recommended in the literature15 will definitely lead to erroneous results. This is especially important when larger numbers of samples are analyzed subsequently and hence remain waiting in an autosampler for different times. The solution must remain non-neutralized at acidic pH prior to injection, otherwise not even the isotopically labeled standard is able to correct for the degradation.
Corrosion of the headspace sampler transfer line due to HI remaining in the samples—as stated in the literature15—or other possible damages to the headspace sampler and GC-MS instrument components were not confirmed or did not pose a problem. The robustness of the HS-ID GC-MS method proposed involving cleavage of methoxyl and ethoxyl groups without further neutralization of remaining HI was confirmed. A precise and accurate measurement of samples was performed over a sufficiently long period. However, the best results are obtained within 2 d after HI treatment, which is plenty of time to complete the analysis, e.g., of a whole sample rack with 111 vials.
Conclusions
A new headspace-isotope dilution (HS-ID) GC-MS method for the analysis of methoxyl and ethoxyl groups in any type of lignin, including isolated, purified, and non-purified lignins, has been developed, optimized, and tested on model compounds and on a range of different technical lignins. The method is distinguished from previous approaches by the application of isotopically labelled internal standards, in particular 4-(methoxy-d3)-benzoic acid and 4-(ethoxy-d5)-benzoic acid, allowing for significantly reduced measurement errors and thus largely increasing the robustness of the overall analysis.By varying method parameters, such as application of different caps for proper sealing, time, and temperature of sample storage among others, we have validated the HS-ID GC-MS method and confirmed its analytical advantages. Independent of the sample matrix, the new method showed higher precision, better accuracy and improved selectivity compared to the conventional titrimetric Zeisel–Vieböck–Schwappach variant. Most notably, it allowed for a much higher sample throughput. Due to the optimized chemical steps that can be performed relatively fast in an automated way, the actual GC-MS analysis might become the bottleneck of the whole analytical method, because of the temperature program and because of cooling and temperature stabilization of the GC oven between individual runs. However, the latter step can be shortened, for example, by performing oven cryo-cooling. Including all preparation steps, the present approach allowed us to run at least 40 samples per day.
The application of a neutralization step to get rid of excess HI – after methoxyl and ethoxyl group cleavage and before the actual HS-GC-MS analysis, as recommended in the literature, was shown to be detrimental regarding the stability of the analytes and internal standards generated in situ. Only when HI was not neutralized, analyte and standard degradation was acceptably low and the ratio between labelled standard and sample remained stable, allowing a precise and accurate methoxyl and ethoxyl quantification even after 6 d of storage. This confirmed that even a high number of HI-treated samples, requiring several days of chromatographic measurement, can be safely analyzed with the new approach.
Overall, it was demonstrated that the developed HS-ID GC-MS method is very reliable, i.e., having fewer factors influencing methoxyl and ethoxyl group quantification in comparison to the conventional titrimetric Zeisel–Vieböck–Schwappach method, and also to published HS GC-MS approaches. On a routine basis, the number of parallel measurements to achieve fully robust values was two to three repetitions, while in case of the titrimetric approach, the number required was four to six.
The analytical approach opens new possibilities to quickly and accurately characterize lignin with regard to the important parameter of methoxyl group content (and ethoxyl group content for special lignins). It is applicable to all types of lignin and is able to cope with large sample amounts without trade-off in quality – a property that hitherto available approaches lack.
The simultaneous quantitative analysis of ethoxy groups – besides the “usual” methoxy group analysis – is an additional benefit that proves beneficial when ethanol-based biorefinery concepts are dealt with.
Acknowledgements
We gratefully acknowledge the FLIPPR° project, supported by the Austrian Research Promotion Agency, FFG, and the associated companies SAPPI, MONDI, Heinzel Pulp, and Norske Skog, for the financial support of the work.References
- J. Ponomarenko, M. Lauberts, T. Dizhbite, L. Lauberte, V. Jurkjane and G. Telysheva, Holzforschung, 2015, 69, 795–805 CrossRef CAS.
- R. Y. Nsimba, N. West and A. A. Boateng, J. Agric. Food Chem., 2012, 60, 12525–12530 CrossRef CAS PubMed.
- J. L. Espinoza-Acosta, P. I. Torres-Chavez, B. Ramirez-Wong, C. M. Lopez-Saiz and B. Montano-Leyva, BioResources, 2016, 11, 5452–5481 CrossRef.
- X. J. Pan, J. F. Kadla, K. Ehara, N. Gilkes and J. N. Saddler, J. Agric. Food Chem., 2006, 54, 5806–5813 CrossRef CAS PubMed.
- M. Greule and F. Keppler, Isot. Environ. Health Stud., 2011, 47, 470–482 CrossRef CAS PubMed.
- Y. Gori, R. Wehrens, M. Greule, F. Keppler, L. Ziller, N. La Porta and F. Camin, Rapid Commun. Mass Spectrom., 2013, 27, 265–275 CrossRef CAS PubMed.
- S. Shimizu, T. Yokoyama and Y. Matsumoto, J. Wood Sci., 2015, 61, 529–536 CrossRef CAS.
- I. Bashtan-Kandybovich, B. Venkatesagowda, A. M. Barbosa, L. Malek and R. F. H. Dekker, J-FOR, 2012, 2, 16–27 Search PubMed.
- L. Y. Zou, B. M. Ross, L. J. Hutchison, L. P. Christopher, R. F. H. Dekker and L. Malek, Enzyme Microb. Technol., 2015, 73–74, 44–50 CrossRef CAS PubMed.
- L. H. Hu, H. Pan, Y. H. Zhou, C. Y. Hse, C. G. Liu, B. F. Zhang and B. Xu, J. Wood Chem. Technol., 2014, 34, 122–134 CrossRef CAS.
- J. L. Wen, S. L. Sun, B. L. Xue and R. C. Sun, Materials, 2013, 6, 359–391 CrossRef CAS.
- R. A. Young and M. Akhtar, Environmentally Friendly Technologies for the Pulp and Paper Industry, Wiley, 1998 Search PubMed.
- K. Iiyama and A. F. A. Wallis, Wood Sci. Technol., 1988, 22, 271–280 CrossRef CAS.
- P. Parasuraman, R. Singh, T. S. Bolton, S. Omori and R. C. Francis, BioResources, 2007, 2, 459–471 CAS.
- H. L. Li, X. S. Chai, M. R. Liu and Y. H. Deng, J. Agric. Food Chem., 2012, 60, 5307–5310 CrossRef CAS PubMed.
- S. M. Baker, Holzforschung, 1996, 50, 573–574 CAS.
- Z. F. Jin, T. Akiyama, B. Y. Chung, Y. Matsumoto, K. Iiyama and S. Watanabe, Phytochemistry, 2003, 64, 1023–1031 CrossRef CAS PubMed.
- O. Bikovens, G. Telysheva and K. Iiyama, Chem. Ecol., 2010, 26, 67–75 CrossRef CAS.
- S. Zeisel, Monatshefte für Chemie und verwandte Teile anderer Wissenschaften, 1885, 6, 989–997 CrossRef.
- F. Vieböck and A. Schwappach, Berichte der deutschen chemischen Gesellschaft (A and B Series), 1930, 63, 2818–2823 CrossRef.
- C.-L. Chen, in Methods in Lignin Chemistry, ed. S. Y. Lin and C. W. Dence, Springer Berlin Heidelberg, Berlin, Heidelberg, 1992, pp. 465–472, DOI:10.1007/978-3-642-74065-7_32.
- G. F. Zakis, Functional analysis of lignin and their derivatives, Tappi Press, Atlanta, Georgia, 1994 Search PubMed.
- M. Jablonsky, M. Botkova and J. Adamovska, Cellul. Chem. Technol., 2015, 49, 165–168 CAS.
- R. Lehnen, B. Saake and H. H. Nimz, Holzforschung, 2002, 56, 498–506 CrossRef CAS.
- C. Rossberg, M. Bremer, S. Machill, S. Koenig, G. Kerns, C. Boeriu, E. Windeisen and S. Fischer, Ind. Crops Prod., 2015, 73, 81–89 CrossRef CAS.
- M. Alekhina, J. Erdmann, A. Ebert, A. M. Stepan and H. Sixta, J. Mater. Sci., 2015, 50, 6395–6406 CrossRef CAS.
- I. Sumerskii, P. Korntner, G. Zinovyev, T. Rosenau and A. Potthast, RSC Adv., 2015, 5, 92732–92742 RSC.
- D. T. Balogh, A. A. S. Curvelo and R. A. M. C. Degroote, Holzforschung, 1992, 46, 343–348 CrossRef CAS.
- G. Vazquez, G. Antorrena, J. Gonzalez and S. Freire, J. Wood Chem. Technol., 1997, 17, 147–162 CrossRef CAS.
- N. E. El Mansouri and J. Salvado, Ind. Crops Prod., 2007, 26, 116–124 CrossRef CAS.
- N. E. El Mansouri and J. Salvado, Ind. Crops Prod., 2006, 24, 8–16 CrossRef CAS.
- H. Goto, K. Koda, G. L. Tong, Y. Matsumoto and G. Meshitsuka, J. Wood Chem. Technol., 2006, 26, 81–93 CrossRef CAS.
- H. Goto, K. Koda, G. L. Tong, Y. Matsumoto and G. Meshitsuka, J. Wood Sci., 2005, 51, 312–314 CrossRef CAS.
- O. Faix, Holzforschung, 1986, 40, 273–280 CrossRef CAS.
- K. Lundquist and S. Vonunge, Acta Chem. Scand., Ser. B, 1986, 40, 791–797 CrossRef.
- M. Alekhina, O. Ershova, A. Ebert, S. Heikkinen and H. Sixta, Ind. Crops Prod., 2015, 66, 220–228 CrossRef CAS.
- Z. C. Xia, L. G. Akim and D. S. Argyropoulos, J. Agric. Food Chem., 2001, 49, 3573–3578 CrossRef CAS PubMed.
- M. Y. Balakshin, E. A. Capanema, R. B. Santos, H. M. Chang and H. Jameel, Holzforschung, 2016, 70, 95–108 CrossRef CAS.
- Chemische Analytik, Erfassungs und Bestimmungsgrenze, Normenausschuss Materialprüfung, DIN 32645:2008-11, 2008.
- R. A. Ogg, J. Am. Chem. Soc., 1938, 60, 2000–2001 CrossRef CAS.
| This journal is © The Royal Society of Chemistry 2017 |

