 Open Access Article
Towards white-light generation through upconversion of low-power near-infrared photons†
Oleg P. Dimitriev *a,
Julia L. Bricksb,
Anna L. Smirnovab and
Yuri L. Slominskiib
aV. Lashkaryov Institute of Semiconductor Physics, The NAS of Ukraine, 41 Nauki Ave., Kyiv 03028, Ukraine. E-mail: dimitr@isp.kiev.ua
bInstitute of Organic Chemistry, The NAS of Ukraine, 5 Murmanska Str., Kyiv 02660, Ukraine
First published on 14th March 2017
Abstract
A broadband upconverted emission due to the use of different types of molecular aggregates of the same organic infrared dye is demonstrated; one type of aggregate serves as a broadband absorber (from ∼700 to 1000 nm) and the other as a broadband emitter (from ∼450 to 700 nm).
Photon upconversion, which is related to an anti-Stokes type emission, is a process where the sequential absorption of two or more photons leads to the emission of light at a shorter wavelength than the excitation wavelength.1 Such a process is attractive for many applications, such as photocatalysis and photodynamic therapy, night-vision technology and chemical sensing,2 and it is especially important for application in solar cells,3 since it allows one to collect and convert the infrared (IR) part of the solar spectrum, which comprises almost 50% of the total energy of the sun, to visible light. Upconversion was first predicted by Bloembergen for development of IR detectors4 and demonstrated by Parker and Hatchard for donor–acceptor solution mixtures over 50 years ago.5 There are two well-known types of upconversion in organic materials that proceed due to a two-photon absorption (TPA)6 or triplet–triplet annihilation (TTA).7 Although both are related to nonlinear two-quantum process and need focusing excitation light, TPA and TTA are very different in details. The first mechanism requires extremely high light intensities, of the order of 10 10 of the usual solar intensity on a sunny day;8 therefore, it can be ruled out as a viable mechanism for application in solar cells. The second mechanism is based on energy transfer and requires two players in the system, i.e., a donor (sensitizer) and an acceptor (annihilator), respectively.9 The TTA mechanism of upconversion has certain advantages over TPA because it does not require high excitation power density (solar light is sufficient), it possesses relatively high upconversion quantum yield, and it allows one to readily tune excitation/emission wavelengths and strong absorption of excitation light.10 On the other hand, the TTA mechanism normally requires the presence of heavy atoms in organic chromophores, such as rare earth metals, which induce strong spin–orbit coupling responsible for the efficient intersystem crossing from excited singlet to triplet levels. Efficient intersystem crossing in heavy metal-free organic chromophores is rare and was found only in few compounds,11 so the absence of heavy atoms normally leads to the lack of strong spin–orbit coupling effects and the lack of phosphorescence in organic compounds, respectively. The other drawback of TTA mechanism of upconversion is its vulnerability in respect to molecular oxygen which is an ultimate quencher of the photon upconversion process. In order to overcome this limit, protective matrices with high barrier properties against oxygen should be designed.12 A problem with TTA upconverters is the spectral range as well. The longest wavelength at which the TTA system can be excited was reported to be at ∼780 nm for the pair of PdTAP–rubrene;13 that means that such systems are not able to capture the IR range. Because no efficient upconversion of near-IR radiation at wavelengths beyond 800 nm has been found for the above systems, the use of TTA upconverters is limited to solar cells with relatively wide band gaps only. To overcome the drawback due to the weak and narrowband near-IR absorption, dye sensitizers connected to suitable upconverters have been recently designed.14 The IR dye antenna assists collection of near-IR energy from the broad spectral range, however, the rare-earth upconverter still emits in the narrow band.
Here, we demonstrate a novel principle of upconversion, where molecular aggregates of the IR dye of a certain type in films are able to fulfill an upconversion of low power near-IR light to the visible one. We show that the interaction of dye molecules with inorganic metal ions in composite films further enhances the intensity of the upconverted emission. Due to the broad absorption region of the films, the system is able to up-convert red and near-IR photons (i.e., from ∼700 to 1000 nm) to the visible ones (from ∼450 to ∼700 nm), respectively. Such a dramatic property of these films allows us to consider them as a promising candidate for utilization of the IR part of solar energy.
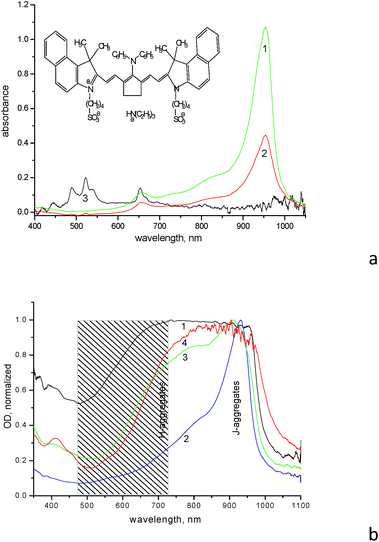
The IR dye (for the structure see insert in Fig. 1a and Scheme S1 in ESI,† further referred to as dye 1859SL) is able to form various aggregates both in solution and films. The diluted aqueous solution (10−5 M) demonstrates formation of H-aggregates with absorption maximum at ∼660 nm, as well as formation of J-aggregates with absorption maximum at 954 nm, respectively (Fig. 1a). The monomer absorption maximum of 1859SL is located at ∼830 nm as clearly observed when the dye is dissolved in an organic solvent like methanol (Fig. S1†); this is displayed as a shoulder in aqueous solution at ∼830 nm as well (Fig. 1a). In films, the aggregate arrangement varies greatly, since absorption spectra of the films demonstrate practically continuous absorption from ca. 500 to 1000 nm (Fig. 1b). Such a wide variation in spectra allows us to conclude that there is a different contribution of J- and H-aggregates to the film structure depending on the substrate used and ageing of the film. For example, the J-aggregate absorption band is intense and relatively narrow in as-prepared films, but it becomes broadened from the high-energy wing in the aged samples, where the H-aggregate band at 660 nm completely smears and merges with the J-aggregate absorption. It can be suggested that a manifold of different aggregates with varied intermolecular coupling, from strong to weak, is formed in the films of 1859SL, which absorb in the region between 500 and 1000 nm. Besides, morphological polymorphism in monolayers of J-aggregates of cyanine dyes is known as well.15
The process of the aggregate formation is normally facilitated in the presence of metal ions,16 which is clearly seen in films of 1859SL–ErCl3 and 1859SL–CaCl2 (Fig. 1b, curve 4). However, the changes can be observed even in the solutions, where addition of erbium salt induces decreased dye absorption due to the precipitate formation (Fig. 1a, curve 2), which indicates strong interaction of Er3+ ions and the dye molecules. The change in the absorption band shape (Fig. S2†) also evidences in favor of rearrangement of the aggregate structure. Most probably, the Er3+ ions facilitate also enlargement of the aggregates which become less soluble in water and thus precipitate, because absorption features of the Er3+ ions become suppressed in such a solution, which means that most ions are in the precipitate. Note that the spectrum of a neat ErCl3 solution demonstrates a number of narrow absorption bands at 489, 522, 539, 653, 808 and 975 nm (Fig. 1a, curve 3) which are due to 4I15/2 → 4F7/2, 4I15/2 → 2H11/2, 4I15/2 → 4S3/2, 4I15/2 → 4F9/2, 4I15/2 → 4I9/2 and 4I15/2 → 4I11/2 electronic transitions, respectively; these are consistent with the results obtained elsewhere (see, for example, ref. 17).
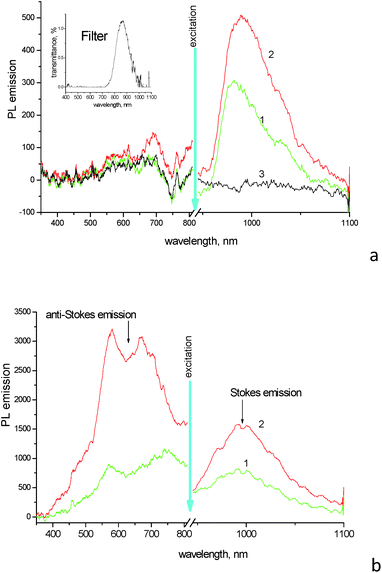
Photoluminescence (PL) spectra of aqueous solution of 1859SL upon excitation near ∼900 nm (the exact excitation bandwidth is shown on insertion in Fig. 2a) show pronounced emission of J-aggregates peaked at 981 nm (Fig. 2a). Upon addition of ErCl3 salt to the solution with the dye concentration being the same, the emission band of J-aggregates becomes more intensive and broadened (with FWHM increased from 46 nm for the neat dye solution to 60 nm for the mixture), as well as it becomes red shifted to 989 nm. A similar effect of the increased relative quantum yield of emission of the dye–inorganic salt mixture has been found in PL spectra of films drop-cast from the aqueous solutions (Fig. 2b).
At the same time, noticeable anti-Stokes emission from the high-energy side of the excitation wavelengths is observed in films (Fig. 2b), while such emission is very weak, if any, in dye solutions (Fig. 2a). Interesting, the upconversion is observed in films prepared of both the neat dye and dye–inorganic salt mixtures. The upconversion emission covers a broad range from ∼450 to 800 nm and shows two maxima at 580 and 670 nm for the film of dye–inorganic salt mixture (the latter peak is red-shifted in the film of the neat dye, which can be a result of some contribution of scattering from the excitation tail). There is no noticeable upconversion found in solutions (Fig. 2a); this fact again emphasizes the role of molecular aggregation which is much more pronounced and shows the presence of both J- and H-aggregates in solid films. The increase in the upconverted emission in the complex films as compared to the mixed solutions can be rationalized by comparing of the relative change between the neat dye and dye–inorganic salt mixture in the anti-Stokes and Stokes emission regions, respectively. While the ratio of the emission maxima at ∼980 nm from the mixture and neat dye is relatively modest and similar (this ratio is 1.90 in films and 1.65 in solutions, respectively; the difference can be due to non-identical geometry/scattering of the films vs. solutions in the experiments), the changes in the up-converted region are dramatic. For example, the band intensity at 580 nm almost does not change in the solutions, but it increases by a factor of ∼4 in the composite film as compared to the film of the neat dye.
It should be noted that erbium does not play a direct role in the upconversion here via energy transfer and excitation of corresponding levels of Er3+.3 First, it is known that erbium ions have narrow emission lines near 522, 536 and 645 nm (ref. 18) which are not observed in the upconversion region in our experiments (Fig. 2). At the same time, upon excitation at 398 nm the composite film demonstrates PL emission which contains major features observed above, i.e., the wide emission band between 500 and 800 nm, with two maxima near 580 and 680 nm which are assigned to H-aggregates, followed by a smaller band of J-aggregates at ∼990 nm (Fig. S3†). That is the first evidence that the upconversion emission observed above originates from the dye aggregates, but not from the erbium ions. Second, the replacement of the erbium ions by non-emissive calcium yields similar results, where the relative enhancement of the upconversion emission in the dye–CaCl2 composite films takes place as compared to the films of the neat dye.
Fig. 3 compares the emission in the same region of the neat dye film and the composite 1859SL–CaCl2 film upon excitation of fluorescence and upconversion emission, respectively. The fluorescence was obtained upon excitation of the films by wavelength at 400 nm. In this case, the emission at ∼480 nm is stronger for the neat dye film compared to the composite 1859SL–CaCl2 film. At the same time, the upconversion emission upon excitation at different wavelengths in the near-IR is strongly enhanced in the composite film as compared to the neat dye film. The upconverted emission bands, if excited by low-energy monochromatic light (of the order of 100 mW cm−2), are rather narrow (FWHM ∼ 8.0 nm) and the bandwidth practically does not depend on whether the emission is excited by a xenon lamp or a laser at low-power excitation intensities (Fig. S4†). The observed emission lines also conform the broad upconversion emission obtained as a result of the broadband excitation in the near-IR region (Fig. 2b).
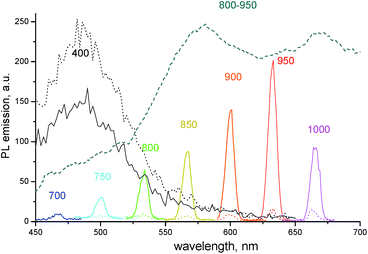 | ||
Fig. 3 PL emission spectra of the neat dye 1859SL (dotted curves) and the dye–CaCl2 composite (1![[thin space (1/6-em)]](https://www.rsc.org/images/entities/char_2009.gif) : :![[thin space (1/6-em)]](https://www.rsc.org/images/entities/char_2009.gif) 5 molar ratio, solid curves) films. The excitation wavelengths are indicated near each curve. The results are compared to the upconversion emission of the films upon the broadband excitation at 800–950 nm (dashed curve, see also Fig. 2b). 5 molar ratio, solid curves) films. The excitation wavelengths are indicated near each curve. The results are compared to the upconversion emission of the films upon the broadband excitation at 800–950 nm (dashed curve, see also Fig. 2b). | ||
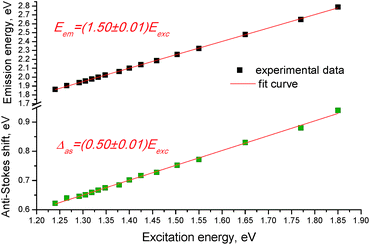
The anti-Stokes shift of the upconversion emission lines linearly scales with the excitation energy and the dependence of the anti-Stokes emission energy (Eem) on excitation energy (Eexc) of the films follows a linear function (Fig. 4), i.e.,
| Eem = (1.50 ± 0.01)Eexc, | (1) |
The mechanism of the revealed upconversion is not completely clear at the moment and needs further detailed studies. It should be noted that there are some indications of TTA rather than TPA mechanism in the phenomenon observed. First, the revealed upconversion takes place upon excitation with the low-power photons, which is characteristic of the TTA mechanism. For example, the double monochromator of a fluorimeter in our experiments provides sample illumination by monochromatic light with power of the order of 0.1 W cm−2 at best, whereas excitation of TPA requires power of >106 W cm−2. Second, the formation of aggregates to facilitate the observed upconversion emission was found to be necessary, suggesting that the intermolecular energy transfer takes place in the system. Third, the revealed anti-Stokes shift (which varies from 0.62 to 0.94 eV, Fig. 4) is of a similar value to that reported for typical upconversion systems with the TTA mechanism (i.e., from ∼0.4 to 0.9 eV (ref. 7)).
On the other hand, there are some discrepancies with the features characteristic of the TTA mechanism. First, it is well known that for most cyanine dyes the quantum yield of singlet–triplet intersystem crossing is usually very low19 and can be enhanced in the presence of heavy atoms in the chromophore, like rare earth metal, sulfur, selenium, etc.,20–22 external triplet-state donors,23 or it can be assisted by molecular isomerization,24 and also it can be found in some specific compounds.25 Nothing of the above can be attributed to 1859SL. Second, the TTA mechanism is valid for bimolecular systems containing triplet sensitizer and triplet acceptor (i.e., emitter). Again, this is not the case for our system, because it consists of the same type of molecules. Third, no other subgap energy levels in the films, which could serve as intermediate steps for electron transfer to higher excited levels, have been found (Fig. S5†). Finally, the lifetime of the upconverted emission was measured to be ∼150 ps; that completely excludes the TTA mechanism as a viable one for the observed upconversion.
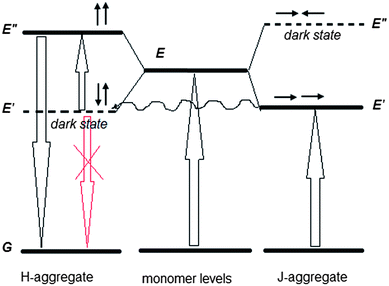
The obtained results allow us to put forward a tentative hypothesis that H-aggregates play an active role in the observed upconversion. The first fact is that the upconverted emission takes place in the wavelength region of the allowed states of H-aggregates (Fig. 1b and 2b). Second, the upconverted emission is enhanced in the films, where substantial quantity of H-aggregates is formed. Furthermore, it is known that in pairs of charge-transfer chromophores, such as polar D–π–A and quadrupolar D–π–A–π–D molecules, similar to the structure of 1859SL (Fig. S6†), dark states can take an active role in resonance energy transfer with interaction energies and that, depending on the relative orientation of the chromophores, can be even larger than energy transfer between the allowed states.26 The fact that the excitation energy transfer can proceed from or towards dipole forbidden (optically dark) exciton states is also well known for multichromophoric systems,27,28 particularly J-aggregates.29 Therefore, we propose that the observed upconversion proceeds as a two-step process, namely, as a subsequent energy transfer from the excited J-aggregates that play the role of a sensitizer, first to the dark state of H-aggregates, followed by excitation of H-aggregate from the dark to the lowest allowed state (Fig. 5). There are three features which should be taken into account when considering such a process. First, the energy transfer from the first excited level of J-aggregate to the dark state of H-aggregate is favorable when the corresponding energy levels are close to each other. Second, the relaxation of electron from the dark state of H-aggregate to the ground state is impeded due to inconsistency of the dipole phase relation (symmetry rules), which thus provides a long-lived state and also the fact that low-power photons are sufficient to lift this electron to the upper state, in contrast to the TPA mechanism where virtual states require high-power light to work. Third, the emission of H-aggregates is usually hardly possible, however, it can be allowed in H-aggregates that experience weak disorder.30,31 Our results confirm that the weak fluorescence of H-aggregates is observed in the region of 450–600 nm (Fig. 3) suggesting that there is some disorder in the aggregates, which is enhanced in the presence of inorganic salt (Fig. S7†) and which causes more intensive upconversion emission, respectively.
The linear dependence of the anti-Stokes emission energy on excitation energy that follows a linear function of Eem = 1.5Eexc (Fig. 4), allows us to suggest that there should be a constant splitting in energy between the dark and allowed excited states in each H-aggregate. The reason can be due to a certain amount of charge-transfer (CT) in the ground state of each molecule or the aggregate. The CT state is measured by ρ, where ρ represents the charge of the zwitterionic states Dρ+Aρ−D and DAρ−Dρ+, respectively, and the transition energies from the ground state to the dark and the allowed states can be expressed as the functions of ρ and t, where t is a matrix element that mixes the neutral state with each of the two zwitterionic states:26
| ħωGE′ = 2t((1 − ρ)/ρ)1/2; | (2) |
| ħωGE′′ = 2t(1/(ρ(1 − ρ)))1/2. |
By comparing eqn (2) with the experimental result (eqn (1)), we can write ħωGE′′/ħωGE′ = 1.5, from where we get ρ = 1/3. Thus, the linear dependence of the anti-Stokes emission energy on the excitation energy can be due to this particular CT state with ρ = 1/3.
Conclusions
In conclusion, we have demonstrated a broadband upconversion of near-IR light in films of the IR dye. The suggested mechanism is due to the unique ability of this dye to form both J- and H-aggregates in the condensed state, which play the role of sensitizer and annihilator, respectively, between which the energy transfer occurs that involves dark states as well. The broadband absorption and broadband upconversion emission provide new perspectives in utilization and imaging of infrared photons, particularly it allows one to extend this phenomenon in application of solar cells whose band gaps are adjusted to specific upconverted energy.Acknowledgements
Part of this work has been performed within the Fulbright scholarship. O. P. D. is grateful to Prof. Blank's group for technical assistance. The authors are indebted to Dr B. Caplins, Prof. A. Pud, Dr Ye. Shynkarenko, Dr Yu. Piryatinski, Mr V. Petrenko, Mr M. Sieryk for particular help at the different stages of this work.Notes and references
- B. Zhou, B. Shi, D. Jin and X. Liu, Nat. Nanotechnol., 2015, 10, 924–936 CrossRef CAS PubMed.
- S. Baldelli, Nat. Photonics, 2011, 5, 75–76 CrossRef CAS.
- W. G. van Sark, J. de Wild, J. K. Rath, A. Meijerink and R. E. Schropp, Nanoscale Res. Lett., 2013, 8, 81 CrossRef PubMed.
- N. Bloembergen, Phys. Rev. Lett., 1959, 2, 84–85 CrossRef CAS.
- C. A. Parker and C. G. Hatchard, Proc. Chem. Soc., London, 1962, 386–387 CAS.
- H. Mahr, Two-Photon Absorption Spectroscopy, in Quantum Electronics: A Treatise, Volume 1. Nonlinear Optics, Part A, ed. H. Rabin and C. L. Tang, Academic Press, 2012, pp. 286–363 Search PubMed.
- C. Ye, L. Zhou, X. Wang and Z. Liang, Phys. Chem. Chem. Phys., 2016, 18, 10818–10835 RSC.
- C. Strümpel, M. McCann, G. Beaucarne, V. Arkhipov, A. Slaoui, V. Švrček, C. del Cañizo and I. Tobias, Sol. Energy Mater. Sol. Cells, 2007, 91, 238–249 CrossRef.
- F. Auzel, Chem. Rev., 2004, 104, 139–174 CrossRef CAS PubMed.
- T. N. Singh-Rachford and F. N. Castellano, Coord. Chem. Rev., 2010, 254, 2560–2573 CrossRef CAS.
- W. Yang, J. Zhao, C. Sonn, D. Escudero, A. Karatay, H. G. Yaglioglu, B. Küçüköz, M. Hayvali, C. Li and D. Jacquemin, J. Phys. Chem. C, 2016, 120, 10162–10175 CAS.
- A. J. Svagan, D. Busko, Y. Avlasevich, G. Glasser, S. Baluschev and K. Landfester, ACS Nano, 2014, 8, 8198–8207 CrossRef CAS PubMed.
- V. Yakutkin, S. Aleshchenkov, S. Chernov, T. Miteva, G. Nelles, A. Cheprakov and S. Baluschev, Chem.–Eur. J., 2008, 14, 9846–9850 CrossRef CAS PubMed.
- W. Zou, C. Visser, J. A. Maduro, M. S. Pshenichnikov and J. C. Hummelen, Nat. Photonics, 2012, 6, 560–564 CrossRef CAS.
- V. V. Prokhorov, S. I. Pozin, D. A. Lypenko, O. M. Perelygina, E. I. Mal’tsev and A. V. Vannikov, Macroheterocycles, 2012, 5, 371–376 CrossRef CAS.
- T. D. Slavnova, A. K. Chibisov and H. Gorner, J. Phys. Chem. A, 2005, 109, 4758–4765 CrossRef CAS PubMed.
- C. Strohhofer and A. Polman, Opt. Mater., 2003, 21, 705–712 CrossRef.
- T. Som and B. Karmakar, Opt. Mater., 2009, 31, 609–618 CrossRef CAS.
- F. Kohn, J. Hofkens, R. Gronheid, M. Van der Auweraer and F. C. De Schryver, J. Phys. Chem. A, 2002, 106, 4808–4814 CrossRef.
- A. Toutchkine, D. V. Nguyen and K. M. Hahn, Org. Lett., 2007, 9, 2775–2777 CrossRef CAS PubMed.
- R. W. Redmond, I. E. Kochevar, M. Krieg, G. Smith and W. G. McGimpsey, J. Phys. Chem. A, 1997, 101, 2773–2777 CrossRef CAS.
- L. Franco, L. Pasimeni, G. Ponterini, M. Ruzzi and U. Segre, Phys. Chem. Chem. Phys., 2001, 3, 1736–1742 RSC.
- K. Jia, Y. Wan, A. Xia, S. Li, F. Gong and G. Yang, J. Phys. Chem. A, 2007, 111, 1593–1597 CrossRef CAS PubMed.
- N. Serpone and M. R. V. Sahyun, J. Phys. Chem., 1994, 98, 734–737 CrossRef CAS.
- W. Yang, J. Zhao, C. Sonn, D. Escudero, A. Karatay, H. G. Yaglioglu, B. Küçüköz, M. Hayvali, C. Li and D. Jacquemin, J. Phys. Chem. C, 2016, 120, 10162–10175 CAS.
- C. Sissa, A. K. Manna, F. Terenziani, A. Painelli and S. K. Pati, Phys. Chem. Chem. Phys., 2011, 13, 12734–12744 RSC.
- K. Mukai, S. Abe and H. Sumi, J. Phys. Chem. B, 1999, 103, 6096–6102 CrossRef CAS.
- P. J. Walla, P. A. Linden, C. P. Hsu, G. D. Scholes and G. R. Fleming, Proc. Natl. Acad. Sci. U. S. A., 2000, 97, 10808–10813 CrossRef CAS PubMed.
- N. Fukutake, S. Takasaka and T. Kobayashi, Chem. Phys. Lett., 2002, 361, 42–48 CrossRef CAS.
- J. Clark, C. Silva, R. H. Friend and F. C. Spano, Phys. Rev. Lett., 2007, 98, 206406 CrossRef PubMed.
- H. V. Berlepsch and C. Bottcher, J. Phys. Chem. B, 2015, 119, 11900–11909 CrossRef PubMed.
Footnote |
| † Electronic supplementary information (ESI) available: Experimental methods, dye characterization, additional absorption and emission spectra, charge distribution simulation in the dye molecule, and film morphology micrographs. See DOI: 10.1039/c7ra00797c |
| This journal is © The Royal Society of Chemistry 2017 |

