 Open Access Article
Thin sandwich graphene oxide@N-doped carbon composites for high-performance supercapacitors†
Cejun Hua,
Guoxin Zhang*bd,
Haoyuan Lib,
Cong Zhangb,
Yingna Changb,
Zheng Chang *b and
Xiaoming Sun
 abc
abc
aCollege of Energy, Beijing University of Chemical Technology, Beijing, 100029, China
bState Key Laboratory of Chemical Resource Engineering, Beijing University of Chemical Technology, Beijing, 100029, China. E-mail: zhanggx@sdust.edu.cn; changzheng@mail.buct.edu.cn
cBeijing Advanced Innovation Centre for Soft Matter Science and Engineering, Beijing University of Chemical Technology, Beijing, 100029, China
dCollege of Electrical Engineering and Automation, Shandong University of Science and Technology, Qingdao 266590, China
First published on 20th April 2017
Abstract
Compositing graphene oxide (GO) with controllable secondary components is of great significance to achieve carbon materials with high-level physicochemical properties. In this study, thin sandwich composites of GO and N-doped carbon (GO@NdC) were fabricated through controllable deposition of polyvinyl dichloride (PVDC)-dehalogenated carbon on GO; this method exploited the high affinity between PVDC and GO. The thin deposited carbon layers on GO achieved the thicknesses ranging from 1.0 to 2.0 nm. Considering that dehalogenated carbon has been verified to be highly reactive for coupling heteroelements, an overall N content of ∼7.0 at% was obtained with the addition of melamine as a N source. Moreover, the byproducts EtOH and NaCl could tune the composites into open 3D structures in situ, efficiently preventing the thin-layered composites from re-stacking. After activation with KOH, GO@NdC further demonstrated a hierarchical pore structure and large specific surface area. Remarkably, KOH-activated GO@NdC exhibited a high specific capacitance of ∼354 F g−1 and a capacitance retention of >65% (at 10.0 A g−1). Finally, the GO@NdC symmetric supercapacitor also achieved a high specific energy of ∼11.8 W h kg−1 in an aqueous alkaline electrolyte.
1. Introduction
Compositing active components on 2D atomically thin graphene oxide (GO) is a well-established method for fabricating high-performance electrode materials;1–3 this is mainly due to the abundant functionalities on GO, which can provide abundant anchoring sites for depositing secondary components.1,4–7 On the basis of previous studies, the performance enhancement of deposited components strongly correlated to graphene materials is mainly attributed to the following three aspects: shortened internal impedance by thin layer deposition,6,8 strong confinement of the dimensions of the active components,9–11 and prevention of activity or capacity loss.12–16 Compared to these metallic competitors, carbon materials/GO composites have additional advantages because they are highly durable and rich in reserves, which is more favorable for practical use.11,17Common strategies for fabricating carbon materials/GO composites involve on-site polymerization/carbonization of organic resources18–20 or stepwise mechanical mixing.21–23 For example, hydrothermally treating glucose with GO can result in uniform deposition of 6 to 20 nm thick carbon layers on GO. During the carbonization process of glucose, the high affinity of glucose to GO is exploited through hydrogen bond linking or esterification reactions.18,19,24 Usually, the thickness of the deposited carbon is simply controlled by tuning the weight ratio of the carbon source and GO while leaving the field of ultrathin deposition void.18,25–27 This is probably because of the conventional organic sources: these carbon sources usually have abundant functionalities, such that upon heating, massive cross-linking reactions and condensation reactions occur, and partial heteroatoms from the raw materials inevitably remain in the as-formed carbon layer, also providing many anchoring sites for the deposition of the next carbon layer. Moreover, the deposition of an ultrathin carbon layer holds the advantage of utilizing all the weight of the deposited carbon to provide the highest capacitance, in contrast with thick deposited carbon layers. Therefore, studies to realize the deposition of thin layer carbon are urgently needed for the development of electrode materials.
Herein, a new strategy for carbon formation was introduced to develop a carbon layer/GO composite by the defunctionalization of an unconventional polymer: polyvinyl dichloride (PVDC). As depicted in formula (1), after PVDC is dehalogenated by EtONa, plain carbon with few functionality residues should be formed, thus leaving few anchoring sites for the deposition of the next carbon layer.28,29 Theoretically, the unconventional carbon source PVDC could strictly control the deposition after the dehalogenation reaction. Once the first carbon layer after dehalogenation was deposited on the surface of GO through the affinity between the –Cl groups of PVDC and the –OH groups of GO, no further dehalogenated products would be easily attached to the previous carbon layer. As evidenced by the high resolution TEM images on the crumpled edge section, the deposited carbon layer on each side could be as thin as ∼1.8 nm. Additionally, because the in situ dehalogenated carbon was verified to be highly reactive for coupling alien elements, an overall N content as high as ∼7.0 at% could be achieved using melamine as a raw material. Meanwhile, volatilization of the byproducts of EtOH could help tune the composite into a hierarchical structure, which efficiently prevented the 2D layered structures from re-stacking. Finally, the sandwich-like GO@N-doped carbon composite was further activated by KOH for use in supercapacitor electrode materials. Remarkably, an ultrahigh specific capacitance of ∼354 F g−1 and a high capacitance retention (at large currents) were observed, which was ascribed to the combination of the thin carbon layer with GO, the hierarchical pores, and the large surface area.30–32
| (CH2CCl2)n + 2nNaOEt → C2n + 2nNaCl + 2nEtOH | (1) |
2. Experimental section
2.1 Materials
Polyvinyl dichloride (PVDC) was purchased from J&K Scientific Ltd. KMnO4, H2O2, H2SO4 (∼98.0 wt%), melamine, and N,N-dimethylformamide (DMF) (A.R.) were purchased from Beijing Chemical Factory. NaOEt and graphite powder were obtained from Aladdin Co. Ltd. All agents were used as received without further alterations.2.2 Preparation of GO@NdC sandwich composite
GO was fabricated according to the modified Hummers method as previously reported.33 After careful washing, the GO was transferred into DMF solvent (weight density of ∼2.0 mg mL−1) and stored for further use. For the fabrication of the GO@NdC sandwich composite, room-temperature dehalogenation of PVDC by strongly alkaline NaOEt was performed on GO. Typically, 0.97 g PVDC was firstly dissolved in 10.0 mL DMF to obtain a clear PVDC/DMF solution. Then, 10.0 mL GO/DMF was added, and the mixture of GO–PVDC/DMF was thoroughly sonicated for 1 hour to obtain a uniform suspension. After GO–PVDC/DMF was transferred into a ball mill jar, 1.5 g NaOEt and 0.2 g melamine were added to the jar; then, ball milling was performed for 3 h at 150 rpm. The resulting black slurry was directly oven-dried at 60 °C overnight and annealed with Ar protection at 500 °C for 1 hour (10 °C min−1). After thorough washing and drying, the black powder was collected and named GO@NdC-pre. Afterwards, GO@NdC-pre was mixed with different mass ratios of KOH (1/2/3-fold the amount of GO@NdC-pre), followed by manual grinding to realize uniform mixing. The grey powder was then annealed with Ar protection at 600 °C for 1 hour. After cooling to room temperature, the product was collected and washed with deionized water several times, followed by complete drying. The KOH-activated GO@NdC-pre was collected and named GO@NdC-nK (n is 1, 2 or 3, representing the mass ratio of KOH/GO@NdC-pre).2.3 Characterizations
The morphologies and structures of the GO@NdC sandwich composites were characterized using SEM (Zeiss SUPRA 55) and HRTEM (JEOL JEM-2100). Layer thickness analysis was performed using an atomic force microscope (AFM, Nanoscope V multimode). Chemical compositions were tested using XPS (Thermo Electron ESCALAB 250). Powder X-ray diffraction (XRD, Shimadzu XRD-6000) and Raman (LabRAM Aramis, HORIBA Jobin Yvon) measurements were applied to reveal the carbonization/graphitization degree as well as the level of amorphous carbon. Nitrogen adsorption/desorption analyses were performed using a Quanta Chrome Instruments Autosorb instrument at −196 °C. The specific surface area was calculated from the adsorption branch according to the Brunauer–Emmett–Teller (BET) method. The pore size of the distribution plot was derived from the adsorption branch of the isotherm based on the Barrett–Joyner–Halenda (BJH) method.2.4 Electrochemical characterizations
The electrochemical measurements were firstly carried out in a three-electrode setup using a CHI 660E electrochemical workstation (Shanghai, Chenhua). In a typical procedure,29 a GO@NdC/DMF slurry consisting of 85.0 wt% GO@NdC sandwich composite, 10.0 wt% carbon black, and 5.0 wt% polytetrafluoroethylene (PTFE) binder was coated dropwise onto a nickel foam current collector (1.0 cm2) and dried for 15 min under exposure to an NIR lamp, followed by >6 h in an oven at 80 °C. The loading mass of the working electrode was about 5.0 mg cm−2. The measurements were conducted in 6.0 mol L−1 KOH with a Pt counter electrode and an Hg/HgO reference electrode. The gravimetric specific capacitances of the working electrodes (Cs, F g−1) were calculated according to the charge/discharge curves collected with different current streams, as shown in formula (2):34
 | (2) |
For fabricating the symmetric coin devices, two pieces of the abovementioned working electrodes, separated by a hydrophilic separator, were immersed in 6.0 mol L−1 KOH and assembled into a coin configuration. The coin devices required pressing at 10 MPa before the electrochemical tests. The gravimetric specific capacitances (Cs, F g−1) of the coin devices were calculated according to the charge/discharge curves collected with different current streams, as shown in formula (3):34
 | (3) |
 | (4) |
 | (5) |
The electrochemically specific surface area (ESSA) was estimated by measuring the capacitance of the electrochemical double layer using cyclic voltammetry. Based on the CV curves with different scan rates in the region from −0.25 V to −0.35 V vs. Hg/HgO, the double-layer capacitance of the samples can be calculated by formula (6):
 | (6) |
3. Results and discussion
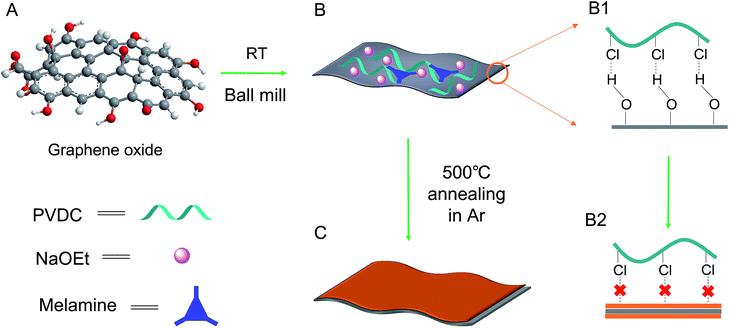
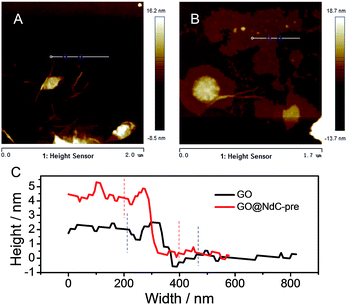
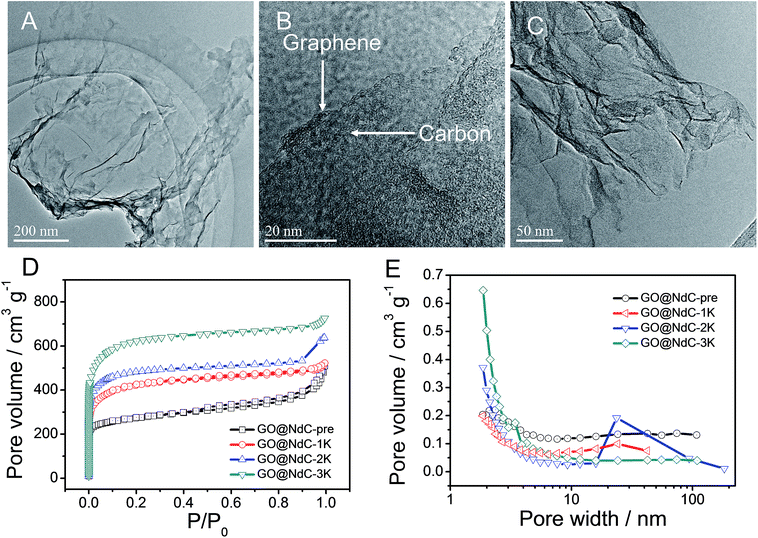
The as-obtained GO was submitted to full characterization, including SEM, TEM, XRD, and Raman studies, to confirm its thin carbon structure (Fig. S1†). As graphically shown in Scheme 1, the raw materials, including GO, PVDC (carbon source), melamine (nitrogen source), and EtONa (dehalogenation agent), were first engaged in room-temperature ball milling; the defunctionalization of PVDC and the subsequent deposition of carbon on GO could be achieved at room temperature due to the high reactivity between PVDC and EtONa (Fig. S2†).29 As shown in Fig. S3,† the XRD profile of the room-temperature formed carbon composite revealed the presence of NaCl, which verified our proposed reaction mechanism in formula (1). Abundant oxygen-containing functional groups on the surface of GO could initially serve as anchoring sites for the deposition of the first carbon layer.18,19 However, with complete coating of the functional groups of GO after dehalogenation, few functional groups remained for depositing the next layer of carbon; therefore, a very thin carbon layer could be formed on GO. The thickness of GO@NdC-pre measured by AFM was around ∼4.3 nm, while the initial thickness of GO was around 2.0 nm (Fig. 1).In the carbon deposition process, the in situ generated byproducts, NaCl and EtOH, could serve as solid and gas templates (Fig. S2B†) to create porosity, respectively. For contrast, control experiments in the absence of GO or PVDC were performed. As shown in Fig. S4E,† without the 2D template of GO, amorphous carbon clusters were formed in a disorderly fashion after PVDC dehalogenation. If no PVDC was initially added, the surface of GO would be free of contamination (Fig. S4F†), such as the clean surface of GO in Fig. S1.† In this strategy, therefore, GO, PVDC and EtONa were critical to achieving the thin carbon layer-coating GO sandwich composite. After washing to remove remaining salts, the GO@NdC-pre sandwich composite was subjected to TEM. As shown in Fig. 2A/B, a thin layered form with very low contrast and few wrinkles was observed by TEM. As marked in Fig. S4B,† a ridge-like part in the HRTEM image of the GO@NC composite was selected for detailed investigation; an ultrathin sandwich structure could be observed. The middle GO layer was about 2.6 nm and the deposited carbon layer was approximately ∼1.85 nm, which agreed with the AFM measurements. Upon doubling the carbon source of PVDC in the raw materials, we found that the deposited carbon layer was still very thin, and the overall thickness of the carbon composite (consisting of two layers of deposited carbon and one layer of reduced graphene oxide) was ∼7 nm, although a few carbon bulges were formed due to the excess PVDC, as marked in Fig. S4C/D.† Due to the removal of the irregularly shaped templates of the byproducts NaCl and EtOH, the structure of the carbon composite of GO@NdC-pre became porous, as shown in the large SEM view (Fig. S5A†).
The high carbonization/graphitization degree of GO@NdC-pre was revealed by the (002) XRD peak located at around 23.3° (Fig. S2C†) and the typical Raman band at about 1578 cm−1 (Fig. S2D†).28,33 We also noticed an intense disorder band at ∼1340 cm−1 in Fig. S3D,† suggesting that the deposited carbon layers were still amorphous and defective. This was consistent with recently reported cases where large amounts of defects are present in synthetic carbon materials.18,26 Due to the limited thickness of the carbon composite, the GO@NdC-pre sandwich could potentially enable fast electron transfer from the graphene plane to the outmost carbon layer, which would benefit its capacitive performance. In order to fully exploit the capacitive potential of the GO@NdC composite, we utilized KOH activation to induce more micropores into GO@NdC-pre to enlarge the specific surface area (SSA).35 KOH amounts equal to, double or triple that of GO@NdC were used to obtain GO@NdC-1K, GO@NdC-2K and GO@NdC-3K, respectively. As characterized by BET (Fig. 2D/E), the porosities of the as-made GO@NdC-nK after KOH activation were dominated by micropores.
With increasing KOH use, the contents of the micropores were increased, as indicated by the elongated vertical length at low P/P0 in Fig. 2D and also in the pore distribution curves (Fig. 2E). The SSAs of GO@NdC-1/2/3K are 1021.2, 1168.7, and 1508.1 m2 g−1, respectively, compared to the small SSA (∼634.8 m2 g−1) of precursive GO@NdC-pre. The high SSA strongly supported the fact that GO@NdC-nK has a porous structure. The SSAs of all GO@NdC samples are summarized in Table S1† with references to some recently reported N-doped carbonaceous materials. The Raman spectra and XRD profiles of the samples (Fig. S6†) revealed the enhancement of the carbonization/graphitization degree due to thermal treatment. According to the TEM image of GO@NdC-3K in Fig. 2C, the thin layer character was well retained, and many more micropores were generated. In the SEM overviews in Fig. S5B–D,† we noticed that the 3D morphology of GO@NdC after KOH activation could be further enhanced by the template effects of KOH and byproducts such as K2CO3, which could prevent thick stacking of the composite and increase the specific surface area.25,31,36 According to the XPS measurements, KOH activation introduced more oxygen species but decreased the N content (Fig. 3A/B) and finally induce a slight increase of the overall alien functionalities (Fig. 3C).19,37 In the N 1s spectra (Fig. 3D), the less stable pyridinic N would undergo etching or conversion to more stable configurations, such as graphitic N.28,29 This transformation of alien functionalities after KOH activation is helpful to reduce internal resistance, which is an important way to maximize energy efficiency.
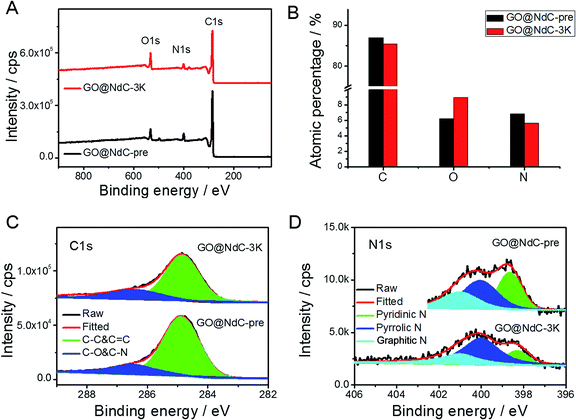 | ||
| Fig. 3 XPS results of GO@NdC samples: (A) XPS survey, (B) elemental analysis, (C) C 1s spectra, and (D) N 1s spectra. | ||
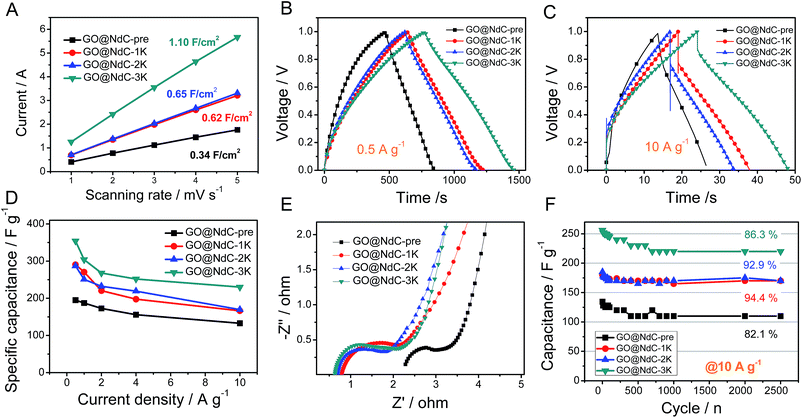
Electrochemical specific surface area (ESSA) measurements were performed to validate the strong effects of KOH activation on enlarging the specific surface areas of the GO@NdC composites. As shown in Fig. 4A, GO@NdC-pre initially exhibited an ESSA of 0.34 F cm−2; this gradually increased to 1.10 F cm−2 for GO@NdC-3K after KOH activation, which agrees with previous reports on KOH-activated carbon.37 Meanwhile, the CV profiles of the GO@NdC-nK samples confirmed the increasing tendency of the specific surface areas, as shown in Fig. S7.† A three-electrode measurement setup was used to evaluate the capacitance of the GO@NdC composites. As revealed by the GCD curves (Fig. 4B; the CV profiles are shown in Fig. S8†), GO@NdC-3K (annealed with 3 equivalent amounts of KOH to GO@NdC) showed 354 F g−1 at a low current stream of 0.5 A g−1, far beyond the value of 189 F g−1 obtained for GO@NdC-pre; this is one of the best reported capacitance values for carbon materials.3,36,38–40 Also, the nearly symmetric charge/discharge branches strongly indicated the superior EDLC behavior of the composites.19,29 The capacitance values of the GO@NdC composites significantly exceeded those of the control samples (single GO or NdC phase), as shown in Fig. S9,† indicating the structural advantage of the GO@NdC composites. Moreover, all of the GO@NdC composites before and after KOH activation showed very high rate capabilities. Remarkably, GO@NdC-3K exhibited over 65% capacitance retention even with a current stream as high as 10.0 A g−1, reaching ∼230 F g−1 (Fig. 4C and D). This may be related to the abundant porosities and open structures of the GO@NdC composites, which could facilitate ion transportation. Control samples without the addition of the N source, GO@C-pre and GO@C-3K, were fabricated via a similar protocol to the N-doped homologs. As shown in Fig. S10,† GO@C-3K still exhibited very large capacitance relative to that of GO@NdC-3K; however, a much lower rate capability of GO@C-3K was revealed in the rate capability tests, which is possibly due to its inferior pore hierarchy and stronger anchoring N sites.
The near-vertical curves in the low-frequency regions of the EIS spectra confirmed that all the GO@NdC samples could deliver reasonably good ion diffusion behavior to benefit capacitive performance (Fig. 4E). Compared with GO@NdC-pre, GO@NdC-nK showed much lower system impedance. For example, GO@NdC-3K exhibited a system resistance of 0.65 ohm, which is much smaller than the resistance of 2.35 ohm delivered by GO@NdC-pre; this was mainly ascribed to the greatly enhanced conductivity and is also possibly due to the varied pore geometry after KOH activation.41 The lowest impedance and potential drop of GO@NdC-3K can be assigned to its thin sandwich structure and highly recovered conductivity after annealing.19 Moreover, the diameters of the reaction semicircles increased with increasing amount of KOH, which may be related to the changes in the surface functionalities.28,30 The higher the dosage of KOH applied, the lower the remaining amount of dangling functional groups such as –OH and –NH2; thus, greater impedance would occur for ions binding to the electrode surface.42 Finally, the good cycling stability of the GO@NdC samples was confirmed at a high current stream of 10.0 A g−1 in Fig. 4F. After 2500 continuous working cycles, only ∼10% of capacitance was lost; this may be related to the high contents of functionalities (∼15 at%) possessed by these composites.24 By comparison with a few reported N-doped carbonaceous materials35,41,43–46 (Table S1†), we can safely conclude that the ultrathin deposition of activated carbon on the conductive substrate is beneficial to increase the capacitive performance.
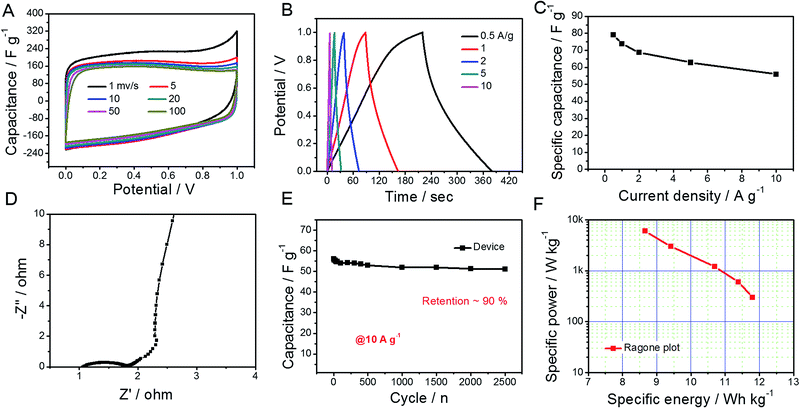
Considering the abovementioned ultrahigh capacitance, GO@NdC-3K was selected as an electrode material to be assembled into a coin supercapacitor with a symmetric configuration. As shown in Fig. 5, CV profiles of the symmetric supercapacitor collected with different scanning rates exhibited rectangular circuit shapes and nearly overlapped with each other when the Y-axis was normalized to the capacitance. We found that the charge/discharge branches were nearly symmetric, even when the open circuit voltage (OCV) was broadened to 1.2 V, as shown in Fig. 5B; this could enhance the specific energy of the whole capacitor.47,48 Calculated on both electrodes, the capacitance value was 58.1 F g−1, and a high capacitance retention of 74.2% was observed at a high current stream of 10.0 A g−1. In the EIS spectra (Fig. 5D), the symmetric supercapacitor demonstrated similar ion diffusion and current exchange behaviors to those measured in the three-electrode system. Also, about 91% capacitance was retained after 2500 continuous working cycles at a high current stream of 10.0 A g−1, which demonstrates very good practical potential to supply fast energy storage.36,38,39,49 Meanwhile, the specific energy, as shown in the Ragone plot (Fig. 5F), reached 11.8 W h kg−1 at a specific power of 312.5 W kg−1 and still provided 8.7 W h kg−1 at a high specific power of 6.2 kW kg−1.
4. Conclusions
Sandwich GO@NdC composites were fabricated through the controllable deposition of PVDC-dehalogenated carbon layers on the surface of GO, exploiting the high affinity between PVDC and GO. The thickness of the deposited carbon layer could be controlled to ∼1.9 nm, and the as-formed sandwich composite layers were very thin (∼6.5 nm). Due to the effects of the byproducts, NaCl and EtOH, the composites demonstrated a hierarchical structure which could prevent the 2D layered composites from re-stacking. By further KOH activation, the sandwich GO@NdC composites obtained a high specific capacitance of ∼354.0 F g−1 (at 0.5 A g−1) and a good capacitance retention of >65% (at 10.0 A g−1); this was ascribed to the thin layer deposition of carbon on GO, the hierarchical pores, and the low impedance of the composites. Additionally, the GO@NdC symmetric supercapacitor achieved a high specific energy of ∼11.8 W h kg−1, which is one of the best reported values to date. Our work provides a facile strategy for the deposition of thin layered carbon on graphene oxide and may be further extended to thin layered carbon coatings on other substrates for broad interests and applications.Acknowledgements
This work was supported by the Natural Science Foundation of China, the National Key Research and Development Project (2016YFF0204402), the Program for Changjiang Scholars and Innovative Research Team in the University, the Fundamental Research Funds for the Central Universities, and the Long Term Subsidy Mechanism from the Ministry of Finance and the Ministry of Education of PRC.Notes and references
- H. Wang and H. Dai, Chem. Soc. Rev., 2013, 42, 3088–3113 RSC.
- S. Dou, L. Tao, J. Huo, S. Wang and L. Dai, Energy Environ. Sci., 2016, 9, 1320–1326 CAS.
- J. Zhang, Z. Xia and L. Dai, Sci. Adv., 2015, 1, e1500564 Search PubMed.
- Y. Liang, Y. Li, H. Wang and H. Dai, J. Am. Chem. Soc., 2013, 135, 2013–2036 CrossRef CAS PubMed.
- Y. Qiu, G. Rong, J. Yang, G. Li, S. Ma, X. Wang, Z. Pan, Y. Hou, M. Liu and F. Ye, Adv. Energy Mater., 2015, 5 DOI:10.1002/aenm.201501369.
- Y. Tang, D. Wu, S. Chen, F. Zhang, J. Jia and X. Feng, Energy Environ. Sci., 2013, 6, 2447–2451 CAS.
- N. An, Y. An, Z. Hu, B. Guo, Y. Yang and Z. Lei, J. Mater. Chem. A, 2015, 3, 22239–22246 CAS.
- H. D. Jang, S. K. Kim, H. Chang, J.-H. Choi, B.-G. Cho, E. H. Jo, J.-W. Choi and J. Huang, Carbon, 2015, 93, 869–877 CrossRef CAS.
- Y. Liang, H. Wang, P. Diao, W. Chang, G. Hong, Y. Li, M. Gong, L. Xie, J. Zhou and J. Wang, J. Am. Chem. Soc., 2012, 134, 15849–15857 CrossRef CAS PubMed.
- C. Hu, Q. Han, F. Zhao, Z. Yuan, N. Chen and L. Qu, Sci. China Mater., 2015, 58, 21–27 CrossRef CAS.
- Y. Hou, M. R. Lohe, J. Zhang, S. Liu, X. Zhuang and X. Feng, Energy Environ. Sci., 2016, 9, 478–483 CAS.
- H. Wang, Y. Yang, Y. Liang, J. T. Robinson, Y. Li, A. Jackson, Y. Cui and H. Dai, Nano Lett., 2011, 11, 2644–2647 CrossRef CAS PubMed.
- H. Wang, L.-F. Cui, Y. Yang, H. Sanchez Casalongue, J. T. Robinson, Y. Liang, Y. Cui and H. Dai, J. Am. Chem. Soc., 2010, 132, 13978–13980 CrossRef CAS PubMed.
- G. Ren, X. Lu, Y. Li, Y. Zhu, L. Dai and L. Jiang, ACS Appl. Mater. Interfaces, 2016, 8, 4118–4125 CAS.
- D. Lin, Y. Liu, Z. Liang, H.-W. Lee, J. Sun, H. Wang, K. Yan, J. Xie and Y. Cui, Nat. Nanotechnol., 2016, 11, 626–632 CrossRef CAS PubMed.
- H. D. Jang, H. Kim, H. Chang, J. Kim, K. M. Roh, J.-H. Choi, B.-G. Cho, E. Park, H. Kim and J. Luo, Sci. Rep., 2015, 5, 9431 CrossRef PubMed.
- X. Huang, S. Li, Y. Huang, S. Wu, X. Zhou, S. Li, C. L. Gan, F. Boey, C. A. Mirkin and H. Zhang, Nat. Commun., 2011, 2, 292 CrossRef PubMed.
- D. Krishnan, K. Raidongia, J. Shao and J. Huang, ACS Nano, 2013, 8, 449–457 CrossRef PubMed.
- H. Luo, Z. Liu, L. Chao, X. Wu, X. Lei, Z. Chang and X. Sun, J. Mater. Chem. A, 2015, 3, 3667–3675 CAS.
- C. Hu, J. Xue, L. Dong, Y. Jiang, X. Wang, L. Qu and L. Dai, ACS Nano, 2016, 10, 1325–1332 CrossRef CAS PubMed.
- L. Yan, B. Zhao, X. Liu, X. Li, C. Zeng, H. Shi, X. Xu, T. Lin, L. Dai and Y. Liu, ACS Appl. Mater. Interfaces, 2016, 8, 6834–6840 CAS.
- H. Jin, H. Huang, Y. He, X. Feng, S. Wang, L. Dai and J. Wang, J. Am. Chem. Soc., 2015, 137, 7588–7591 CrossRef CAS PubMed.
- J. Sun, H.-W. Lee, M. Pasta, H. Yuan, G. Zheng, Y. Sun, Y. Li and Y. Cui, Nat. Nanotechnol., 2015, 10, 980–985 CrossRef CAS PubMed.
- Q. Wu, Y. Xu, Z. Yao, A. Liu and G. Shi, ACS Nano, 2010, 4, 1963–1970 CrossRef CAS PubMed.
- J. Zhu, X. Yang, Z. Fu, J. He, C. Wang, W. Wu and L. Zhang, Chem.–Eur. J., 2016, 22, 2515–2524 CrossRef CAS PubMed.
- B. Men, Y. Sun, M. Li, C. Hu, M. Zhang, L. Wang, Y. Tang, Y. Chen, P. Wan and J. Pan, ACS Appl. Mater. Interfaces, 2015, 8, 1415–1423 Search PubMed.
- A. V. Nakhate and G. D. Yadav, ACS Sustainable Chem. Eng., 2016, 4, 1963–1973 CrossRef CAS.
- G. Zhang, H. Luo, H. Li, L. Wang, B. Han, H. Zhang, Y. Li, Z. Chang, Y. Kuang and X. Sun, Nano Energy, 2016, 26, 241–247 CrossRef CAS.
- G. Zhang, L. Wang, Y. Hao, X. Jin, Y. Xu, Y. Kuang, L. Dai and X. Sun, Adv. Funct. Mater., 2016, 26, 3340–3348 CrossRef CAS.
- S. M. Jung, D. L. Mafra, C.-T. Lin, H. Y. Jung and J. Kong, Nanoscale, 2015, 7, 4386–4393 RSC.
- J. Tang, T. Wang, R. R. Salunkhe, S. M. Alshehri, V. Malgras and Y. Yamauchi, Chem.–Eur. J., 2015, 21, 17293–17298 CrossRef CAS PubMed.
- X. Wei, X. Jiang, J. Wei and S. Gao, Chem. Mater., 2015, 28, 445–458 CrossRef.
- D. Luo, G. Zhang, J. Liu and X. Sun, J. Phys. Chem. C, 2011, 115, 11327–11335 CAS.
- M. Sevilla and A. B. Fuertes, ACS Nano, 2014, 8, 5069–5078 CrossRef CAS PubMed.
- L. Chen, T. Ji, L. Brisbin and J. Zhu, ACS Appl. Mater. Interfaces, 2015, 7, 12230–12237 CAS.
- J. Ni and Y. Li, Adv. Energy Mater., 2016 DOI:10.1002/aenm.201600278.
- Y. Zhu, S. Murali, M. D. Stoller, K. Ganesh, W. Cai, P. J. Ferreira, A. Pirkle, R. M. Wallace, K. A. Cychosz and M. Thommes, Science, 2011, 332, 1537–1541 CrossRef CAS PubMed.
- G. Yu, X. Xie, L. Pan, Z. Bao and Y. Cui, Nano Energy, 2013, 2, 213–234 CrossRef CAS.
- F. Béguin, V. Presser, A. Balducci and E. Frackowiak, Adv. Mater., 2014, 26, 2219–2251 CrossRef PubMed.
- X. Zheng, J. Luo, W. Lv, D. W. Wang and Q. H. Yang, Adv. Mater., 2015, 27, 5388–5395 CrossRef CAS PubMed.
- L. Chen, T. Ji, L. Mu and J. Zhu, Carbon, 2016, 111, 839–848 CrossRef.
- Y. Xu, Y. Tao, X. Zheng, H. Ma, J. Luo, F. Kang and Q. H. Yang, Adv. Mater., 2015, 27, 8082–8087 CrossRef CAS PubMed.
- X. Du, C. Wang, M. Chen, Y. Jiao and J. Wang, J. Phys. Chem. C, 2016, 113, 2643–2646 Search PubMed.
- D. W. Wang, F. Li, L. C. Yin, X. Lu, Z. G. Chen, I. R. Gentle, G. Q. Lu and H. M. Cheng, Chem.–Eur. J., 2012, 18, 5345–5351 CrossRef CAS PubMed.
- G. Xu, B. Ding, P. Nie, L. Shen, J. Wang and X. Zhang, Chem.–Eur. J., 2013, 19, 12306–12312 CrossRef CAS PubMed.
- A. Yuan and Q. Zhang, Electrochem. Commun., 2006, 8, 1173–1178 CrossRef CAS.
- M. Yang, Y. Zhong, J. Bao, X. Zhou, J. Wei and Z. Zhou, J. Mater. Chem. A, 2015, 3, 11387–11394 CAS.
- X. Wu, L. Jiang, C. Long and Z. Fan, Nano Energy, 2015, 13, 527–536 CrossRef CAS.
- Q. Wang, J. Yan and Z. Fan, Energy Environ. Sci., 2016, 9, 729–762 CAS.
Footnote |
| † Electronic supplementary information (ESI) available: TEM and SEM images, XRD profile, Raman spectra and electrochemical data of controlled samples. See DOI: 10.1039/c7ra00909g |
| This journal is © The Royal Society of Chemistry 2017 |

