 Open Access Article
Highly efficient photocatalytic activity of Ag3PO4/Ag/ZnS(en)0.5 photocatalysts through Z-scheme photocatalytic mechanism†
Na Wei,
Hongzhi Cui *,
Mingliang Wang,
Xinzhen Wang,
Xiaojie Song,
Lei Ding and
Jian Tian
 *
*
School of Materials Science and Engineering, Shandong University of Science and Technology, Qingdao 266590, China. E-mail: cuihongzhi1965@163.com; jiantian@sdust.edu.cn
First published on 27th March 2017
Abstract
A novel Z-scheme Ag3PO4/Ag/ZnS(en)0.5 composite material was successfully prepared via a facile hydrothermal method and in situ precipitation. The composites exhibit significantly improved visible light photostability and photocatalytic activity towards methylene blue (MB) and phenol degradation. The excellent performance is mainly ascribed to the Z-scheme system formation of a Ag3PO4, Ag, and ZnS(en)0.5 hybrid. This system does not only enhance the photogenerated electron–hole pairs separation and transfer efficiency, but also maintains strong oxidation and reduction as well. This study may provide new insights to understand and design Z-scheme photocatalysts with high photoactivity.
1 Introduction
Inorganic–organic hybrid materials with laminar structures have recently drawn considerable interest because of their immense potential to provide enhanced material properties, which cannot be easily achieved with either organic or inorganic materials alone.1–3 ZnS is an important group II–VI compound semiconductor with a direct-gap semiconductor (3.2 eV) and is extensively used in field emitters, sensors, solar cells, and photocatalysis.4–7 When ZnS combines an ethylenediamine (en) organic molecule, an inorganic–organic hybrid complex ZnS(en)0.5 is formed and the organic molecules act as intercalation molecules. In addition, the hybrid materials exhibit a perfectly periodic crystal structure, allowing high carrier mobility.8 Also, for the hybrid, the level of conduction band is favorably negative, which contributes to stability and sensing response in electronic devices, as well as photoreductive properties.9 Research on this hybrid has shown that it can be a highly efficient photocatalyst in the photodegradation of diverse dyes, such as 4-nitrophenol and methylene blue.10,11 However, the ZnS(en)0.5 photocatalyst only absorbs ultraviolet (UV) light (no more than 5% of total sunlight), substantially limiting its application. The construction of heterojunctions has been proved to be an effective strategy to enhance the photocatalytic activity of ZnS(en)0.5.12,13However, the heterojunction construction of a Z-scheme photocatalytic system composed of two semiconductors with matched band edges draws interest because of its potential to enhance the separation efficiency of charges.14–16 Typically, the system effectively utilizes a high conduction band of one semiconductor and a low valence band of another semiconductor; thus, photocatalytic reactions possess large overpotentials.17 Nevertheless, various Z-scheme systems are reported as visible-light driven photocatalysts, such as CdS/Au/TiO2, Fe2V4O13/RGO/CdS, and Ag@AgBr/g-C3N4.18–20 Formation of efficient Z-scheme photocatalysts under visible light continues to present a great challenge. As a visible-light responsive semiconductor catalyst with a highly positive valence band, Ag3PO4 has been widely used in solar energy conversion, photocatalysis, and production of photochemical hydrogen from water.21–23 It is also noteworthy that the formation of Ag on silver salts acting as a solid-state electron mediator facilitates charges separation through the Z-scheme system.24,25 Chen et al.26 prepared a highly efficient Z-scheme Ag3PO4/AgI photocatalyst, in which Ag nanoparticles act as transmission bridge of the electron–hole pairs. Bu et al.27 synthesized a new Z-scheme heterojunction Ag3PO4/Ag/WO3−x. During photocatalysis, Ag by in situ reduction of Ag+ acted as the charge carrier transfer in this Z-scheme system and the photocatalytic performance was improved. However, ZnS(en)0.5 possesses a weak reduction capability because of the existence of –NH– bonds in ethylenediamine organic molecule, which is helpful to the formation of noble metal nanoparticles.28 Thus, if the Ag3PO4/Ag/ZnS(en)0.5 photocatalyst is conducted and follows the Z-scheme mechanism, the composite could also have great potential for the degradation of organic pollutants. However, no related work has been reported thus far, prompting us to pay attention on the actual mechanism of the Ag3PO4/Ag/ZnS(en)0.5 photocatalyst.
In the current study, we constructed a novel Ag3PO4/Ag/ZnS(en)0.5 nanocomposite using the facile hydrothermal method and in situ precipitation. The visible light photocatalytic activity for the degradation of methylene blue (MB) dye is also evaluated. Some metallic Ag were formed on the ZnS(en)0.5 surface during the in situ growth of the Ag3PO4 nanoparticles. A Z-scheme Ag3PO4/Ag/ZnS(en)0.5 composite photocatalyst may be conducted because of the highly positive valence band of Ag3PO4 and the highly negative conduction band of ZnS(en)0.5. A detailed mechanism toward understanding the photocatalysis of this Ag3PO4/Ag/ZnS(en)0.5 composite has been further proposed and discussed.
2 Experimental section
2.1 Materials
Zinc chloride (ZnCl2), sulfur powders (S), silver nitrate (AgNO3), polyvinylpyrrolidone (PVP), sodium phosphate (Na3PO4), ethanol (C2H6O), and ethylenediamine (C2H8N2) were used and they were all analytical grade. All aqueous solutions were prepared by deionized water.2.2 Synthesis of photocatalysts
First, pure ZnS(en)0.5 plates were prepared according to the literature.29 Briefly, ZnCl2 (3 mmol) and S powders (6 mmol) were added into ethanol (15 mL) and ethylenediamine (15 mL) mixed solution. The solution was ultrasonicated for 30 min and transferred into a 50 mL Teflon-lined stainless steel autoclave. After heating at 150 °C for 12 h, the precipitates were harvested by washing with deionized water and ethanol. Finally, the samples were dried at 60 °C for 10 h. For comparison, samples were always obtained by changing the reaction temperature (60 and 200 °C for 12 h) and reaction time (at 150 °C for 6 and 48 h).Preparation of Ag3PO4/Ag/ZnS(en)0.5 photocatalysts was conducted as follows: ZnS(en)0.5 (0.1 g) and PVP (0.1 g) were dissolved into 30 mL of deionized water, then 20 mL of AgNO3 solution at a specific concentration was slowly added into this suspension. After stirring for 30 min, 25 mL of Na3PO4 solution at a specific concentration (the mole ratio of Ag+ and PO43+ was fixed to 3![[thin space (1/6-em)]](https://www.rsc.org/images/entities/char_2009.gif) :
:![[thin space (1/6-em)]](https://www.rsc.org/images/entities/char_2009.gif) 1) was added to the above solution dropwise, and the mixed solution was stirred for 5 h. Subsequently, the precipitates were finally collected and fully dried at 50 °C for 10 h under vacuum. By this method, the Ag3PO4/Ag/ZnS(en)0.5 composites with Ag3PO4 concentrations of 44 wt%, 64 wt%, and 84 wt% were prepared; the composites were denoted as 44AAZ, 64AAZ, and 84AAZ, respectively. Pure Ag3PO4 was also prepared by adding the Na3PO4 solution into the AgNO3 solution dropwise and continuously stirring for 5 h. The synthesis procedure was shown in Scheme 1.
1) was added to the above solution dropwise, and the mixed solution was stirred for 5 h. Subsequently, the precipitates were finally collected and fully dried at 50 °C for 10 h under vacuum. By this method, the Ag3PO4/Ag/ZnS(en)0.5 composites with Ag3PO4 concentrations of 44 wt%, 64 wt%, and 84 wt% were prepared; the composites were denoted as 44AAZ, 64AAZ, and 84AAZ, respectively. Pure Ag3PO4 was also prepared by adding the Na3PO4 solution into the AgNO3 solution dropwise and continuously stirring for 5 h. The synthesis procedure was shown in Scheme 1.
2.3 Characterization
The phases composition of the samples were tested by X-ray diffraction (XRD, D/MAX-2500 diffractometer Rigaku) with a Cu-Kα radiation (λ = 0.154056 nm) in the range of 2θ = 5–60° at a scanning rate of 4.0° min−1. Field emission scanning electron microscopy (SEM, NANO FEI-450) and transmission electron microscopy (TEM, JEM-2100F) were used to detected the sample morphologies and structure details. The Fourier transform infrared (FTIR) spectra were measured by an Agilent Cary 600 Series FTIR spectrometer. The X-ray photoelectron spectrometry (XPS) were conducted on a Thermo ESCALAB 250XI XPS system. The optical properties of the samples were measured using UV-vis diffuse reflectance spectroscopy (Hitachi UV-3101) with BaSO4 as the reference sample. The photoluminescence (PL) spectra of the photocatalysts were measured using a fluorescence spectrometers (FLS 980) under laser excitation of 325 nm. Electron spin resonance (ESR) analysis was conducted using a Bruker model ER200-SRC spectrometer with a visible light of 420 nm irradiating the sample. Time-resolved PL spectra were carried on a customized single-photon counting system (FLS 980).2.4 Photoelectrochemical measurements
Photoelectrochemical (PC) measurements were recorded by an electrochemical workstation (CH Instrument 660E, Shanghai Chenhua, China). The prepared series of photoelectrodes was used as the work electrode. The prepared procedure as follows: 5 mg of the as-prepared photocatalyst was suspended in 2 mL of ethanol and 20 μL of 5 wt% Nafion solution to produce a slurry, which 50 μL of the resulting colloidal dispersion then getting dropped onto a piece of FTO slice with a fixed area of 1 cm2. A platinum wire and an Ag/AgCl electrode were used as the counter and reference electrode, respectively. The electrolyte was 0.1 M Na2SO4. EIS was measured within the 0.1 Hz to 1 MHz frequency range at the open-circuit voltage and AC voltage magnitude was 5 mV. The potential range of M–S plots were measured at −1.0 V to 1.0 V. The frequency was 1000 Hz and scan rate was 2 mV s−1. For PC measurement, a 350 W Xe arc lamp equipped with a UV cutoff filter (λ ≥ 420 nm) was used as the visible light source.2.5 Photocatalytic activity test
The photocatalytic activity of the MB and phenol degradation under visible light was conducted on a photocatalytic reactor (Xujiang Electromechanical Plant, Nanjing, China). The photochemical reactor was illuminated by a 350 W Xenon lamp with a cutoff filter of λ ≥ 420 nm. Typically, 50 mg of the photocatalysts were added to 20 mL of 20 mg L−1 pollutant aqueous solution. The suspension was stirred under dark condition for 30 min before irradiation. After the desired irradiation time, the aliquots was collected, centrifuged, and the filtrates were analyzed on a UV-Vis-NIR spectrometer (Hitachi UV-3101).3 Results and discussion
3.1 Characterizations
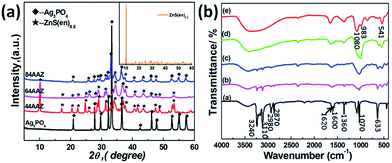
XRD patterns of pure Ag3PO4, ZnS(en)0.5 hybrid and Ag3PO4/Ag/ZnS(en)0.5 composites with varying Ag3PO4 contents were shown in Fig. 1a. The pure Ag3PO4 sample can be assigned to the body-centered cubic phase of Ag3PO4 (JCPDS no. 06-0505).30 For the inset curve, all diffraction peaks can be indexed to the typical orthorhombic phase ZnS(en)0.5 hybrid material with good crystallization, agreeing well with literature reports of ZnS(en)0.5.9,11,31 In addition, a diffraction peaks at 10.24° is observed, which is a characteristic peak of inorganic–organic hybrid composites with intercalated layer structures,10,12 indicating ethylenediamine molecules successfully insert into the interlayer of ZnS under current experimental conditions. The products of ZnS(en)0.5 hybrid would be affected either changing the reaction temperature or reaction time, as shown in Fig. S1.† When the reaction temperature decreases to 60 °C, a mixture of ZnS(en)0.5 and ZnS is found. Additionally, some unknown impurity by product are found (Fig. S1a†). However, with increasing temperature from 150 °C to 200 °C, all diffraction peaks could be readily indexed to ZnS (JCPDS no. 05-0566). In this process, the solvent acts as not only a thermal conducting medium but also as an extractant or active nucleophilic agent that can destroy the ethylenediamine bridged between zinc sulfur layers in the complex ZnS(en)0.5, thus, resulting in the formation of pure ZnS.31 Additionally, when changing the reaction time, ZnS(en)0.5 hybrid can be also synthesized both at 150 °C for 2 and 48 h (Fig. S1b†). However, the diffraction peak at low angle about 10°of 12 h is much stronger than the other samples (2 and 48 h), indicating its good crystallinity. At last, we choose the ZnS(en)0.5 prepared at 150 °C for 12 h to synthesize Ag3PO4/Ag/ZnS(en)0.5 composites. As shown in Fig. 1a, all diffraction peaks correspond to both Ag3PO4 and ZnS(en)0.5. In addition, the peaks located at 38.78°, 44.14° and 64.68° can be attributed to the (111), (200) and (220) planes of Ag (JCPDS no. 03-0931), as shown in Fig. S2.† No additional peaks are detected from any of the samples, indicating the high purity of the resultant products.Here, further support for the successful preparation of ZnS(en)0.5, Ag3PO4 and their composites is obtained from the FTIR spectra, as shown in Fig. 1b. For hybrid ZnS(en)0.5, the two sharp absorption peaks located at 3240 and 3110 cm−1 are the typical N–H stretching vibration, and the absorption peaks at about 2980 and 2970 cm−1 belong to the C–H vibration.12 However, the small absorption peak, particularly at 1620 cm−1, is assigned to the stretching vibrations of the N–H connect to Zn2+ in a five-membered ring. In addition, the three absorption peaks at 1600, 1360, and 1070 cm−1 are attributable to –NH2, –CH2 and –CN stretching, respectively.32 At the low frequency of 633 cm−1, the peak occurs because of the coordination between N and Zn2+. For pure Ag3PO4, the observed strong peaks at 983 and 1080 cm−1 comes from the asymmetric stretching of P–O–P rings.33 However, the peak at 532 cm−1 comes from O![[double bond, length as m-dash]](https://www.rsc.org/images/entities/char_e001.gif) P–O bending vibration.34 Meanwhile, all the characteristic peaks of ZnS(en)0.5 and Ag3PO4 are observed in Ag3PO4/Ag/ZnS(en)0.5 composites. Therefore, the results of FTIR spectra combined with XRD patterns suggest the existence of ethanediamine in hybrid ZnS(en)0.5 and Ag3PO4/Ag/ZnS(en)0.5 composites are successfully fabricated.
P–O bending vibration.34 Meanwhile, all the characteristic peaks of ZnS(en)0.5 and Ag3PO4 are observed in Ag3PO4/Ag/ZnS(en)0.5 composites. Therefore, the results of FTIR spectra combined with XRD patterns suggest the existence of ethanediamine in hybrid ZnS(en)0.5 and Ag3PO4/Ag/ZnS(en)0.5 composites are successfully fabricated.
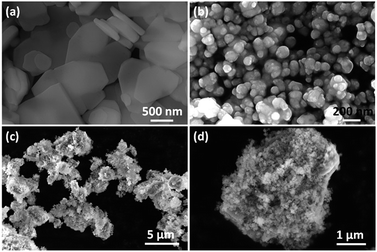
Fig. 2 shows the morphologies of the as-prepared samples. Hybrid ZnS(en)0.5 shows plate-like shapes of micrometer widths and thicknesses of about 100 nm (Fig. 2a). By contrast, pure Ag3PO4 appears spherical particles with smooth surfaces (Fig. 2b). In the SEM images of the composites, ZnS(en)0.5 remained intact and its surface became coarse after Ag3PO4 nanoparticles were grown on ZnS(en)0.5 plates (Fig. 2c and d). Fig. S3† shows the SEM images of the composites with different Ag3PO4 content. With increasing the Ag3PO4 content, the coverage of Ag3PO4 particles on ZnS(en)0.5 plates is increased. The microstructure of the 84AAZ composite was further examined by TEM. In Fig. 3a, Ag3PO4 particles measuring approximately 5–10 nm can be homogeneously formed without aggregation on ZnS(en)0.5 plates, indicating that the introduction of ZnS(en)0.5 is helpful for the dispersion of Ag3PO4 particles and decrease the particle size. The corresponding selected-area electron diffraction (SAED) pattern shows that the nanoparticles exhibit a polycrystalline structure. These results also confirm that the heteroarchitectures are well-formed between the Ag3PO4 nanoparticles and hybrid ZnS(en)0.5 (the inset in Fig. 3a). In order to confirm the complex structure of the fabricated Ag3PO4/Ag/ZnS(en)0.5, a high-resolution TEM image was examined (Fig. 3b). The lattice spacing of 0.31 and 0.26 nm belong to the Ag3PO4 (210) and ZnS(en)0.5 (020) planes, respectively. Notably, the lattice spacing of 0.23 nm is in good agreement with crystalline Ag (111) plane, demonstrating the formation of Ag nanoparticles during the preparation. The prepared ethylenediamine molecular chain in ZnS(en)0.5 exists –NH– group, which possesses weak reducibility. When Ag+ combines with it, Ag+ can oxidize the –NH– group to –N![[double bond, length as m-dash]](https://www.rsc.org/images/entities/char_e001.gif) group and Ag+ itself is reduced to Ag0 on the ZnS(en)0.5 surface, consequently forming Ag0.35 Additionally, the chemical composition of 84AAZ was analyzed by energy-dispersive X-ray spectrometry (EDS). The EDS spectrum (Fig. S4†) indicates that Zn, S, Ag, O and P exist in the composites, confirming that Ag/Ag3PO4 nanoparticles are successfully deposited on the ZnS(en)0.5 plates.
group and Ag+ itself is reduced to Ag0 on the ZnS(en)0.5 surface, consequently forming Ag0.35 Additionally, the chemical composition of 84AAZ was analyzed by energy-dispersive X-ray spectrometry (EDS). The EDS spectrum (Fig. S4†) indicates that Zn, S, Ag, O and P exist in the composites, confirming that Ag/Ag3PO4 nanoparticles are successfully deposited on the ZnS(en)0.5 plates.
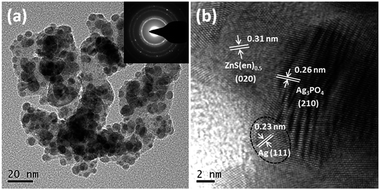 | ||
| Fig. 3 (a) Low-resolution and (b) high-resolution TEM images of 84AAZ. The inset shows the selective area electronic diffraction (SAED) image. | ||
XPS was performed to detect the surface chemical composition and analyze the chemical states of the products (Fig. 4a–f). The survey XPS spectrum (Fig. 4a) confirms the composite including N, C, Zn and S as well as Ag, P and O elements, in which the existence of N and C elements are attributed to organic ethanediamine molecule. These results are consistent with the chemical composition of the photocatalyst, as determined by XRD and FTIR. As shown in Fig. 4b, the two peaks at 1045.22 and 1022.07 eV could be belong to Zn 2p1/2 and Zn 2p3/2, respectively.36 Fig. 4c presents S 2p peaks at binding energies of 162.47 and 164.37 eV, corresponding to S 2p1/2 and S 2p3/2, respectively.37 The observed Zn 2p and S 2p photoelectron peaks are consistent with those reported for Zn2+ and S2+ in ZnS(en)0.5.38 The high-resolution spectrum of Ag 3d in Fig. 4d exhibits two strong peaks of Ag 3d5/2 and 3d3/2. Specifically, the two weak Ag 3d peaks can be further divided into four peaks using the XPS peak fitting software. The two strong peaks at 368.7 and 374.7 eV come from Ag+, whereas the other two peaks at 367.9 and 373.8 eV owing to the presence of Ag0 species, further verifying the successfully introduced Ag nanoparticles.25,39 In Fig. 4e, the binding energy peak at 133.3 eV is assigned to P 2p, which corresponds to the phosphorus from PO4.3–33 For the oxygen element (Fig. 4f), two different peaks at 530.9 and 531.8 eV exist in the O 1s spectrum. The former is in agreement with O2− anions from Ag3PO4 33 and the later is the water molecule (or external –OH group) on the surface of the photocatalyst, which can improve the photocatalytic activity.35
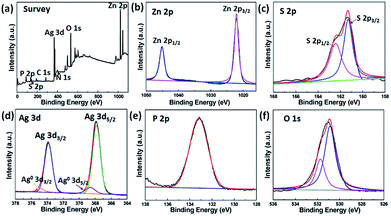 | ||
| Fig. 4 XPS spectra of the 84AAZ sample. (a) Survey, (b) Zn 2p, (c) S 2p, (d) Ag 3d, (e) P 2p and (f) O 1s. | ||
Fig. 5a shows the UV-vis diffuse reflectance spectra (DRS) of the photocatalysts. As shown in Fig. 5a, a sharp absorption peak at about 255 nm of ZnS(en)0.5 is owing to electronic transition of a metal–ligand from the hybrid40 and the absorption edge located at about 364 nm. Meanwhile, the absorption edge of pure Ag3PO4 is located in the visible region (530 nm), in agreement with previously reported results.33,41 Compared with that of the hybrid ZnS(en)0.5, the absorption edges of the Ag3PO4/Ag/ZnS(en)0.5 composites (44AAZ–84AAZ) show a systematic red-shift and similar to that of Ag3PO4, indicating all these as-prepared composites possess visible light response. Moreover, in accordance with the plot in Fig. 5b, the band gap energies (Eg) of ZnS(en)0.5 and Ag3PO4 are 4.1 and 2.4 eV, respectively, nearly equal to the those reported in previous studies.26,42 Meanwhile, compared with ZnS(en)0.5, an obvious decrease of the band gap is observed for 44AAZ, 64AAZ, 84AAZ composites, with the estimated values of 2.86, 2.66 and 3.02 eV, respectively.
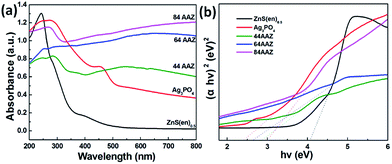 | ||
| Fig. 5 UV-vis diffuse reflectance spectra of (a) Ag3PO4/Ag/ZnS(en)0.5 composites and (b) estimated band gaps of ZnS(en)0.5 and Ag3PO4. | ||
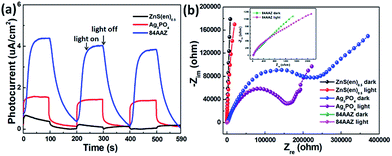
The photoelectrochemical properties of ZnS(en)0.5, Ag3PO4, and 84AAZ photoanodes were investigated to further study the charge carriers separation efficiency of photocatalysts (Fig. 6a). In Fig. 6a, photocurrent of the 84AAZ composites can be generated promptly under visible light illumination and is higher than that of pure Ag3PO4 and ZnS(en)0.5, indicating more efficient charge separation and transport in the sample. In Fig. 6b, the arc radius of the 84AAZ composites in the dark is much smaller than that of Ag3PO4 and ZnS(en)0.5 as well as under visible light, suggesting lower charge transfer resistance for the 84AAZ composites.43 Thus, the photoelectrochemical results confirm that the Ag3PO4 nanoparticles decoration considerably improves the electron–hole pairs transfer and enhances the photocatalytic activity.
To obtain a better understanding of the high efficiency of the Ag3PO4/Ag/ZnS(en)0.5 heterojunction in reducing the recombination of charge carriers, steady-state PL as well as the time-resolved PL spectra of ZnS(en)0.5, Ag3PO4 and 84AAZ photocatalysts were also explored (Fig. 7). In Fig. 7a, hybrid ZnS(en)0.5 exhibit a strong emission band (520 nm) and a shoulder band (450 nm). Compared with ZnS(en)0.5, Ag3PO4 and 84AAZ do not alter the spectral position of the peaks, but markedly reduce the intensity. Fig. 7b shows the transient time-resolved PL decay plot of ZnS(en)0.5, Ag3PO4, and 84AAZ. In order to compare the exciton lifetime, the intensity-average lifetime 〈τ〉 is calculated by fitting the curves. The average decay time of the 84AAZ is determined to be 0.81 ns, showing a prolonged lifetime of carriers with 0.49 and 0.62 ns of the single component of ZnS(en)0.5 and Ag3PO4. However, the prolonged lifetime of the carriers of 84AAZ could lead to enhanced photocatalytic activity for dye degradation in water.
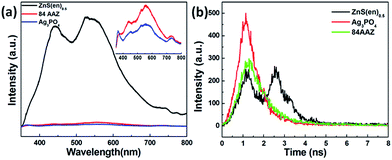 | ||
| Fig. 7 (a) Steady-state PL and (b) time-resolved PL spectra for ZnS(en)0.5, Ag3PO4 and 84AAZ photocatalysts. | ||
3.2 Photocatalytic activity performance
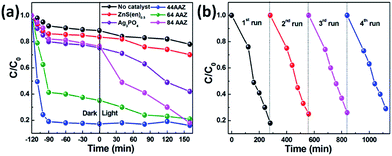
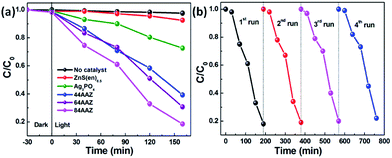
The photocatalytic degradation of aqueous MB over the catalysts is compiled in Fig. 8. For the blank experiment without any catalyst, the self-photolysis of MB under visible light is about 22%, suggesting the contribution of photosensitization by MB.44,45 The ZnS(en)0.5 hybrid exhibit poor MB degradation of its large energy band, whereas pure Ag3PO4 shows a certain degree of photoactivity, with 58% of MB degraded after 160 min of visible light irradiation. Compared with the Ag3PO4 sample, the Ag3PO4/Ag/ZnS(en)0.5 composites show a markedly higher degradation rate. However, about 83% is adsorbed by the 44AAZ composite after 120 min in dark and show extremely poor photocatalytic MB degradation performance under visible light illumination; moreover, no significant changes of MB concentration are observed during the subsequent 160 min visible light illumination. Surprisingly, the dye adsorption capacity of the Ag3PO4/Ag/ZnS(en)0.5 composite decreases with a increase in weight percent of Ag3PO4 in this composite from 44% to 84%, as shown in Fig. 8a. For 84AAZ composites, the adsorption capacity is about 24% after 120 min in dark, and the photodegradation rate reaches 82% after 160 min of visible irradiation. The results indicated that the photocatalytic MB degradation performance of the Ag3PO4/Ag/ZnS(en)0.5 composite is closely related to the weight percentage of Ag3PO4 in the composite.As is well known, the stability of a photocatalyst determines its service lifetime and practical application value. Thus, a 4-run cycling test was carried out to explore the stability of the optimized Ag3PO4/Ag/ZnS(en)0.5 composite (84AAZ) under the same condition. After 4 reuse cycles, the photodegradation efficiency of 84AAZ shows no apparent decrease, indicating its good photocatalytic stability (Fig. 8b).
The photocatalytic performance of the prepared photocatalysts was also evaluated by the photocatalytic oxidation of phenol aqueous solution under visible light irradiation, as shown in Fig. 9. As shown in Fig. 9a, blank test indicates that no noticeable degradation of phenol is observed in the absence of any photocatalyst. And the adsorption of phenol on all catalysts in the dark are negligible, suggesting the observed phenol degradation is initiated by semiconductor photocatalysis, which is different from the degradation of MB. After 160 min visible light irradiation, phenol removal are found to be 8%, 17%, 60%, 69% and 82% for ZnS(en)0.5, Ag3PO4, 44AAZ, 64AAZ and 84AAZ, respectively, indicating the photocatalytic phenol degradation is also closely related to the weight percentage of Ag3PO4 in the composite. Additionally, the stability and recycle tests in Fig. 9b confirms the composite is also stable for the photocatalytic oxidation of phenol.
3.3 Photocatalytic mechanism
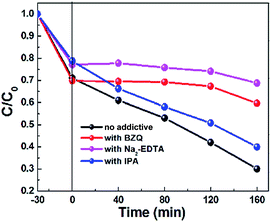
In order to explore the mechanism underlying enhanced photocatalytic activity, trapping experiments involving different reactive radical species for MB degradation over the 84AAZ composite was first conducted. In this study, three different chemicals, including disodium ethylenediaminetetraacetate (Na2-EDTA, 0.01 M), p-benzoquinone (BZQ, 0.001 M), and isopropanol (IPA, 0.01 M) were used as scavengers for photogenerated holes (h+), superoxide anion radicals (˙O2−) and hydroxyl radicals (˙OH), respectively. As shown in Fig. 10, a fast deactivation of the 84AAZ photocatalyst is observed for the addition of Na2-EDTA and that BZQ reduced the MB degradation from almost 70% to 41% in 160 min. The results confirm that photocatalysis can be influenced by h+ and ˙O2−. However, the presence of IPA shows a weak inhibition on the photocatalytic activity.Furthermore, the photo-generated reactive ˙OH and ˙O2− species of the 84AAZ composite were also characterized by ESR spin-trap technique (with DMPO) (Fig. 11). Notably, six characteristic peaks of DMPO–˙O2− radicals (Fig. 11a) and four characteristic peaks of DMPO–˙OH radicals (Fig. 11b) are observed under visible light irradiation; they increase with increases in irradiation time as well. By contrast, no such signals are detected under dark conditions in either case. Thus, on the basis of the aforementioned results of trapping experiments involving active species, as well as this ESR analysis, h+ and ˙O2− are identified as the main reactive radical species in Ag3PO4/Ag/ZnS(en)0.5 photocatalytic reactions rather than the ˙OH.
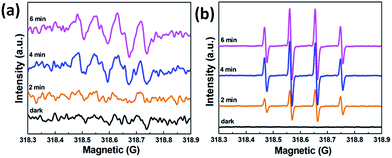 | ||
| Fig. 11 DMPO spin-trapping ESR spectra of 84AAZ (a) in methanol dispersion for DMPO–˙O2−and (b) in aqueous dispersion for DMPO–˙OH under visible light irradiation. | ||
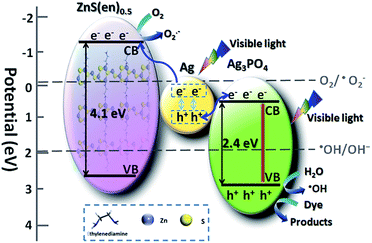
Mott–Schottky (M–S) plotting was conducted to determine the flat band of the samples, as shown in Fig. S5.† As the slope of the straight lines is positive, both Ag3PO4 and ZnS(en)0.5 are n-type semiconductors. In addition, the flat-band values are determined as 0.51 and −1.4 V for Ag3PO4 and ZnS(en)0.5, respectively. Combining with the results of the flat-band and the band-gap values of semiconductors (as estimated by DRS in Fig. 5), the conduction and valence band (CB and VB) positions of Ag3PO4 and ZnS(en)0.5 can be estimated in accordance with previous reports.46,47 The CB and V B levels of Ag3PO4 are determined to be 0.51 and 2.91 eV, whereas those of ZnS(en)0.5 −1.4 and 2.7 eV, respectively. Since the ECB potential of Ag3PO4 is more positive than E(O2/˙O2−) (−0.046 V vs. SHE), and the electrons on the ECB of Ag3PO4 can reduce O2 to ˙O2− species by one-electron reducing reaction.48 However, the active species trapping and ESR experiments have indicated that ˙O2− plays a major role in photocatalysis. These results suggested that a different transfer route of photogenerated electrons may exist in the Ag3PO4/Ag/ZnS(en)0.5 composites.
Herein, a Z-scheme mechanism for the efficient photocatalytic activity of the Ag3PO4/Ag/ZnS(en)0.5 composites is proposed according to the above results, as illustrated in Scheme 2. Photogenerated electrons and holes can be generated in Ag3PO4 under visible light irradiation thanks to its narrow band gap. Simultaneously, metallic Ag can absorb visible-light photons to yield charge carriers because of its SPR effect and dipolar character.25,49 The electrons then transfer from metallic Ag to the CB of ZnS(en)0.5, and the holes on the recombine the electrons on the CB of Ag3PO4. Consequently, the electrons that accumulate on the CB of ZnS(en)0.5 can effectively reduce oxygen to form the reactive ˙O2− species, and the holes that remain on the VB of Ag3PO4 can directly oxidize dye molecules or oxidize water molecules to form ˙OH species [(˙OH/OH−) = 1.99 eV vs. SHE].39 Thus, the Z-scheme not only reduces the electron–hole pair recombination but also possesses considerably strong oxidation and reduction ability as well. In other words, this results confirm the efficient photocatalytic activity and stability of Ag3PO4/Ag/ZnS(en)0.5 composites.
4 Conclusion
A novel Ag3PO4/Ag/ZnS(en)0.5 composite exhibiting efficient photocatalytic activity and stability was successfully fabricated using a facile hydrothermal method and in situ precipitation. The composite with optimal 84 wt% Ag3PO4 content presents the highest visible light activity towards MB and phenol degradation. Notably, Ag nanoparticles in situ formed during the preparation and prompting the Ag3PO4/Ag/ZnS(en)0.5 composite to follow a Z-scheme mechanism. This Z-scheme system can effectively improve the separation of photogenerated charge carriers and exhibit high reduction and oxidation activity, thereby improving the photocatalytic activity. This study not only elucidates Z-scheme photocatalysis but also provides new insights to design other high-performance Z-scheme photocatalysts.Acknowledgements
The authors are thankful for fundings from the National High Technology Research and Development Program of China (863 Program, No. 2015AA034404), Distinguished Taishan Scholars in Climbing Plan (No. tspd20161006), Science and Technology Development Planning of Shandong Province (No. 2014GGX102026), National Natural Science Foundation of China (No. 51502160).References
- Z. Teng, S. Wang, X. Su, G. Chen, Y. Liu, Z. Luo, W. Luo, Y. Tang, H. Ju, D. Zhao and G. Lu, Adv. Mater., 2014, 26, 3741–3747 CrossRef CAS PubMed.
- X. Huang, J. Li, Y. Zhang and A. Mascarenhas, J. Am. Chem. Soc., 2003, 125, 7049–7055 CrossRef CAS PubMed.
- Y. Yu, J. Zhang, X. Wu, W. Zhao and B. Zhang, Angew. Chem., 2012, 124, 921–924 CrossRef.
- X. Fang, M. Roushan, R. Zhang, J. Peng, H. Zeng and J. Li, Chem. Mater., 2012, 24, 1710–1717 CrossRef CAS.
- P. Hu, G. Gong, F. Zhan, Y. Zhang, R. Li and Y. Cao, Dalton Trans., 2016, 45, 2409–2416 RSC.
- M. Wang, H. Qin, Y. Fang, J. Liu and L. Meng, RSC Adv., 2015, 5, 105324–105328 RSC.
- W. Xitao, L. Rong and W. Kang, J. Mater. Chem. A, 2014, 2, 8304 Search PubMed.
- X. Huang and J. Li, J. Am. Chem. Soc., 2007, 129, 3157–3162 CrossRef CAS PubMed.
- A. Hernández-Gordillo, F. Tzompantzi, R. Gómez and H. Calderón-Benavides, Mater. Lett., 2014, 115, 147–150 CrossRef.
- A. Hernández-Gordillo, E. Maya-Flores and V. Rodríguez-Gonzalez, Mater. Lett., 2015, 148, 9–13 CrossRef.
- L. Nasi, D. Calestani, T. Besagni, P. Ferro, F. Fabbri, F. Licci and R. Mosca, J. Phys. Chem. C, 2012, 116, 6960–6965 CAS.
- Z. Wu, Y. Wu, T. Pei, H. Wang and B. Geng, Nanoscale, 2014, 6, 2738–2745 RSC.
- H. Katsumata, H. Ando, T. Suzuki and S. Kaneco, Ind. Eng. Chem. Res., 2015, 54, 3532–3535 CrossRef CAS.
- P. Zhou, J. Yu and M. Jaroniec, Adv. Mater., 2014, 26, 4920–4935 CrossRef CAS PubMed.
- W. Li, C. Feng, S. Dai, J. Yue, F. Hua and H. Hou, Appl. Catal., B, 2015, 168–169, 465–471 CrossRef CAS.
- S. Chen, Y. Qi, T. Hisatomi, Q. Ding, T. Asai, Z. Li, S. S. K. Ma, F. Zhang, K. Domen and C. Li, Angew. Chem., 2015, 127, 8618–8621 CrossRef.
- Y. Min, G. He, Q. Xu and Y. Chen, J. Mater. Chem. A, 2014, 2, 1294–1301 CAS.
- L. Ding, H. Zhou, S. Lou, J. Ding, D. Zhang, H. Zhu and T. Fan, Int. J. Hydrogen Energy, 2013, 38, 8244–8253 CrossRef CAS.
- P. Li, Y. Zhou, H. Li, Q. Xu, X. Meng, X. Meng, X. Wang, M. Xiao and Z. Zou, Chem. Commun., 2015, 51, 800–803 RSC.
- Y. Yang, W. Guo, Y. Guo, Y. Zhao, X. Yuan and Y. Guo, J. Hazard. Mater., 2014, 271, 150–159 CrossRef CAS PubMed.
- A. Samal, D. P. Das, K. K. Nanda, B. K. Mishra, J. Das and A. Dash, Chem.–Asian J., 2016, 11, 584–595 CrossRef CAS PubMed.
- Y. Bi, H. Hu, S. Ouyang, G. Lu, J. Cao and J. Ye, Chem. Commun., 2012, 48, 3748–3750 RSC.
- S. Zhang, X. Gu, Y. Zhao and Y. Qiang, Mater. Sci. Eng., B, 2015, 201, 57–65 CrossRef CAS.
- Y. Li, L. Li, Y. Gong, S. Bai, H. Ju, C. Wang, Q. Xu, J. Zhu, J. Jiang and Y. Xiong, Nano Res., 2015, 8, 3621–3629 CrossRef CAS.
- F. Chen, Q. Yang, X. Li, G. Zeng, D. Wang, C. Niu, J. Zhao, H. An, T. Xie and Y. Deng, Appl. Catal., B, 2017, 200, 330–342 CrossRef CAS.
- Z. Chen, W. Wang, Z. Zhang and X. Fang, J. Phys. Chem. C, 2013, 117, 19346–19352 CAS.
- Y. Bu, Z. Chen and C. Sun, Appl. Catal., B, 2015, 179, 363–371 CrossRef CAS.
- Y. Bu and Z. Chen, ACS Appl. Mater. Interfaces, 2014, 6, 17589–17598 CAS.
- L. Wang, H. Chen, L. Xiao and J. Huang, Powder Technol., 2016, 288, 103–108 CrossRef CAS.
- Y. He, L. Zhang, B. Teng and M. Fan, Appl. Catal., B, 2015, 168–169, 1–8 CAS.
- G. T. Zhou, X. Wang and J. C. Yu, Cryst. Growth Des., 2005, 5, 1761–1765 CAS.
- J. Yang, G. Wang, H. Liu, J. Park, X. Gou and X. Cheng, J. Cryst. Growth, 2008, 310, 3645–3648 CrossRef CAS.
- X. Chen, Y. Dai, J. Guo, T. Liu and X. Wang, Ind. Eng. Chem. Res., 2016, 55, 568–578 CrossRef CAS.
- J. Ma, Q. Liu, L. Zhu, J. Zou, K. Wang, M. Yang and S. Komarneni, Appl. Catal., B, 2016, 182, 26–32 CrossRef CAS.
- N. Wei, H. Cui, Q. Song, L. Zhang, X. Song, K. Wang, Y. Zhang, J. Li, J. Wen and J. Tian, Appl. Catal., B, 2016, 198, 83–90 CrossRef CAS.
- Q. Liu, H. Lu, Z. Shi, F. Wu, J. Guo, K. Deng and L. Li, ACS Appl. Mater. Interfaces, 2014, 6, 17200–17207 CAS.
- W. Chen, T. Y. Liu, T. Huang, X. H. Liu and X. J. Yang, Nanoscale, 2016, 8, 3711–3719 RSC.
- Y. Kim, J. Y. Kim and D. J. Jang, J. Phys. Chem. C, 2012, 116, 10296–10302 CAS.
- H. Li, Y. Sun, B. Cai, S. Gan, D. Han, L. Niu and T. Wu, Appl. Catal., B, 2015, 170–171, 206–214 CrossRef CAS.
- A. Hernández-Gordillo, F. Tzompantzi and R. Gómez, Int. J. Hydrogen Energy, 2012, 37, 17002–17008 CrossRef.
- X. Chen, X. Huang and Z. Yi, Chemistry, 2014, 20, 17590–17596 CrossRef CAS PubMed.
- A. Hernández-Gordillo, F. Tzompantzi and R. Gómez, Catal. Commun., 2012, 19, 51–55 CrossRef.
- W. Teng, X. Li, Q. Zhao and G. Chen, J. Mater. Chem. A, 2013, 1, 9060–9068 CAS.
- N. Barbero and D. Vione, Environ. Sci. Technol., 2016, 50, 2130–2131 CrossRef CAS PubMed.
- B. O. Xiaoli Yan, T. Ohno, K. Nishijima and R. Abe, Chem. Phys. Lett., 2006, 429, 606–610 CrossRef.
- L. Ye, D. Wang and S. Chen, ACS Appl. Mater. Interfaces, 2016, 8, 5280–5289 CAS.
- S. Sakthivel and H. Kisch, Angew. Chem., Int. Ed., 2003, 42, 4908–4911 CrossRef CAS PubMed.
- Y. He, L. Zhang, M. Fan, X. Wang, M. L. Walbridge, Q. Nong, Y. Wu and L. Zhao, Sol. Energy Mater. Sol. Cells, 2015, 137, 175–184 CrossRef CAS.
- J. Low, J. Yu, Q. Li and B. Cheng, Phys. Chem. Chem. Phys., 2014, 16, 1111–1120 RSC.
Footnote |
| † Electronic supplementary information (ESI) available. See DOI: 10.1039/c7ra01001j |
| This journal is © The Royal Society of Chemistry 2017 |


