 Open Access Article
Creative Commons Attribution 3.0 Unported Licence
Enhanced photoluminescence from gold nanoparticle decorated polyaniline nanowire bundles
Aniruddha Samantaa,
Rupali Gangopadhyayb,
Chandan Kumar Ghoshc and
Mallar Ray *a
*a
aSchool of Materials Science and Engineering, Indian Institute of Engineering Science and Technology, Shibpur, Botanic Garden, Howrah 711103, India. E-mail: mray@matsc.iiests.ac.in
bCentre for Advanced Materials, Indian Association for the Cultivation of Science, 2A & B Raja S. C. Mallik Road, Kolkata 700032, India
cSchool of Materials Science and Nanotechnology, Jadavpur University, Kolkata 700032, India
First published on 23rd May 2017
Abstract
Enhanced emission is observed from a nanocomposite consisting of conducting polyaniline nanowire bundles decorated with gold nanoparticles synthesized by simple physical blending and in situ interfacial polymerization techniques. Structural investigations revealed that both the methods led to the formation of nanocrystalline gold particles dispersed in a crystalline polyaniline nanowire matrix but the interfacial method leads to a better dispersion of the nanoparticles. Spectroscopic signatures suggest a strong electronic interaction between conducting polyaniline and gold that is manifested by a drastic modification of the plasmon absorption band of gold nanoparticles along with a significant enhancement in the emission characteristics. We, therefore, have a luminescent solid state material composed of gold and a conducting polymer which can find a huge range of applications based on suitable tailoring of the electrical and optical properties.
1. Introduction
A hybrid system consisting of metal–polymer nanostructures offers many advantages over a single component nanosystem since size dependent properties of the individual nanocomponents can be coupled and tailored to design multifunctional units. Conducting polymer (CP) and metal nanoparticle (NP) based hybrids, in this regard, are extremely promising candidates for high performance sensors where conjugated polymers act as conduits that interface and respond to NP interactions.1 The size dependent optical response of metallic NPs, particularly localized surface plasmon resonance (LSPR) observed in noble metal NPs, has drawn substantial research interest due to the enhancement of the radiative and/or nonradiative properties.2–5 LSPR associated with noble metal NPs create sharp spectral absorption and scattering peaks as well as strong electromagnetic near-field enhancements. Molecular interactions near metal NPs should, therefore, affect some change or shift of the LSPR peaks – an effect that has been widely studied for detection of such interactions near the NP surface.6 On the other hand, CP nanostructures have properties similar to metals and inorganic semiconductors, while retaining ease of synthesis and biocompatibility.7 Their electrical conductivities can be tuned over several orders of magnitude upon doping, which cover the whole insulator–semiconductor–metal range.8 Due to their unique electrical conduction, reversible doping/dedoping process, controllable chemical and electrochemical properties, a variety of 1D CP nanostructures have received special attention as potential candidates for new generation chemical and biosensors, field-effect transistors, field emission and electrochromic display devices etc.8–11 Therefore, integration of metal NPs and CP nanostructures in a single system promises to endow more versatile functionalities that would couple the enhanced optical response of metal NPs with the advantages of CPs.Out of the wide variety of metal NPs, AuNPs are especially important because of their high extinction coefficient and broad plasmon absorption band in the visible region. They absorb and scatter light order of magnitudes stronger than other materials.12 It has been demonstrated that the position of the LSPR band peak and consequently the color of the AuNPs colloids can be tuned by varying size, shape, morphology, composition and the dielectric environment of the NPs.13 If small AuNPs are allowed to coalesce in a controlled fashion, their color can be systematically controlled from red through blue to violet. Colorimetric detection of analytes using analyte-mediated aggregation of AuNPs to produce a red-to-blue color change has been reported.14,15 Sensing system based on the PL quenching of quantum dots or dyes by AuNPs has also been used for quantitative analysis and high throughput screening of molecules which inhibit the specific interactions between biomolecules.16 Additionally, AuNPs are nontoxic, highly photo stable,17 and can bind to protein and biomolecules efficiently.18 However, AuNPs alone cannot form a solid state device since the NPs are usually dispersed in aqueous or organic suspensions. In this regard conjugated polymer polyaniline (PANI) can act as an excellent matrix where AuNPs could be potentially dispersed, thereby forming a solid state material that utilizes the advantages of both AuNPs as well as PANI. PANI in itself is a promising material for sensors, since its conductivity is highly sensitive to the environment.19,20 Because of the pseudo-1D nanofiber like morphology, PANI nanowire combining its biocompatibility and environmental stability,21 and reversible redox chemistry has emerged as an excellent candidate to be used as a material for various nanoscale applications, particularly for chemical and biological sensors.22,23 Hence, doped PANI in combination with AuNPs promises to be a good choice for fabrication of a biosensor.
In this work we report a facile strategy for synthesis of AuNP decorated PANI that provides a solid state material with superior optical properties. Photoluminescence (PL) property of the system is found to be significantly enhanced which endows a new characteristic to this hybrid material. The material also serves as an important class of composite where metallic plasmon can be potentially coupled with polymer exciton to achieve further enhancement. In principle, optimization of the composition of the hybrid can lead to the development of a sensor that can simultaneously utilize the LSPR, PL and conductivity of the system for selective and sensitive detection of a variety of biomolecules.
2. Experimental
Synthesis of AuNP decorated PANI
Colloidal suspension of AuNPs was synthesized by reduction of AuCl4− with citrate in aqueous solution following Frens–Turkevich method.24,25 A 20 ml aliquot of 1.5 mM HAuCl4 was brought to roiling boil and 3 ml of 1% trisodium citrate dehydrate (Na3C6H5O7·2H2O–Na3-Ct) was introduced in the final solution so as to obtain the molar concentration ratio of Na3-Ct and HAuCl4 as 3.5![[thin space (1/6-em)]](https://www.rsc.org/images/entities/char_2009.gif) :
:![[thin space (1/6-em)]](https://www.rsc.org/images/entities/char_2009.gif) 1. This ratio reportedly produces the smallest AuNPs as the sizes of the NPs are sensitive towards the concentration ratio of acid and reducing agent.26 Due to continuous heating and stirring we obtained an unstable bluish solution after ∼5 min. A wine red solution, suggesting the formation of AuNPs was obtained after ∼20 min. No further color change was observed which indicated complete reduction of HAuCl4. The pH of the solution throughout the process was kept constant at ∼7.
1. This ratio reportedly produces the smallest AuNPs as the sizes of the NPs are sensitive towards the concentration ratio of acid and reducing agent.26 Due to continuous heating and stirring we obtained an unstable bluish solution after ∼5 min. A wine red solution, suggesting the formation of AuNPs was obtained after ∼20 min. No further color change was observed which indicated complete reduction of HAuCl4. The pH of the solution throughout the process was kept constant at ∼7.
Bulk PANI was first synthesized following the method of Huang et al.27 Oxidation of 1 ml of aniline (in 250 ml of 1 M HCl) was carried out with ammonium per sulphate (APS) while maintaining the molar ratio of aniline and APS as 1![[thin space (1/6-em)]](https://www.rsc.org/images/entities/char_2009.gif) :
:![[thin space (1/6-em)]](https://www.rsc.org/images/entities/char_2009.gif) 1. PANI nanowires were synthesized via interfacial polymerization of aniline as described by Huang et al.28 We took 50 μl of distilled aniline in 1 ml cyclohexane and 0.2 g of APS in 1 ml aqueous (1 N HCl) medium. As two solutions were brought into contact in a vial, green colored PANI nanowires started to grow at the interface and gradually filled up the aqueous medium.
1. PANI nanowires were synthesized via interfacial polymerization of aniline as described by Huang et al.28 We took 50 μl of distilled aniline in 1 ml cyclohexane and 0.2 g of APS in 1 ml aqueous (1 N HCl) medium. As two solutions were brought into contact in a vial, green colored PANI nanowires started to grow at the interface and gradually filled up the aqueous medium.
A10 ml aliquot of wine-red colored colloidal AuNPs was physically mixed with 10 ml of sonicated aqueous dispersion of doped bulk PANI (S1) or PANI nanowire (S2) using an sonicator, each dispersion containing 0.1 mg of solid. It was observed that AuNPs were adsorbed onto the PANI matrix (bulk or nanowire) and green precipitate settled down leaving the colorless liquid as the supernatant. As discussed in the Results and discussion section this method resulted in the formation of structure where AuNPs were found to be largely agglomerated in the PANI network. Changing the conditions of sonication had little effect on obtaining a better dispersion of AuNPs. In an attempt to obtain well distributed AuNPs, another method was adopted for in situ synthesis of PANI-nanowire–AuNP hybrid. To a solution of 50 μl aniline in 10 ml cyclohexane, 5 ml aqueous colloidal gold was added followed by addition of 0.06 g of APS (in HCl). Oxidation of aniline takes place and green precipitate appears at the interface and in the aqueous medium. After 3 h the sample was separated from the organic layer and collected (S3). 0.1 mg of this solid was re-dispersed in 10 ml HCl (0.1 N) for microscopic and spectroscopic studies.
Characterization
Crystalline property, phases and particle sizes of synthesized PANI (bulk and nanowire) and the composites, S1, S2 and S3 were studied by X-ray diffraction (XRD) using a standard X'pert pro MPD diffractometer (PANalytical, The Netherlands) operating at 40 kV and 30 mA and using Cu Kα1 (λ = 1.54056 Å) monochromatic radiation. Detailed structure of the samples were investigated by high resolution transmission electron microscopy (HRTEM) using a JEOL-JEM, 2010 Electron Microscope operating at 200 kV. The samples were five times diluted prior to deposition and 2 μl of samples were deposited on carbon coated cupper grids. UV-visible spectroscopy was performed using a JASCO V-530, UV-VIS-NIR spectrophotometer. Steady state PL property of different samples was investigated using a Horiba Jobin Yvon, Fluorolog-3 (Nanolog) spectrofluorometer (model FL3-11) fitted with a 450 W xenon lamp source, photomultiplier tube detector and single grating monochromator. During observation, entry and exit slit widths were kept at 1 nm and the integrating time was 0.5 s. PL quantum yields (QYs) of the samples in the solid states were estimated by recording the PL spectra using an integrating sphere following the method proposed by Pålsson and Monkman,29 and de Mello et al.30 The integrating sphere was mounted inside the Fluorolog-3 spectrofluorometer and the samples were mounted into the holder inside the sphere. The measured spectra were background corrected by recording a blank data. Thermal stability of the samples were investigated using thermogravimetric analysis (TGA) and differential thermal analysis (DTA) by a TG-DTA, Model No.-Pyris Diamond, Perkin Elmer, Singapore, in nitrogen atmosphere using platinum crucible with alpha alumina powder as reference. All the experiments were conducted in the temperature range between 30 and 600 °C in nitrogen atmosphere. A constant heating rate of 20 °C min−1 was employed.3. Results and discussion
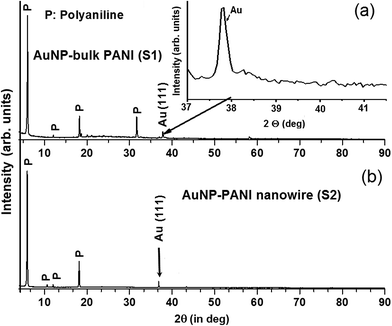
XRD patterns of AuNPs embedded in bulk PANI and in PANI nanowire are shown in Fig. 1a and b, respectively. Both the profiles show five fairly sharp peaks, four of which may be ascribed to crystalline PANI while one to crystalline Au, denoted by P and Au, respectively, in Fig. 1. For the bulk PANI–AuNP sample, diffraction peaks appear at 2θ = 6.21°, 12.12°, 18.4°, 31.81° and 38.21°. The first four peaks are due to PANI, while the one appearing at 38.21° is due to (111) reflection from AuNPs (JCPDS 4-784). The XRD profile of PANI nanowire–AuNP sample is similar to that of bulk PANI–AuNP with some minor differences – a very weak additional peak at 10.6° is observed in the nanowire hybrid while the peak at 31.81°, ascribed to the reflections from (006) plane of PANI is absent.31 The sharp peak centered at 2θ = 6.21°, present in both the samples, is related to the periodicity along the PANI chain.32 The peaks at 2θ = 10.6° and 12.12° correspond to reflections from (020) and (002) planes, respectively.31,32 The appearance of the very small signal at 10.6° for the PANI nanowire is probably due to the fact that random orientations of a large number of small crystals exposes larger number of (020) planes which are otherwise difficult to detect in the bulk counterpart. Nevertheless, the XRD result supports monoclinic model of the PANI crystal structure.Fig. 2a and b, respectively present low and high magnification bright field HRTEM micrographs of AuNPs prepared by citrate reduction method. The citrate protected AuNPs are spherical in shape having average diameter of approximately 20 ± 1 nm and a distribution represented by the histogram shown in Fig. 2c. The crystalline nature and typical strain concentrations observed in AuNPs prepared via this route is clear from Fig. 2b, which captures an isolated NP with diameter ∼20 nm. The (111) exposed plane of Au is marked for clarity. The selected-area electron diffraction pattern (SAEDP) corresponding to Fig. 2a, is shown as inset, Fig. 2a. The ring like patterns with diffused spots confirms the polycrystalline nature and formation of nanocrystalline AuNPs. The planes calculated from SAEDP correspond to the (111), (200), (220) and (311) reflections of AuNPs.
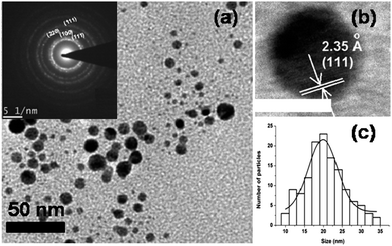 | ||
| Fig. 2 Bright field HRTEM image of AuNPs synthesized by citrate reduction method—(a) shows a low-magnification micrograph with nearly spherical particles; (b) high magnification image capturing an isolated AuNP with (111) exposed plane (the scale bar is 20 nm); (c) the histogram (obtained from particles in shown in Fig. 1a and other similar bright field images not shown here) representing the size distribution of the as prepared AuNPs showing a nearly Gaussian distribution with mean size ∼20 nm. | ||
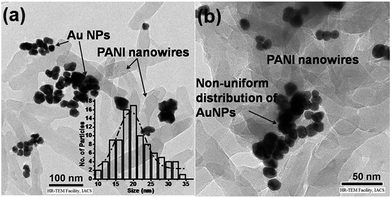
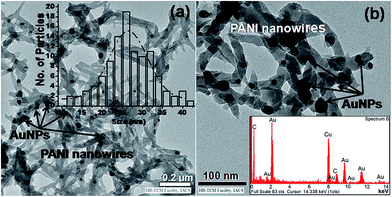
Fig. 3a and b, show the HRTEM micrographs of the nanocomposites prepared via physical blending of PANI-nanowire with AuNP colloid (S2). After repetitive and careful studies we have not observed any regular and unique decoration of AuNP in PANI environment. It is rather observed that AuNPs (with average diameter 18–20 ± 1 nm) tend to cluster on the surface of bundles of PANI nanowire, S2. On the other hand HRTEM micrograph of PANI nanowire decorated with AuNPs (Fig. 4a and b), prepared via in situ interfacial polymerization (S3) shows that AuNPs (diameter 25 ± 1 nm) are well-distributed on the surface of bundles of PANI nanowire. In both samples the bundles of PANI nanowires are 40–50 nm in diameter. Insets of Fig. 3a and 4a are the histograms representing particle size distributions of AuNPs in S2 and S3 respectively. We note that the average size and the size dispersion of the AuNPs is larger in case of the sample (S3) prepared by interfacial polymerization as compared to the sample (S2) prepared by physical bending. The presence of Au in the samples is confirmed from the EDX analysis shown as inset Fig. 4b. Although TEM images are not representative in the absence of a statistically large dataset, we note two features that may be considered as general features since they are observed in almost all the TEM micrographs, all of which are not shown here. First, as indicated above, the AuNPs tend to agglomerate in S2, while being nicely distributed (although not in any pattern) in S3, i.e. in the sample produced by interfacial polymerization; and second, the average particle size of AuNPs in sample S3 is apparently slightly larger than that in S2. The subtle difference of average particles size however is not clearly perceivable from visual inspection of the individual TEM images. However, this variation of size is apparent in every TEM image and hence we consider this to be a feature of the samples.
The difference in average size of the AuNPs in S2 and S3 is not expected as they originate from the same Au colloid. Difference in synthesis techniques for S2 and S3, accounts for this apparently anomalous result. During physical blending with PANI, colloidal stability of Au colloid is lost and the AuNPs are simply adsorbed on PANI surface (S2). Smaller AuNPs have better chance to get adsorbed and agglomerate on existing PANI nanowire surface. For S3, aniline monomers are in contact with AuNPs so that they are adsorbed on the surface of AuNP prior to polymerization. Therefore, PANI nanowire starts growing on AuNP surface which is also clear from the respective TEM images (Fig. 4). Smaller AuNPs in this case can get the prior chance to form larger particles via Ostwald ripening, i.e. at the cost of their surface energy. AuNPs having larger size and surface area are more effective to support the growth of PANI chains and for that reason larger AuNPs are more visible in the TEM image of S3.
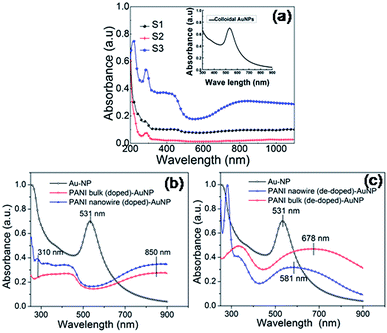
UV-vis spectra of Au colloid and that of the PANI–Au hybrids are shown in Fig. 5a. We should ideally keep the concentration of PANI–AuNP same for all solutions/dispersions; however, the amount of AuNP incorporated in the samples could not be controlled. Signature LSPR peak (λSPR) of citrate protected AuNPs colloid is observed at 531 nm (inset, Fig. 5a). The absorption profiles of different PANI–AuNP composites as shown in Fig. 5a–c are largely dominated by the characteristics of doped and dedoped PANI. The peak at ∼300 nm and a broad hump starting beyond 700 nm and peaking at ∼850 nm for the bulk and nanowire samples are characteristics of π–π* and bipolaron band transitions in PANI, respectively.33,34 After composite formation a blue shift of the π–π* transition band is observed.35 Interestingly, from the absorption profiles of the PANI–AuNPs hybrid system shown in Fig. 5a–c, we see that spectral features of doped PANI (bulk or nanowire) is nearly retained in the corresponding composites while LSPR peak of AuNPs is fully suppressed. The disappearance of the LSPR peak is independent of the morphology (bulk or nanowire) of PANI as well as the process of combination (physical blending or in situ polymerization). The complete suppression of the plasmon peak of AuNPs, along with the appearance of the absorption features of PANI is clearly seen in Fig. 5b. Absence of AuNPs absorption peak has also been reported earlier and is termed as ‘damping of localized surface plasmons’.36,37 This phenomenon is attributed to carrier injection from AuNPs to the highly conductive PANI environment. In such ambience SPs are delocalized so that it is no longer possible to optically excite them to leave a signature peak in the UV-vis profile. This result however indicates that PANI and AuNPs are very closely associated in the composites and strong electronic interaction takes place between them as PANI is in doped state. In the dedoped state PANI is non-conducting and plasmon energy is no longer channeled to the absorption band, making it possible to optically excite the local plasmon. It may therefore be expected that when PANI is dedoped, the plasmon features should reappear. This is exactly what we observe in Fig. 5c. It confirms the fact that after dedoping PANI by adding alkali to the system, the LSPR peak of Au reappears in the spectrum and overlaps with the exciton transition band of PANI to form an extended hump as seen in the UV-vis curves of Fig. 5c. Due to this overlap and possibly due to remnant electronic interaction between the metallic electrons and the PANI, the plasmon peaks do not reappear in their original position. For our systems the plasmon peaks red-shift to 581 nm and 678 nm for nanowire and the bulk samples, respectively.
The strong electronic association also explains the simple mechanism of formation of this composite. Some crystallinity is generally observed for PANI which we have prepared via ultrasonic and sonochemical methods, while the polymer synthesized under conventional conditions is essentially amorphous.38 During the formation of the composite, due to electrostatic force of attraction between positive surface of AuNPs and PANI-nanowire surface, AuNPs are dispersed on PANI-nanowire resulting in the formation of the composite. Due to the high surface area PANI-nanowire plays an important role for attachment of AuNPs on its surface.
It is generally understood that CPs with long range π-electron delocalization behave like metals in their doped state and as semiconductors in their neutral undoped state.39 Hence, one may expect luminescence from such CPs in their undoped state. Based on this rather simplified understanding there has been some studies on PL from PANI during the last few years.40–42 However, these studies have reported a wide variety of results which neither point toward any trend nor shed much light on the origin of PL from PANI. For example, Jayamurugan et al.40 have reported PL peaks ranging from 359 to 530 nm, which appear as spikes for HCl and H2SO4 doped PANI. Babu et al.43 have reported PANI emission spectra characterized by broader Gaussian peaks centered around 322, 581, and 644 nm for both organic and inorganic acid doped samples. A much broader single peak emission around 450 nm from exactly similarly doped PANI was reported by Amrithesh et al.44 Raigaonkar et al.45 reported multiple Gaussian peaks for anthracene doped PANI and the PL maxima were found at 383 nm, 405 nm and 428 nm. Ameen et al.46 however, found single PL maxima for PANI at ∼424 nm, while Li et al.47 reported pH dependent yellow orange emission with a typically non-Gaussian PL profile having a sharp peak at ∼580 nm. de Melo and co-workers,30 found that emission maxima for PANI appear at wavelength of 470–480 nm and 420–440 nm, for acidic and alkaline media.
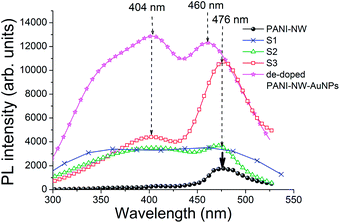
We see clearly from Fig. 6 that the PL profiles, obtained by exciting the samples with 280 nm UV, are apparently very different from each other (excitation energy was determined roughly from absorption and PL excitation studies). The presence (or absence) of AuNPs quite dramatically modifies both the profile as well as the PL intensity for all the composites under consideration. It should be noted that while comparing intensities, the sample sizes and the geometry of the set up for recording PL were kept nearly identical. Yet, comparison of intensities of two different samples could be prone to several errors. A more accurate quantity to compare is the integrated QY estimated by an integrating sphere. Here too exact quantitative comparison of PL QYs should be carefully scrutinized as the quantities of nanowire and NPs present in different samples need to be same for any meaningful evaluation. Samples for QY measurement were carefully prepared so as to ensure similar concentrations of AuNPs and PANI in all the samples. Subsequently, similar dimensions of the solid samples were introduced inside the integrating sphere and PL QYs were estimated following method suggested by Pålsson and Monkman,29 and de Mello et al.30 Following such careful scrutiny in sample preparation and QY measurement we see that the integrated QY increases from ∼2.6% for PANI nanowire to ∼4.8% for sample S2 and to nearly 10% for S3. Although we do not quantitatively compare the PL QYs due to the unavoidable problems discussed above, we clearly note that interaction of AuNPs and PANI nanowire enhances the QY and the PL count increases substantially for all the composite systems, particularly for samples S2 and S3. Other than the increase in QY and intensity we note the following important features from the PL characteristics: (i) the bulk PANI composite (S1) has a very broad featureless emission over a wide range from 345–480 nm; (ii) all the PANI-nanowire based composites appear to have a minimum of two peaks, one in the deep violet region (404 nm) and another in the blue-green region (around ∼475 or 460 nm); (iii) the 404 nm peak for PANI-nanowire appears as a very weak shoulder; (iv) the PL peak positions for both the AuNP–PANI-nanowire composites, S2 and S3, appear at the same positions; (v) the high energy peak becomes more dominant along with the appearance of a shoulder at ∼375 nm for the de-doped sample; and (vi) the lower energy peak for the de-doped sample is blue-shifted compared to that of the doped samples. All these features point towards one fact – a very strong and sensitive electronic interaction between PANI and AuNPs, which we have already inferred from the absorption results. The electronic interactions modify the electronic states as well as the lifetimes of the photo-excited carriers which consequently modifies the emission characteristics.
The origin of PL from such CPs is usually understood to be due to the delocalized π-conjugated electrons.48–50 Photoemission from PANI is an exciton dominated process and the singlet excitons are mostly responsible because CPs cannot produce the spin flip necessary for an optical transition.51 The higher energy emission peak in PANI can therefore be attributed to the π–π* transition of the benzenoid unit of polyaniline. UV irradiation excites singlet excitons which get trapped in the benzoid units and decay radiatively accounting for visible PL. Since triplet excitons cannot produce PL in CPs,52 it is logical to expect more intense emission if the π-conjugation increases. Now, we have seen from the structural investigations that there is an enhanced crystallinity in the PANI-nanowire and in the PANI-nanowire AuNP composite systems compared to bulk PANI, under the present synthesis conditions. This increase in ordered arrangement of the benzoid and quinonoid units in the nanoforms is accounted for ordered growth and greater π-conjugation and consequently more intense PL from PANI. The process of AuNP attachment onto PANI is also associated with charge transfer between the species, which we have not investigated here. Charge transfer and other processes of AuNP conjugation with PANI is bound to alter the interfacial electronic states due to overlap of the electronic wavefunctions. Now, had the origin of PL from PANI based system been polaronic rather that excitonic, we would not have expected such a significant impact of AuNPs. This is because formation of polaron-like traps cannot be affected by the electric fields of the AuNPs. Therefore, alteration of the PL peaks, (most dominant ∼16 nm red shift in the de-doped system) further supports excitonic origin of PL and reinforces that strong electronic interactions are present between. As AuNPs are better dispersed in sample S3, a larger area of AuNPs are in contact with PANI compared to S2 where agglomeration leads to more Au–Au interfaces. Probably this leads to relatively enhanced PL from S3 than sample S2. A deeper understanding of the origin of each individual PL peak and their modification however, warrants a separate investigation.
Finally, thermal stability of the bare PANI nanowire and composites e.g. S1, S2 and S3 were investigated by thermal analyzer TG-DTA. In case of PANI nanowire (Fig. 7a), a mass loss of ∼3% at temperature range ∼40–200 °C indicates that moisture must be embedded in the outer layers of material. The decomposition is ∼85% at temperature around ∼370–390 °C due to the release of organic moieties e.g., C, H, N and complete decomposition of PANI.53 DTA of PANI shows two transitions corresponding to the two transitions of the TG curve. In case of S1 composite (Fig. 7b) a mass loss of ∼8% at around 40–100 °C indicates loss of lattice water molecules. Mass loss of ∼68%, at temperature around ∼330–350 °C occurs due to the loss of organic moieties like C, H, and N and complete decomposition of bulk PANI. The TG curve S2 (Fig. 7c) shows ∼14% weight loss in the range of 40–260 °C, attributed to the loss of water and acid dopants. There is also a large weight loss e.g., ∼85% in the temperature range from ∼300 to 420 °C, attributed to the similar reason i.e. oxidation of the skeletal polyaniline nanowire chain like structures lead to their complete decomposition.53 Interestingly, in case of S3 (Fig. 7d) ∼26% weight loss is observed around at 50–220 °C, 48% weight loss at around ∼250–374 °C and loss of ∼75% at temperature around ∼375–530 °C indicating much better thermal stability of this composite. In correspondence, the DTA curves exhibit a well-defined endothermic peak (Fig. 7) that confirms the decompositions. Greater thermal stability, especially in case of S2 and S3 compared to bare PANI nanowire indicates the development of thermally stable nanocomposites. This in turn points towards strong electronic interaction between the AuNPs and the polyaniline nanowire, which endow them with stronger resistance against thermal agitation. Maximum thermal stability was observed in the case of S3, which may be due to better attachment of AuNPs within the matrices of PANI nanowire.
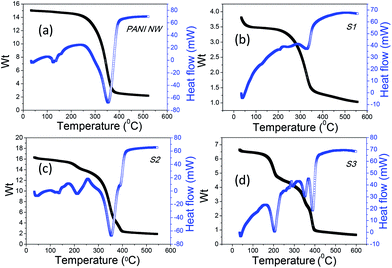 | ||
| Fig. 7 Thermogravimetric curves, TG (collected in nitrogen) and DTA for the samples: (a) PANI nanowire (b) S1 (c) S2 (d) S3. | ||
4. Conclusion
Successful dispersion of AuNPs on bundles of PANI-nanowire and bulk polyaniline matrices is capable of forming Au–PANI nano composite system. The composite exhibits well defined crystalline features corresponding to both Au and PANI. Polycrystalline AuNPs tend to agglomerate in PANI when they are physically blended, while they are well distributed in a network of PANI when produced by interfacial polymerization. Irrespective of the route of preparation, there is a strong electronic interaction between encapsulated AuNPs and the shell of oxidized PANI, which is evident from both absorption and emission features. The PANI-nanowire AuNP system exhibit strong room temperature PL with emission peaks in the deep violet and blue green region. The origin of this visible luminescence is excitonic and hence affected by the plasmonic field of the AuNPs. Such solid-state composites with enhanced luminescence provides excellent platform for development of devices, particularly bio-sensors with enhanced properties.Acknowledgements
RG acknowledges SERC-DST for financial assistance. AS acknowledges Dr Jiten Ghosh, Scientist, CSIR-CGCRI for XRD based support.References
- M. H. Carlos, N. Chartuprayoon, S. C. Hernández, Y. Choa and N. V. Myung, Nano Today, 2013, 8, 39 CrossRef.
- S. Kadkhodazadeh, J. R. de Lasson, M. Beleggia, H. Kneipp, J. B. Wagner and K. Kneipp, J. Phys. Chem. C, 2014, 118, 5478 CAS.
- K. M. Mayer and J. H. Hafner, Chem. Rev., 2011, 111, 3828 CrossRef CAS PubMed.
- T. K. Sau, A. L. Rogach, F. Jäckel, T. A. Klar and J. Feldmann, Adv. Mater., 2010, 22, 1805 CrossRef CAS PubMed.
- S. Eustis and M. A. El-Sayed, Chem. Soc. Rev., 2006, 35, 209 RSC.
- N. Verellen, P. V. Dorpe, C. Huang, K. Lodewijks, G. A. E. Vandenbosch, L. Lagae and V. V. Moshchalkov, Nano Lett., 2011, 11, 391 CrossRef CAS PubMed.
- C. Li, H. Bai and G. Shi, Chem. Soc. Rev., 2009, 38, 2397 RSC.
- A. G. MacDiarmid, Angew. Chem., 2001, 40, 2581 CrossRef CAS.
- H. D. Tran, D. Li and R. B. Kaner, Adv. Mater., 2009, 21, 1487 CrossRef CAS.
- S. Nambiar and J. T. W. Yeow, Biosens. Bioelectron., 2011, 26, 1825 CrossRef CAS PubMed.
- Y. Z. Long, M. M. Li, C. Gu, M. Wan, J. L. Duvail, Z. Liu and Z. Fan, Prog. Polym. Sci., 2011, 36, 1415 CrossRef CAS.
- J. E. Beesley, in Colloidal Gold: Principles, Methods and Applications, ed. M. A. Hayat, Academic Press, San Diego, 1989, vol. 1, pp. 421 Search PubMed.
- S. K. Ghosh and T. Pal, Chem. Rev., 2007, 107, 4797 CrossRef CAS PubMed.
- J. A. Creighton, C. G. Blatchford and M. G. Albrecht, J. Chem. Soc., Faraday Trans. 1, 1979, 75, 790 CAS.
- S. Y. Lin, S. W. Liu, C. M. Lin and C. H. Chen, Anal. Chem., 2002, 74, 330 CrossRef CAS PubMed.
- I. El-Sayed, H. Xiaohua and M. A. El-Sayed, Nano Lett., 2005, 5, 829 CrossRef CAS PubMed.
- Y. Cheng, W. Yong, J. L. Marty and Y. Xiurong, Biosens. Bioelectron., 2011, 26, 2724 CrossRef PubMed.
- X. P. Liu, Z. H. Zhou, L. L. Zhang, Z. Y. Tan, G. L. Shen and R. Q. Yu, Chin. J. Chem., 2009, 27, 1855 CrossRef CAS.
- M. Angelopoulos, A. Ray, A. G. MacDiarmid and A. J. Epstein, Synth. Met., 1987, 21, 21 CrossRef CAS.
- E. Song and J. W. Choi, Nanomaterials, 2013, 3, 498 CrossRef CAS PubMed.
- A. G. Macdiarmid, J. C. Chiang, A. F. Richter and A. J. Epstein, Synth. Met., 1987, 18, 285 CrossRef CAS.
- C. Dhand, M. Das, M. Datta and B. D. Malhotra, Biosens. Bioelectron., 2011, 26, 2811 CrossRef CAS PubMed.
- M. M. Alam, J. Wang, Y. Guo, S. P. Lee and H. R. Tseng, J. Phys. Chem. B, 2005, 109, 12777 CrossRef CAS PubMed.
- J. Turkevich, P. C. Stevenson and J. A. Hillier, Discuss. Faraday Soc., 1951, 11, 55 RSC.
- G. Frens, Nature, 1973, 20, 241 Search PubMed.
- X. Ji, X. Song, J. Li, Y. Bai, W. Yang and X. Peng, J. Am. Chem. Soc., 2007, 129, 13939 CrossRef CAS PubMed.
- W. S. Huang, B. D. Humphrey and A. G. MacDiarmid, J. Chem. Soc., Faraday Trans. 1, 1986, 82, 2385 RSC.
- J. Huang, S. Virji, B. H. Weiller and R. B. Kaner, J. Am. Chem. Soc., 2003, 125, 314 CrossRef CAS PubMed.
- L. O. Pålsson and A. P. Monkman, Adv. Mater., 2002, 14, 757 CrossRef.
- J. C. de Mello, H. F. Wittmann and R. H. Friend, Adv. Mater., 1997, 9, 230 CrossRef CAS.
- Y. Gao, Z. H. Kang, X. Li, X. J. Cuia and J. Gong, CrystEngComm, 2011, 13, 3370 RSC.
- E. Jin, X. Lu, X. Bian, L. Kong, W. Zhang and C. Wang, J. Mater. Chem., 2010, 20, 3079 RSC.
- M. G. Han, S. K. Cho, S. G. Oh and S. S. Im, Synth. Met., 2002, 126, 53 CrossRef CAS.
- P. S. Khiew, N. M. Huang, S. Radiman and M. S. Ahmad, Mater. Lett., 2004, 58, 516 CrossRef CAS.
- M. Amrithesh, S. Aravinda, S. Jayalekshmia and R. S. Jayasree, J. Alloys Compd., 2008, 449, 176 CrossRef CAS.
- Y. R. Leroux, J. C. Lacroix, K. I. Chane-Ching, C. Fave, N. Félidj, G. Lévi, J. Aubard, J. R. Krenn and A. Hohenau, J. Am. Chem. Soc., 2005, 127, 16022 CrossRef CAS PubMed.
- Z. Peng, L. Guo, Z. Zhang, B. Tesche, T. Wilke, D. Ogermann, S. Hu and K. Kleinermanns, Langmuir, 2006, 22, 10915 CrossRef CAS PubMed.
- Handbook of Conducting Polymers, ed. T. A. Skotheim, R. L. Elsenbaumer and J. R. Reynolds, Marcel Dekker, New York, 2nd edn, 1998, p. 27 Search PubMed.
- L. Akcelrud, Prog. Polym. Sci., 2003, 28, 875 CrossRef CAS.
- P. Jayamurugan, R. Mariappan, V. Ponnuswamy, H. Manikandan, S. Asokan and S. Saravanan, J. Opt., 2011, 122, 2083 CAS.
- Z. Liu, Y. Zhu, L. Wang, C. Ding, N. Wang, M. Wan and L. Jiang, Macromolecules, 2011, 32, 512 CAS.
- P. S. Antonel, E. Völker and F. V. Molina, Polymer, 2012, 53, 2619 CrossRef CAS.
- V. J. Babu, S. Vempati and S. Ramakrishna, Mater. Sci. Appl., 2013, 4, 1 CAS.
- M. Amrithesh, S. Aravind, S. Jayalekshmi and R. S. Jayasree, J. Alloys Compd., 2008, 458, 532 CrossRef CAS.
- B. V. Raigaonkar, L. P. Vijayan, S. Chawla, R. N. Dubey and M. S. Qureshi, Synth. Met., 2011, 161, 348 CrossRef CAS.
- M. S. Ameen, S. Akhtar, Y. S. Kim, O. B. Yang and H. S. Shin, Colloid Polym. Sci., 2011, 289, 415 Search PubMed.
- X. Li, H. Huanga, Z. Kanga, Y. Liua, J. Liub and S. T. Lee, Mater. Chem. Phys., 2010, 124, 60 CrossRef CAS.
- K. G. B. Alves, E. F. Melo, C. A. S. Andrade and C. P. de Melo, J. Nanopart. Res., 2013, 15, 1339 CrossRef.
- R. H. Friend, R. W. Gymer, A. B. Holmes, J. H. Burroughes, R. N. Marks, C. Taliani, D. D. C. Bradley, D. A. Dos Santos, J. L. Brédas, M. Lögdlund and W. R. Salaneck, Nature, 1999, 397, 121 CrossRef CAS.
- J. Y. Shimano and A. G. MacDiarmid, Synth. Met., 2001, 123, 251 CrossRef CAS.
- S. Cha, Y. Hong, J. Yang, I. Maeng, S. Jae Oh, K. Jeong, J. S. Suh, S. Haam, Y. M. Huh and H. Choi, J. Phys. Chem. C, 2013, 117, 20371 CAS.
- A. Kohler, J. S. Wilson and R. H. Friend, Adv. Mater., 2002, 14, 701 CrossRef CAS.
- R. V. Salvatierra, M. M. Oliveira and A. J. G. Zarbin, Chem. Mater., 2010, 22, 5222 CrossRef CAS.
| This journal is © The Royal Society of Chemistry 2017 |

