 Open Access Article
Viscosity-dependent frequency factor for modeling polymerization kinetics
Harith Al-Moameri *ab,
Luay Jafb and
Galen J. Suppesb
aDepartment of Chemical Engineering, University of Missouri-Columbia, W2033 Lafferre Hall, Columbia, Missouri 65211, USA. E-mail: hha46d@mail.missouri.edu; almoamerih@gmail.com
bMaterial Engineering Department, College of Engineering, University of Mostansiriyah, Baghdad, Iraq
First published on 17th May 2017
Abstract
The simulation of polymer-forming reactions can be a powerful tool to reduce the time and cost of developing new polymer formulations; formulations that can be potentially both more sustainable and less costly. A critical aspect of advancing such simulations is the reduction in the number of fitted parameters, and more specifically, the identification of fundamentally-correct parameters that can be applied to a range of reactions as opposed to parameters specific to each reaction. This paper presents an innovative approach focusing on the frequency factor of the Arrhenius equation resulting in insight to how this frequency factor is a characterization of mass transfer that can be broadly applied to a range of similar reactions. The result is a reduction in the number of fitted parameters needed for simulation and providing a more fundamental, efficient, and robust method to simulate thermoset polymerization reactions. Impacts of mass transfer limitations due to the large increase of resin viscosities during thermoset polymer reactions were reflected in the frequency (pre-exponential) factor of Arrhenius equation. By representing the frequency factor as the sum of viscosity-dependent and a viscosity-independent terms to account the impact of inter- and intra-molecular diffusion/movement of the reacting moieties in the resin, the same pre-exponential factor was able to be used for catalytic and non-catalytic paths. Impacts of catalysts were reflected in lower activation energies. Temperature profiles of urethane gel reactions were used to characterize the reactivities of different polyols based on the fractional content of primary (versus secondary) hydroxyl moieties. This approach the simulation results of reaction temperature show good agreement with the experimental data.
Introduction
Polyurethane demand is growing 5% every year due to its versatile and high performance in many applications.1–3 Thermosetting reaction of polyurethane is a complex process with over a dozen degrees of freedom. For these reasons, there is a desire to use simulation to predict key parameters used to design processes for making polyurethane devices such as car seat cushions and refrigerator insulation.Generally, polyurethane is a matrix of organic chains joined by urethane molecules and is produces from the reaction of alcohol and isocyanate groups.4–6 The general gelling reaction of polyurethane can be written as:
 | (1) |
The kinetics of polyurethane reaction has been the subject of interest of many researchers. Grepinet et al.12 develop a method to characterize the kinetic parameters of the reaction of toluene diisocyanate (TDI) and poly(propylene glycol) using 1H-NMR. This method was able to determine six individual rate constants and to study the influence of the temperature using SIMULBATCH soft-ware.
Deng and Martin13 treated the intra-diffusion of the thermosetting polymer chains as a process parallel to the diffusion of the ionic species and developed a model for estimating the average diffusion coefficient in the curing system based on the dielectric measurement of the ionic conductivity and the dipole relaxation time. The study provided an insight for the relation between diffusion-controlled cure kinetics and structure–property for thermoset reactions.
Liu et al.14 suggest a concise expression of reaction kinetics of stepwise polymerization in diffusion controlled regime using Monte Carlo simulation and scaling analysis. The simulation study shows two regions for reaction-controlled and diffusion-controlled. The suggested expression relates the average degree of polymerization to the initial concentration and reaction time through a power law dependence.
Król15 developed a mathematical model of a complex system of ordinary differential equations for the reaction of TDI and 1,4-butanediol by following Flory's assumptions for 32 subsequent and parallel polyurethane reactions. The model assumed different reactivates for the isocyanate groups. Good agreement was obtained with the experimental data.
These studies were limited to specific recipes, non-catalysed reactions, and did not study the impact of viscosity increase on reaction kinetics.
The simulation of polyurethane reactions of Ghoreishi et al.16 was based on the characterization of the reactivity of alcohol moieties of the polyols in terms of the fractional content of the primary, secondary and hindered secondary (tertiary) alcohol moieties concentration. The approach provided good simulation results of some polyols, however, there was deviations when higher or lower viscosity polyols were reacting. The higher viscosity leads to slower reaction rates.
Toward the goal of considering the impact of viscosity on reaction kinetics, Al-Moameri et al.17 developed two fundamental approaches to model mass transfer limitations of the reactive moieties during the reaction. The first approach was based on modelling the diffusion step using a power-law expression similar to that used for reactions and where the moieties are diffusing to form an encounter complex that might react to a product or diffused apart. The second approach considered the rate of change of viscosity in the Arrhenius pre-exponential factor. The work concluded that (a) both inter- and intra-molecular movements are critical reaction steps in polymer-forming reactions, (b) the frequency factor term can be successfully used to simulate the mass transfer step of this liquid phase polymer-forming reactions, (c) the same frequency factor term can be used for catalytic and non-catalytic paths where the impact of the catalyst is reflected in the activation energy, and (d) the “hindered” secondary alcohol term of previous works leading to this simulation study are not necessary.
The shortcomings of this research were it was limited to two known polyols that are having a high concentration of secondary alcohols moieties, and the research did not adequately summarize how the approach reduces the number of parameters needed to simulate polymerization. The current research is a follow-up work to the second approach.
Background
Shortcomings of the previous simulation
During thermoset polymerization, the viscosity is often increased several orders of magnitude starting from hundreds or few thousands of centipoises.18,19 Ghoreishi et al.'s simulating approach is able to predict reaction temperature profiles of various polyols in urethane formations with a method that assigned a fractional content of “hindered” secondary alcohol moieties. Al-Moameri et al.17 concluded that “hindered secondary polyols” were not a separate type of moiety, but rather, an artefact of the slow reaction due to viscosity increases that leads to a substantial decrease in diffusion rates and subsequently reaction rates. It was hypothesized that inaccuracies encountered with Ghoreishi et al.'s simulations when extrapolating reaction rate constants from one system to another were due to differences in viscosity, and that use of a constant pre-exponential factor of Arrhenius equation was insufficient approach to extrapolate the modelling toward using other polyols with a wider range of viscosity.Parameters for simulation
In general, many parameters were needed to simulate the reactions of polyurethane reactions. These parameters are (a) the physical properties of the reacting monomers and the produced urethane polymer which are obtained from literature or suppliers and (b) thermodynamic and kinetic parameters which are either obtained from literature, external experiments or fitted to get better simulation results. For a polyurethane gel reaction of one polyol reacting with isocyanate in the presence of a catalyst, eqn (2) lists the possible reactions of two multifunctional alcohol and isocyanate monomers:
 | (2) |
For these reactions, Table 1 shows that 68 fitted parameters were needed for simulation out of 80 parameters assuming constant physical properties (density, heat capacity, heat of reaction) in the range of reaction temperature (22–160 °C).
| Parameters needed | Source | # of parameters |
|---|---|---|
| Density | Obtained | 3 |
| Molecular weight | Obtained | 2 |
| Functionality | Obtained | 2 |
| Hydroxyl number | Obtained | 1 |
| Heat capacity | Obtained | 3 |
| Overall transfer coefficient | Obtained | 1 |
| Viscosity (group contribution parameters) | Fitted | 6 |
| Fraction alcohol moieties | Fitted | 2 |
![[thin space (1/6-em)]](https://www.rsc.org/images/entities/char_2009.gif) |
||
| Heat of reaction | ||
| Isocyanate in monomer + alcohol in monomer | Fitted | 3 |
| Isocyanate in polymer + alcohol in monomer | Fitted | 3 |
| Isocyanate in monomer + alcohol in polymer | Fitted | 3 |
| Isocyanate in polymer + alcohol in polymer | Fitted | 3 |
![[thin space (1/6-em)]](https://www.rsc.org/images/entities/char_2009.gif) |
||
| Activation energy of non-catalytic reaction of the moieties | ||
| Isocyanate in monomer + alcohol in monomer | Fitted | 3 |
| Isocyanate in polymer + alcohol in monomer | Fitted | 3 |
| Isocyanate in monomer + alcohol in polymer | Fitted | 3 |
| Isocyanate in polymer + alcohol in polymer | Fitted | 3 |
![[thin space (1/6-em)]](https://www.rsc.org/images/entities/char_2009.gif) |
||
| Activation energy of catalytic reaction of the moieties | ||
| Isocyanate in monomer + alcohol in monomer | Fitted | 3 |
| Isocyanate in polymer + alcohol in monomer | Fitted | 3 |
| Isocyanate in monomer + alcohol in polymer | Fitted | 3 |
| Isocyanate in polymer + alcohol in polymer | Fitted | 3 |
![[thin space (1/6-em)]](https://www.rsc.org/images/entities/char_2009.gif) |
||
| Frequency factor of non-catalytic reaction of the moieties | ||
| Isocyanate in monomer + alcohol in monomer | Fitted | 3 |
| Isocyanate in polymer + alcohol in monomer | Fitted | 3 |
| Isocyanate in monomer + alcohol in polymer | Fitted | 3 |
| Isocyanate in polymer + alcohol in polymer | Fitted | 3 |
![[thin space (1/6-em)]](https://www.rsc.org/images/entities/char_2009.gif) |
||
| Frequency factor of catalytic reaction of the moieties | ||
| Isocyanate in monomer + alcohol in monomer | Fitted | 3 |
| Isocyanate in polymer + alcohol in monomer | Fitted | 3 |
| Isocyanate in monomer + alcohol in polymer | Fitted | 3 |
| Isocyanate in polymer + alcohol in polymer | Fitted | 3 |
Heuristics and constitutive equations were adopted to reduce this large number of parameters to a more reasonable number. These heuristics were:
• The heat of reaction of alcohol and isocyanate moieties was the same regardless if the alcohol moiety is primary, secondary, or hindered secondary.
• The frequency factors and the activation energies of non-catalytic and catalytic reactions of alcohol moieties with the isocyanate are the same regardless if the alcohol or the isocyanate moieties were attached to a monomer or to a polymer.
Constitutive equations are defined as the relations between two physical quantities for a material. A constitutive equation for calculating the hydroxyl number from polyol molecular weight and functionality were used to reduce the number of parameters.
 | (3) |
For the viscosity modelling where a group contribution method was used, six fitted parameters were needed for calculating the viscosity of the polyol, isocyanate, and the urethane polymer as shown in eqn (4) where i refers to polyol, isocyanate, or polymer.
 | (4) |
Two constitutive equations were used for relating the fitted parameters of the urethane polymer to the polymer degree of polymerization as shown in eqn (5).
 | (5) |
The heuristics and the constitutive equations reduced the number of fitted parameters by less than one third (from 68 to 19) as shown in Table 2.
| Parameters needed | Source | # of parameters |
|---|---|---|
| Density | Obtained | 3 |
| Molecular weight | Obtained | 2 |
| Functionality | Obtained | 2 |
| Hydroxyl number | Calculated | 0 |
| Heat capacity | Obtained | 3 |
| Overall transfer coefficient | Obtained | 1 |
| Viscosity (group contribution parameters) | Fitted | 4 |
| Fraction alcohol moieties | Fitted | 2 |
| Heat of reaction | Fitted | 1 |
| Activation energy of non-catalytic reaction of the moieties | Fitted | 3 |
| Activation energy of catalytic reaction of the moieties | Fitted | 3 |
| Frequency factor of non-catalytic reaction of the moieties | Fitted | 3 |
| Frequency factor of catalytic reaction of the moieties | Fitted | 3 |
To follow-up the approach presented earlier by Al-Moameri et al.17 on considering the pre-exponential factor of Arrhenius equation as a frequency factor, the common form of Arrhenius equation for each polymerization reaction was revised to the following form to include the impact of inter- and intra-molecular diffusion.
Inter-molecular diffusion was assumed to proportional to reaction temperature and reversely with resin viscosity. Intra-molecular movement was assumed to be proportional to the reaction temperature. This assumption provides better simulation results compared to the previous assumption where it was proportional to the square root temperature.
 | (6) |
Eqn (6) was re-written in the following form where A′ depends whether the alcohol moieties are primary of secondary.
 | (7) |
Using this equation in this form for non-catalytic and catalytic reactions increase the number of fitted parameters of Table 2. Several constitutive equations and heuristics were adopted to reduce the fitted parameters. These heuristics were:
• The fraction of the hindered secondary alcohol moieties presented in previous simulation were dropped.
• A constitutive equation was assumed to relate the fitted parameters A′ and A1.
• The frequency factors of the catalytic path were set to be equal to the frequency factors of the non-catalytic path.
• The fitted parameter A′ for the reaction of the primary alcohol moieties is set as six times the frequency factor of the reaction of the secondary alcohol moieties.
• The activation energy for the secondary alcohol moieties reaction was set as 1500 greater than the that for the primary alcohol moieties reaction for catalytic and non-catalytic paths.
Table 3 shows a comparison of the equations used in this approach and the set of equations used in the previous simulations. The equations show that any urethane system of one polyol and one catalyst can be simulated using this approach if the fraction of primary alcohol moieties and the activation energy of the catalytic reaction of the primary alcohol moieties is known in addition to chemical and physical properties of the polyol and isocyanate. The other kinetic parameters are related to each other.
Table 4 shows that how the current approach of the current research reduces the number of fitted parameters needed for the gel reaction of polyurethane catalytic polymerization from 19 (as shown in Table 2) to 9.
| Parameters needed | Component | Test | Number of parameters |
|---|---|---|---|
| Density (O) | Polyol/isocyanate | Reported | 3 |
| Molecular weight (O) | Polyol/isocyanate | Reported | 2 |
| Functionality (O) | Polyol/isocyanate | Reported | 2 |
| Heat capacity (O) | Polyol/isocyanate/urethane | Reported | 3 |
| Overall transfer coefficient (O) | System (box) | Reported | 1 |
| Viscosity (group contribution parameters) (F) | Independent parameters depend on moiety | Viscosity study | 4 |
| Fraction alcohol moieties (F) | Polyol | Rxn study | 1 |
| Heat of reaction (F) | Moiety | Rxn study | 1 |
| Activation energy of non-catalytic reaction (F) | Moiety | Rxn study | 1 |
| Activation energy of catalytic reaction (F) | Moiety | Rxn study | 1 |
| Frequency factor of non-catalytic reaction (F) | Moiety | Rxn study | 1 |
| Frequency factor of catalytic reaction (F) | Moiety | Rxn study | 0 |
The novelty of this work relative to previous publications on this topic were:
(1) The current simulation provides a fundamental approach for considering the impact of mass transfer limitation in the calculation of the pre-exponential factor of Arrhenius equation.
(2) The number of fitted parameters of reaction rate constant needed to simulate polyurethane gelling reactions were successfully reduced.
(3) For a gel reaction of one polyol with isocyanate, the number of differential equations of the rate expressions were reduced from 12 to 8.
(4) The approach of the current research can successfully extrapolate to include the different formulation of different viscosities.
Experimental
Materials
PAPI (standard polymeric MDI) from Dow Chemical Co. was the isocyanate (A side) used in this study, Voranol 360 from Dow Chemical Co., Voranol 490 Dow Chemical Co., Poly G76-635 from FSI, Jeffol R-315x from FSI, DEG from Sigma-Aldrich and TEG from Alfa Aesar were the six polyols (B side) used in this study, and the specifications of each one are shown in Table 5. N,N-Dimethylcyclohexyl-amine (DMCHA) as catalyst 8, N,N,N′,N′′,N′′-pentamethyldiethylene-triamine (PMDETA) as catalyst 5 both from FSI and DABACO BL-17 catalyst from Air Products were used as amine based catalyst (Fomrez UL-29) from Galata Chemicals LLC was used as tin based catalyst in this study. Momentive L6900 was used as a surfactant, tris(1-chloro-2-propyl)phosphate (TCPP) was used as fire retardant and the amount of the surfactant and fire retardant were kept at 0.15% (mass fraction), the isocyanate index was kept at 1.1 for all reactions. Table 6 shows the recipes of the homogeneous reactions. The reaction temperature and viscosity change were obtained as temperature–time profiles and viscosity–time profiles.| Property | PMDI | DEG | TEG | V360 | V490 | R315x | PolyG |
|---|---|---|---|---|---|---|---|
| Density, g cm−3 | 1.23 | 1.118 | 1.125 | 1.081 | 1.11 | 1.07 | 1.08 |
| Average molecular weight | 369.9 | 106.12 | 150 | 728 | 460 | 534 | 600 |
| Functionality | 2.7 | 2 | 2 | 4.5 | 4.3 | 3 | 3 |
| Hydroxyl number, mg KOH per g | 134 | 1057 | 747.2 | 360 | 484.8 | 315 | 274 |
| Viscosity, mPa s at 25 °C | 150–220 | 35.7 | 49 | 3500 | 6180 | 2153 | 275 |
| NCO content by weight, % | 31.4 | — | — | — | — | — | — |
| Vapor pressure, mm Hg at 25 °C | <10−5 | — | — | — | — | — | — |
| Ingredient | Weight, g | |||||
|---|---|---|---|---|---|---|
| DEG | TEG | V360 | V490 | PolyG | Jeffol | |
| B-Side materials | ||||||
| Polyol | 10 | 10 | 25 | 20 | 15 | 20 |
| TCCP | 0.06 | 0.04 | 0.07 | 0.07 | 0.06 | 0.05 |
| L6900 | 0.06 | 0.04 | 0.07 | 0.07 | 0.06 | 0.05 |
![[thin space (1/6-em)]](https://www.rsc.org/images/entities/char_2009.gif) |
||||||
| A-Side materials | ||||||
| PMDI | 28.4 | 20.07 | 24.1 | 26.9 | 25.6 | 16.9 |
Gel preparation and data collection
The following steps were used in the gel experiments:(1) Polyols (B-side components), catalysts, surfactant and fire retardant were added into a paper cup, then the B-side components were mixed for 10 s.
(2) After that, pre-weighed isocyanate (A-side material) by syringe to reduce weight loss, then added and mixed with (B-side components) at the same speed for 10 s.
(3) Finally, the mixture left in the paper cup covered by polyurethane foam to insulate the reaction and to reduce the heat loss and reaction temperature is recorded or poured into a viscometer cup and viscosity is recorded.
All experiments were carried out at room temperature in order to avoid deviations in reaction kinetics and molecular weight of the polymer.20 A high speed mixer blade (2000 rpm) attached to a floor-model drill press was used to mix the chemicals, mixing rate was kept constant for all experiments as it may affect the viscosity profiles,21 LabVIEW soft-ware was used to monitor the reaction temperature versus reaction time with a type-k thermo-couple attached through a National Instruments SCB-68 box to a National Instruments PCI 6024E data acquisition card and Cole-Parmer Basic Viscometer used to measure viscosity in a wide range of centipoise (cp).
After surrogate primary and secondary polyol molecules were used to identify Arrhenius parameters of Table 3 for primary and secondary alcohol moieties, the fraction of primary alcohol moieties (parameter) was used to optimize this parameter to kinetic data on a polyol's reaction in the recipe of Table 6. In the solving of the ordinary differential equations of the model (and subsequent simulations), the concentrations of primary and secondary alcohol moieties were independently followed based on the initial conditions defined by eqn (8) and (9).
| C0P,Bmoi = XP,0 × C0,Bmoi | (8) |
| C0S,Bmoi = (1 − XP,0) × C0,Bmoi | (9) |
Results and discussion
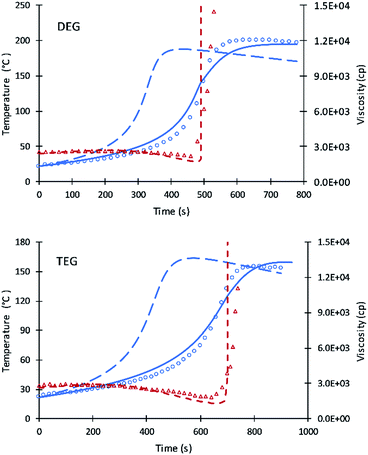
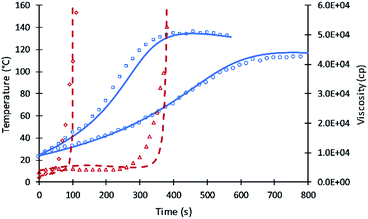
The kinetic equations used by Zhao et al.22–24 for calculating reactions rate constants for polyurethane polymerization reaction were revised using the modified Arrhenius equation of eqn (7) with a fraction of primary alcohol moieties (XP,0) in polyol monomers (no hindered secondary moieties) being the only polyol-dependent parameter determined from kinetic data. The heat of reactions and heat capacities of the primary and secondary alcohol moieties were assumed equal and have been adopted from the previous studies.16Unlike the previous study of Ghoreishi16 where 1-pentanol was used as a reference for obtaining the kinetic parameters of the fraction content of primary alcohol moieties, the current study uses DEG and TEG due to: (a) the more readily available data on viscosity and (b) the gel points of DEG and TEG formulations that allow parameters A′ and A1 to be decoupled. Fig. 1 shows the experimental data and simulation results of the gel reaction of DEG and TEG.
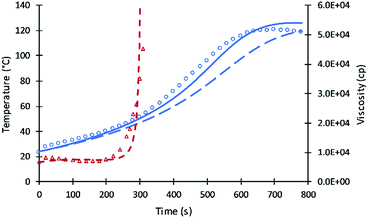
Compared to the results of the previous simulation, the Fig. 2 simulation shows considerably better agreement with experimental data of reaction temperature and resin viscosity with a slight deviation at the time of the maximum reaction temperature. These data were used to identify the parameters A′, A1, and EP for primary alcohol moieties reacting with PMDI.
To determine parameters for secondary moieties, V490 was assumed of having a 100% secondary alcohol moiety. The fit of the model to data are presented by Fig. 2; the fitted parameters were ES and A′S = A′/6. The good fit of the model to the data is shown by Fig. 3. This fit is better than pervious results despite the use of only two parameters.
In total, five parameters were fit to the surrogate molecules selected to represent 100% primary alcohol and 100% secondary alcohols. From this basis, different polyols were specified by a best fit of XP,0 to the data, and each catalyst was ultimately fitted to one parameter; that being the activation energies associated with that catalyst for primary moieties, EP,i for catalyst “i”. It was observed that ES,i = EP,i + 1500 provided a good fit to the data. This class of reactions (polyols reacting with PMDI) is specified by 3 frequency factor parameters and 1 + Y activation energies for a series including Y catalysts.
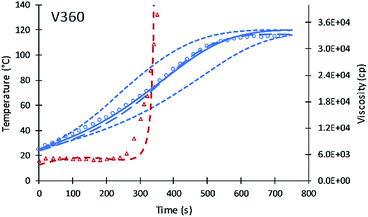
Contour plots for the different systematic content of fractional alcohol content of V360 are shown in Fig. 4. Contour plots provide a useful method to identify how the performance of different polyols at the different fractional content of alcohol moieties. The temperature profile is becoming faster at higher primary alcohol moiety content and slower as the secondary alcohol moiety content increases. The simulation was tested assuming XP,0 = 0 fractional content of primary alcohol moieties and a slower increase in temperature was obtained. The second test of XP,0 = 0.25 shows a model temperature profile with temperature increases faster than the data. The best fit for V360 was obtained at a XP,0 = 0.11. The new simulation shows good agreement with the previous simulation of Ghoreishi et al.16
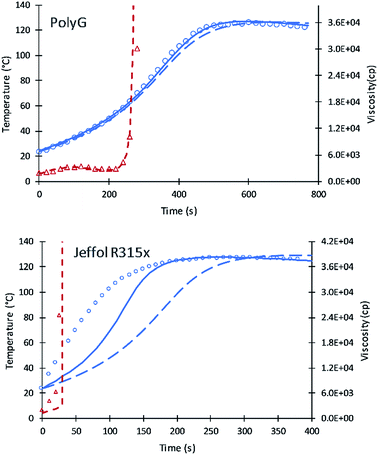
Simulation results of PolyG show good agreement with the experimental data and previous simulation. The fractional content of XP,0 = 0.25 provides a good fit to the experimental data.
Experimental results of Jeffol R315x show a rapid increase in reaction temperature as compared to other polyols. This variation may likely due to catalyst content, either added to the polyol are incorporated into the polyol mixture. A value of XP,0 = 0.75 was used which takes into account this inherent catalytic activity. Simulation of the current code shows better results compared to the previous simulation. Table 7 summarizes the fractional content of alcohol moieties of each polyol.
| Polyol | Current simulation | Previous simulation | |||
|---|---|---|---|---|---|
| Primary | Secondary | Primary | Secondary | Hindered secondary | |
| V490 | 0 | 1 | 0 | 0.25 | 0.75 |
| V360 | 0.11 | 0.89 | 0 | 0.05 | 0.95 |
| Jeffol R315x | 0.75 | 0.25 | 0.65 | 0 | 0.35 |
| PolyG | 0.25 | 0.75 | 0 | 0.3 | 0.7 |
Table 8 summarizes all the parameters needed for current approach simulation and how the number of fitted parameters reduced from those in Table 2.
| Parameters needed | Source | Component | Test | Parameters |
|---|---|---|---|---|
| Density | IO | Polyol/isocyanate | Reported | 3 |
| Molecular weight | IO | Polyol/isocyanate | Reported | 2 |
| Functionality | IO | Polyol/isocyanate | Reported | 2 |
| Heat capacity | IO | Polyol/isocyanate/urethane | Reported | 3 |
| Overall transfer coefficient | IO | System (box) | Reported | 1 |
| Viscosity (group contribution parameters) | IO | Independent parameters depend on moiety | Viscosity study | 4 |
| Heat of reaction | IO | Moiety | Rxn study | 1 |
| Fraction primary alcohol moieties of Z polyols | Fitted | Polyol | Rxn study | Z |
| Activation energy of non-catalytic reaction | Fitted | Moiety | Rxn study | 1 |
| Activation energy of “Y” catalyst | Fitted | Moiety-catalyst | Rxn study | Y |
| Frequency factor of non-catalytic reaction | Fitted | Moiety | Rxn study | 1 |
| Frequency factor of catalytic reaction | Fitted | Moiety | Rxn study | 0 |
Fig. 5 summarizes how the values of the frequency factors of primary alcohol moieties reactions depend on temperature (which changes with time) and depend on the gel point. The inter-molecular diffusion term increases when the viscosity decreases in the region before the gel point and decreases to zero at the gel point. The intra-molecular diffusion term increases with increasing reaction temperature. The value of the frequency factor depends on the change of reaction temperature and resin viscosity in the region before the gel point and depend on only reaction temperature after the gel point. The value of the frequency factor of DEG reaction shows higher values due to its lower viscosity compared to V360 and V490. What may appear as subtle differences in frequency factors can have a significant impact on adiabatic reaction systems.
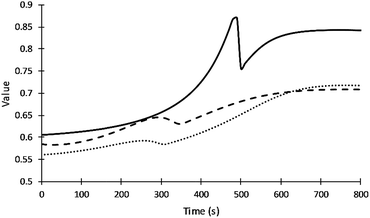 | ||
| Fig. 5 Values of the frequency factor of primary alcohol moieties reactions. Straight, dash and dot lines refer to DEG, V360, and V490 respectively. | ||
The successful simulation of the reaction of different polyols were tested for the reaction of two different mixtures of polyols as shown in Fig. 6. The first mixture of 50% V360 and 50% V490 shows good agreement with experimental data of temperature profile. Experimental data of viscosity profile shows variation compared to simulation result which may due to a slight error in experiment measurement. The second mixture of 50% V490, 25% Jeffol R315x, and 25% PolyG shows that simulation is slower than experimental data. This is attributed to the content of Jeffol R315x which shows a faster reaction temperature as shown in Fig. 4.
The simulation of the current code was extended to study the effect of catalyst in the polymerization reaction of polyurethane. The same frequency factor for non-catalytic path was used for the catalytic path and the impact of catalysts loading were reflected in lower activation energies. This approach provides a more fundamental understanding of catalyst role in chemical reactions.
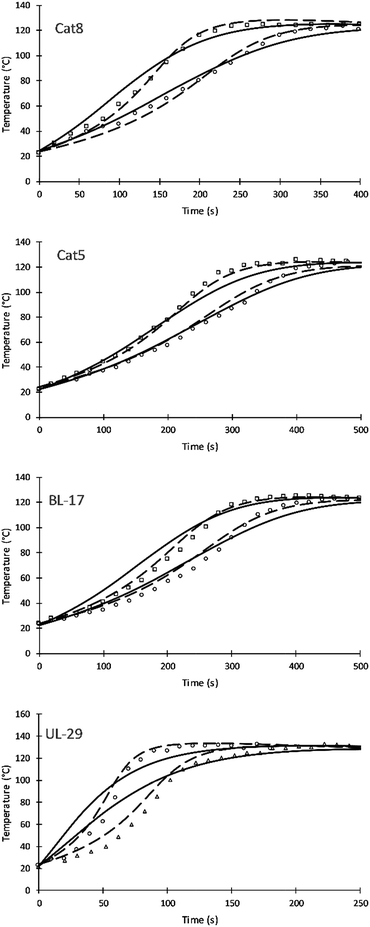
Four different catalyst were studied and simulated successfully. Fig. 7 shows the impact of three amine catalyst (Cat8, Cat5, and DBTDL BL-17) and one tin catalyst (Formez UL-29) at two loadings. Table 9 compares previous and current values of the activation energies for these catalysts. The simulation results of these catalysts show a variation compared to experimental results and previous simulation results of Zhao et al. These variations are likely attributed to (a) the fewer number of parameters used by this approach and (b) to the fact that catalytic reactions are following chain growth mechanisms as opposed to step growth mechanism suggested by the simulation. The tin catalyst shows more deviation to the experimental data of the current and previous simulations. This is attributed to the non-linear relation of the increase in catalytic rate and the catalyst loadings.24
| Catalysts | Current simulation | Previous simulation | ||
|---|---|---|---|---|
| EP (J mol−1) | EP (J mol−1) | ES (J mol−1) | EHS (J mol−1) | |
| Cat8 | 18![[thin space (1/6-em)]](https://www.rsc.org/images/entities/char_2009.gif) 500 500 |
37![[thin space (1/6-em)]](https://www.rsc.org/images/entities/char_2009.gif) 000 000 |
40![[thin space (1/6-em)]](https://www.rsc.org/images/entities/char_2009.gif) 000 000 |
42![[thin space (1/6-em)]](https://www.rsc.org/images/entities/char_2009.gif) 000 000 |
| Cat5 | 20![[thin space (1/6-em)]](https://www.rsc.org/images/entities/char_2009.gif) 000 000 |
32![[thin space (1/6-em)]](https://www.rsc.org/images/entities/char_2009.gif) 000 000 |
35![[thin space (1/6-em)]](https://www.rsc.org/images/entities/char_2009.gif) 000 000 |
36![[thin space (1/6-em)]](https://www.rsc.org/images/entities/char_2009.gif) 000 000 |
| BL-17 | 20![[thin space (1/6-em)]](https://www.rsc.org/images/entities/char_2009.gif) 500 500 |
0 | 38![[thin space (1/6-em)]](https://www.rsc.org/images/entities/char_2009.gif) 000 000 |
45![[thin space (1/6-em)]](https://www.rsc.org/images/entities/char_2009.gif) 000 000 |
| UL-29 | 16![[thin space (1/6-em)]](https://www.rsc.org/images/entities/char_2009.gif) 500 500 |
0 | 40![[thin space (1/6-em)]](https://www.rsc.org/images/entities/char_2009.gif) 000 000 |
78![[thin space (1/6-em)]](https://www.rsc.org/images/entities/char_2009.gif) 000 000 |
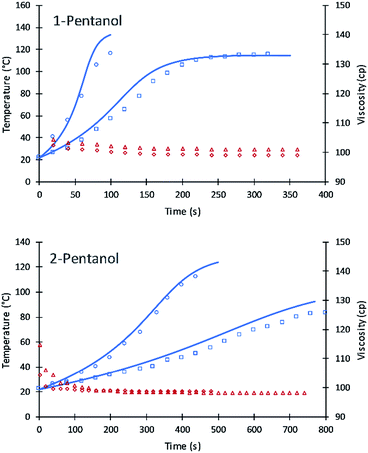
The values of A′ in eqn (7) for primary and secondary alcohol moieties were tested for simulating 1-pentanol and 2-pentanol. 1-Pentanol has one primary alcohol moiety (100% primary alcohol content) and 2-pentanol has one secondary alcohol moiety (100% secondary alcohol content). Toluene was added as a solvent to reduce the heat of the reactions. Average values of the viscosities (based on experimental measurement) were used to calculate the frequency factors. The fit of the simulation to data is summarized in Fig. 8.
The results are remarkably accurate considering that the simulation lines are purely predictive based on eqn (7) parameters fit to DEG and TEG. Numeric values of the frequency factors for 1-pentanol and 2-pentanol (as calculated upon substitution of temperature and viscosity values into eqn (7)) were initially at 2.3 due to the lower viscosity of these alcohols in the toluene diluent. These compare to 0.61 for DEG and accurately extrapolate the fitted parameters for DEG and V490 to 1-pentanol and 2-pentanol. Due to the low viscosity of the formulations, the inter-molecular diffusion term of eqn (7) is dominant. A slight variation in the new code for the two systems were observed which might be due to (a) using average viscosity for calculating rate constants or (b) error in the experiment results due to the evaporation of toluene at higher reaction temperatures.
The rate of intra-molecular movement was assumed to be proportional to reaction temperature as shown in eqn (7). Different values of the power of temperature were tested to provide the best fit to the data. Unlike the previous simulation of Al-Moameri et al.17 where the power was assumed 0.5, a power of 1 was found to provide the optimum value as shown in Fig. 9.
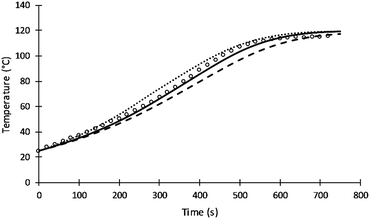 | ||
| Fig. 9 Simulation results of reaction temperature at different power of T of eqn (7). | ||
Conclusions
Adopting a computer program for simulating thermoset reactions provides a powerful tool for formulator to develop new formulations and to use less costly materials to obtain desirable material properties. This paper presents an innovation approach for simulating thermoset reactions that uses few fitted parameters that can be applied to a wide range of reagents.Arrhenius equation theory suggests that the frequency factor term is primarily dependent upon diffusion (which impacts frequency of collision) and steric hindrance (which impacts the efficiency of collisions in a manner independent of moiety energy surfaces). However, over a century of data on liquid phase reactions has left the impression that frequency factors are unique to molecules of reaction as opposed to a more-broader factor. The work presented in this paper has identified how a common frequency factor term can be shared over a range of polyol reagents; this observation was made possible because of the manner in which the viscosity of urethane thermoset reactions can change by orders of magnitude during the reaction.
This finding is significant from many perspectives because it:
• reduces the number of parameters needed to simulate reaction profiles over a class of reagents such as various polyols in urethane reactions,
• can provide a “base case” of trends in reaction rate constants of a range of molecules that can be used to identify more fundamentally correct activation energies and perturbations from expected behavior (that can be used to gain further insight), and
• generally advance theory, insight, and consistency when pursuing the attaining of the maximum information from reaction rate data.
For the urethane reactions of this study the number of parameters needed to perform simulation was reduced, where:
• This approach allowed alcohol moiety characterizations to be reduced to primary and secondary where a previous category of “hindered secondary” was dropped; the conclusion being that a phenomena associated with hindered secondary alcohols was actually due to variations in viscosity.
• What was previously “6Y + 6” fitted parameters for frequency factor and activation energies for a homogenous reaction and Y catalysts (for primary, secondary, and hindered secondary moieties) has become 3 frequency factor terms and “Y + 1” activation energies (for primary and secondary alcohols).
• The use of common frequency factor terms has led to consistent trends in activation energies where better catalysts provide lower activation energies.
• This work will lead to a revision of previously published kinetic parameters by these authors.
In this paper, the rate of inter-molecular movement (the rotational movements of segments) was assumed to be proportional to the reaction temperature to a power between 0.5 and 1.0 where a power of 1.0 was identified as providing the better fit to data. Also, the reaction rate constant for the reaction of primary alcohol moieties were set at six times the reaction rate constant of the secondary alcohol moieties. These studies provide a basis where a single activation energy for a new catalyst (possibly from a single data point) for this system can provide a reasonable characterization of the catalyst and simulation of the catalyst's impact. As more accurate simulations are needed; these base case parameters can be supplemented similar to the way the van der Waals equation supplements the ideal gas law.
From a broader perspective, it is common practice to ignore the temperature dependence of the frequency factor; this can lead to errors in the activation energy by forcing all temperature dependence upon the activation energy term. This masking meaningful trends in activation energies can stunt the advancement of science.
Acknowledgements
The authors thank the Higher Committee for Education Development (HCED) in Iraq for their financial support.References
- K. Ashida, Polyurethane and Related Foams: Chemistry and Technology, Taylor & Francis, 2006 Search PubMed.
- G. Avar, Polyurethanes, Kunststoffe international, 2008 Search PubMed.
- Rohan, Polyurethane Foam Market worth 74.24 Billion USD by 2021, http://www.marketsandmarkets.com/PressReleases/polyurethane-foams.asp.
- M. Szycher, Szycher's handbook of Polyurethane, CRC Press, 2013 Search PubMed.
- Z. Wirpsza and T. J. Kemp, Polyurethanes: chemistry, technology, and applications, E. Horwood, 1993 Search PubMed.
- G. Hinrichsen, Acta Polym., 1994, 45, 398 Search PubMed.
- G. Wu, J. Li, C. Chai, Z. Ge, J. Lin and Y. Luo, RSC Adv., 2015, 5, 97710–97719 RSC.
- A. J. Peacock and A. Calhoun, in Polymer Science, ed. A. J. P. Calhoun, Hanser, 2006, pp. 365–381, DOI:10.3139/9783446433434.025.
- D. Klempner, V. Sendijarevíc and R. M. Aseeva, Handbook of Polymeric Foams and Foam Technology, Hanser Publishers, 2004 Search PubMed.
- H. Al-Moameri, Y. Zhao, R. Ghoreishi and G. J. Suppes, J. Appl. Polym. Sci., 2015, 132, 7 CrossRef.
- H. Al-Moameri, Y. S. Zhao, R. Ghoreishi and G. J. Suppes, Ind. Eng. Chem. Res., 2016, 55, 2336–2344 CrossRef CAS.
- B. Grepinet, F. Pla, P. Hobbes, T. Monge and P. Swaels, J. Appl. Polym. Sci., 2001, 81, 3149–3160 CrossRef CAS.
- Y. Deng and G. C. Martin, Macromolecules, 1994, 27, 5141–5146 CrossRef CAS.
- J. Liu, Y. Ma, R. Wu and M. Yu, Polymer, 2016, 97, 335–345 CrossRef CAS.
- P. Król, Prog. Mater. Sci., 2007, 52, 915–1015 CrossRef.
- R. Ghoreishi, Y. Zhao and G. J. Suppes, J. Appl. Polym. Sci., 2014, 131 Search PubMed.
- H. Al-Moameri, R. Ghoreishi and G. Suppes, Chem. Eng. Sci., 2017, 161, 14–23 CrossRef CAS.
- M. V. Smoluchowski, Z. Phys. Chem., 1917, 92, 124 Search PubMed.
- K. Suematsu, Eur. Phys. J. B, 1998, 6, 93–100 CrossRef CAS.
- P. Kolodziej, C. W. Macosko and W. E. Ranz, Polym. Eng. Sci., 1982, 22, 388–392 CAS.
- T. Ando, Polym. J., 1993, 25, 1207–1209 CrossRef CAS.
- H. Al-Moameri, R. Ghoreishi, Y. Zhao and G. J. Suppes, RSC Adv., 2015, 5, 17171–17178 RSC.
- Y. Zhao, M. J. Gordon, A. Tekeei, F. H. Hsieh and G. J. Suppes, J. Appl. Polym. Sci., 2013, 130, 1131–1138 CrossRef CAS.
- Y. Zhao and G. J. Suppes, Catal. Surv. Asia, 2014, 18, 89–98 CrossRef CAS.
| This journal is © The Royal Society of Chemistry 2017 |


