 Open Access Article
Flexible alternating current electroluminescent ammonia gas sensor†
Jaruwan En-ona,
Adisorn Tuantranontb,
Teerakiat Kerdcharoenc and
Chatchawal Wongchoosuk *a
*a
aDepartment of Physics, Faculty of Science, Kasetsart University, Chatuchak, Bangkok 10900, Thailand. E-mail: chatchawal.w@ku.ac.th
bThailand Organic and Printed Electronics Innovation Center, National Electronics and Computer Technology Center, Klong Luang, Pathumthani 12120, Thailand
cDepartment of Physics, Center of Nanoscience and Nanotechnology, Faculty of Science, Mahidol University, Bangkok 10400, Thailand
First published on 17th March 2017
Abstract
In this work, the fabrication and performance of flexible alternating current electroluminescent (AC-EL) devices for ammonia (NH3) detection at room temperature are presented for the first time. The AC-EL gas sensor was fabricated by the screen-printing of a ZnS:Cu,Cl phosphor and PEDOT:PSS sensing layers. The effects of parameters including applied voltage, excitation frequency and waveform on light emission and luminance intensity of the AC-EL gas sensor were systematically investigated. From gas-sensing characterization, the AC-EL gas sensor exhibited very high selectivity and a linear response to NH3 in the concentration range of 100–1000 ppm at room temperature. A sensing mechanism of the EL gas sensor was proposed based on the resistance change of the PEDOT:PSS sensing layer via a charge-transfer process.
Introduction
Electroluminescence (EL) can be defined as the non-thermal generation of light from the excitation of a phosphor by an electric field, in which the electrical energy is converted into visible radiation. The electroluminescence phenomenon was first discovered by Destriau1 from the application of a high electric field to inorganic ZnS phosphor powders in 1936. Later in 1963, M. Pope and his co-workers2 observed electroluminescence in organic materials such as anthracene crystals. In the late 1980s, organic electroluminescent devices received increasing attention leading to the first commercial electroluminescent product based on molecular organic light-emitting diodes (LEDs) launched by Pioneer.3 In general, electroluminescent devices can be classified into two main groups including high-field electroluminescence and light emitting diodes (LEDs). In comparison with LEDs and organic LEDs, alternating current electroluminescence (AC-EL) is a relatively mature technology for flat and flexible large-area light sources.4 AC-EL is a purely capacitive electrical load, in which charges need not to be transported over extended distances. It offers high luminance with high resolution, good contrast and brightness, long lifetime, and lightweight.5 The AC-EL device basically comprises a phosphor layer sandwiched between two flat electrodes. When a sufficiently high voltage is applied across the electrodes, energetic electrons between layers are injected into the conduction band of phosphor resulting in the creation of electron–hole pairs, the activation of luminescent centers and the emission of photons.6 Moreover, the electron–hole injection and light emission efficiencies of AC-EL devices can be enhanced by employing additional layers or some modified electrodes such as FeCl3-intercalated few-layer graphene,7 tetrapod-like ZnO whiskers,8 graphene coated Cu–Ni,9 SiC whiskers,10 Al/MWCNT11 and PEDOT:PSS.12Electroluminescent devices can be used not only for flexible flat display panels but also for pressure measurements. Y. Matsuda and his co-workers13 reported the fabrication of electroluminescent pressure sensors based on oxygen quenching of electroluminescence. Its oxygen detection capability leads to an interesting question whether electroluminescent devices can be applied to detect other gases or volatile organic compounds like gas sensors? In principle, gas sensors can be classified based on their transduction principles into five types including optical, thermal, chemoresistive, electrochemical and gravimetric.14 Among these, chemoresistive gas sensors have been most widely employed in gas measurement systems because the setup is more straightforward and less expensive than other transduction methods. In addition, chemoresistive properties can be found in electrode materials of electroluminescent devices such as graphene and PEDOT:PSS.15 Therefore, it should be possible to design and construct an electroluminescent device for gas-sensing applications. In this paper, a flexible electroluminescent NH3 gas-sensing device is designed and developed for the first time. Additionally, the relationships between applied voltage, waveform as well as excitation frequency and the light-emitting efficiency of the designed EL sensors have been systematically investigated. Furthermore, the gas-sensing mechanism of this EL sensor has been proposed and discussed in details.
Experimental
Fabrication of electroluminescent gas sensor
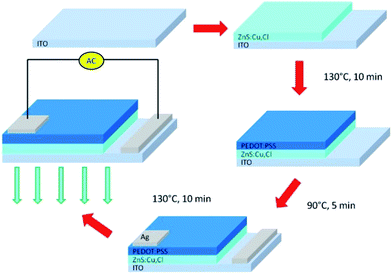
The fabrication process of the proposed EL gas sensor is displayed in Fig. 1. The EL gas sensor consists of a transparent conductive layer, a phosphor layer, a gas sensing layer and contact electrodes. It was fabricated by multilayer thick film coatings based on the screen-printing method. Firstly, 0.25 g of ZnS:Cu,Cl phosphor was screen-printed on indium tin oxide (ITO) coated polyethylene terephthalate (PET) film and baked at 130 °C for 10 minutes. Next, the gas sensing layer comprising PEDOT:PSS (solid content 1.3–1.7%) mixed with dimethyl sulfoxide (DMSO) at a weight ratio of 94![[thin space (1/6-em)]](https://www.rsc.org/images/entities/char_2009.gif) :
:![[thin space (1/6-em)]](https://www.rsc.org/images/entities/char_2009.gif) 6 wt% was coated on the phosphor layer and baked at 90 °C for 5 minutes. A silver electrode was then screen-printed over the gas sensing layer and baked at 130 °C for 10 minutes. Finally, the EL gas sensor was soaked in acetone for 30 minutes in order to activate the PEDOT:PSS gas sensing layer.
6 wt% was coated on the phosphor layer and baked at 90 °C for 5 minutes. A silver electrode was then screen-printed over the gas sensing layer and baked at 130 °C for 10 minutes. Finally, the EL gas sensor was soaked in acetone for 30 minutes in order to activate the PEDOT:PSS gas sensing layer.
Optical measurement
The EL devices were driven by an AC voltage with excitation frequencies in the range of 100–3000 Hz. The luminance (cd m−2) and optical properties of EL devices were measured by TES 137 luminance meter and Avaspec-2048 spectroscopy equipped with a 2048-pixel CCD linear array (sensitivity of 310![[thin space (1/6-em)]](https://www.rsc.org/images/entities/char_2009.gif) 000 counts per μW per ms). The effects of driving parameters including excitation frequency, applied voltage and waveform on light emission and luminance intensity were investigated. All experiments were repeated three times and average values were reported.
000 counts per μW per ms). The effects of driving parameters including excitation frequency, applied voltage and waveform on light emission and luminance intensity were investigated. All experiments were repeated three times and average values were reported.
Gas sensing measurement
Sensing properties of the fabricated EL gas sensor were tested in a dark borosilicate 15 L glass chamber. Various volatile organic compounds (VOCs) including ammonia, ethanol, methanol, and toluene with various concentrations were individually introduced into the chamber. In addition, the effect of oxygen content on sensor response was evaluated by adding oxygen gas to increase oxygen concentration up to 80 vol%. Fiber optic probe connecting to Avaspec-2048 spectroscopy was mounted above the EL gas sensor device for measurement of light intensity. All experiments were performed in air at room temperature (26 ± 2 °C) and the relative humidity of 55 ± 2%. The data were recorded every second using LabVIEW via a USB DAQ device for subsequent analyses.Results and discussion
The photographs of the fabricated EL gas sensor are illustrated in Fig. 2. When a high voltage (>100Vrms) is applied across the Ag electrodes, electrons accelerated by ballistic energies16 are injected into the conduction band of the ZnS:Cu,Cl phosphor. The electrons excite the electrons of luminescent impurities from their ground state to their excited states by ionization and impact excitation resulting in the generation of photons by radiative recombination17,18 as demonstrated in Fig. 2a. In this device structure, light can emit from both sides (ITO and PEDOT:PSS) due to their good transparent properties. However, some dark spots are observed on the PEDOT:PSS side when the power is on and become invisible when the power is off as shown in Fig. 2b and c, respectively. These spots may come from some surface defects on the PEDOT:PSS layer produced by the low cost screen-printing process. To evaluate the effect of the imperfection of PEDOT:PSS layer on the gas-sensing performances, three EL gas sensors with different dark spots sites were tested towards 100 ppm NH3 as displayed in Fig. S1 of the ESI.† It was found that the measured EL sensor responses of three sensors were insignificantly different. Therefore, the influence of dark spots on the EL sensing performances is negligible and the reproducibility of screen-printed EL sensor is acceptable for practical applications.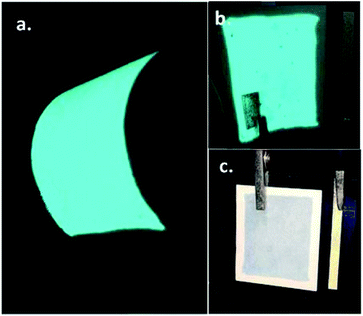 | ||
| Fig. 2 Photographs of an electroluminescent gas sensor: (a) under bending on ITO side and without bending on PEDOT:PSS side with (b) power-on and (c) power-off. | ||
Fig. 3 shows the dependence of average luminance of EL gas sensor devices under various applied voltages, frequencies and waveforms. Three EL gas sensors were fabricated and optical measurements were repeated three times, yielding nine luminance values for each condition. It is found that the standard deviations of luminance represented as error bars in Fig. 3 are in the range of 5–10% of mean values. It can be seen that the luminance rises monotonically with increasing frequency for all applied waveforms as seen in Fig. 3a. In addition, the luminance increases nonlinearly with increasing applied voltage (Vrms) for different applied waveforms as shown in Fig. 3b. The luminous emission characteristics of the EL gas sensors are similar to those of standard AC electroluminescence devices comprising an insulating buffer layer.19–21 An increase of applied frequency enhances the rate of injected electrons from the interface states into the phosphor layer while a higher applied voltage creates a higher electric field that can cause more ionization and impact excitation by accelerated electrons in the luminescent center generating more electron–hole pairs. Therefore, the luminance of EL gas sensor increases with increasing frequency and applied voltage (Vrms). Moreover, it can be observed that the luminance of EL gas sensor excited by triangle waveform is higher than those excited by sine and square ones, respectively. The results can be related to the difference of peak voltage at a given root-mean-square (rms) voltage for distinct waveforms. At the same rms voltage value (Vrms), the peak voltage values of triangle waveform are higher than those of sine and square ones, respectively.
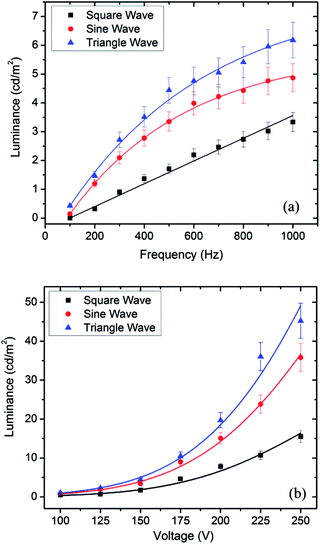 | ||
| Fig. 3 Luminance as a function of (a) frequency (Vrms = 150 V) and (b) voltage (f = 500 Hz) with different waveforms. | ||
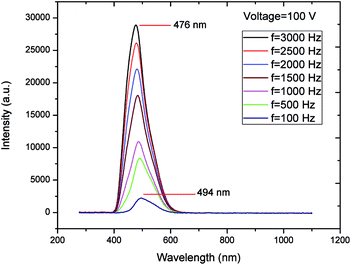
The EL spectra of EL gas sensor excited at various frequencies exhibit a single emission band as demonstrated in Fig. 4. In addition, the peak wavelength shifts from green color (494 nm) to blue color (476 nm) as the frequency increases from 100 to 3 kHz. It is well known that the ZnS:Cu,Cl phosphor can generate blue–green emission from transitions between dopants Cu (acceptors), Cl (donors) and host material (ZnS).4,22,23 When a low excitation frequency is applied (<1500 Hz), the green emission arises from the transition from Cl at the S site to Cu at the Zn site. At a high excitation frequency, there are sufficient energies to activate blue emission due to the transition from Cl at the S site to the interstitial Cu site.24
Fig. 5 shows the dynamic response of the EL gas sensor towards 100 ppm NH3 at room temperature. It is seen that the EL intensity decreases upon exposure to NH3 and returns to the initial value upon the removal of NH3 in air. In addition, the EL gas sensor exhibits good reversibility for several sensing cycles. The reversibility of EL gas sensor up to 9 cycles is displayed in Fig. S2 of the ESI.† The EL response behavior can be attributed to the adsorption and desorption of NH3 molecules on the PEDOT:PSS layer. The sensing mechanism will be discussed subsequently. Moreover, the EL intensity does not significantly change upon exposure to other VOCs such as ethanol, methanol, and toluene as well as oxygen at a high concentration (80 vol%) (see Fig. S3 of the ESI†). Thus, the EL sensor exhibits excellent NH3 selectivity against ethanol, methanol, toluene and oxygen.
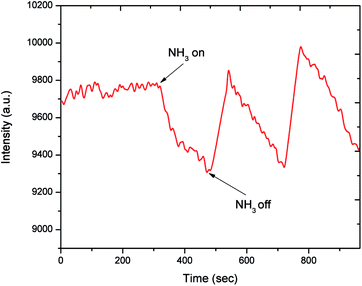 | ||
| Fig. 5 Dynamic response of an EL gas sensor to 100 ppm NH3 at room temperature (Vrms = 150 V, f = 500 Hz). | ||
The performance of the EL gas sensor is primarily evaluated in term of the sensor response defined as ((I0 − Ig)/I0) × 100% where I0 and Ig represent the EL intensities in air and target gas, respectively. The gas response of EL sensor as a function of NH3 concentration at room temperature is displayed in Fig. 6a. It can be seen that the gas response of EL sensor increases linearly with increasing NH3 concentration in the range of 100–1000 ppm. At 1000 NH3 ppm, the EL intensity reduces more than 14% with no change of frequency. In order to investigate the influence of bending on the sensing properties of EL gas sensor, the sensor response to 100 ppm NH3 was measured under bending with varying angle (θ) from 10° to 50° as demonstrated in Fig. 6b. It is evident that the sensor response of EL gas sensor remains almost unchanged even when the bending angle increases to 50%. Hence, the EL gas sensor is highly flexible and can consistently operate under large bending conditions.
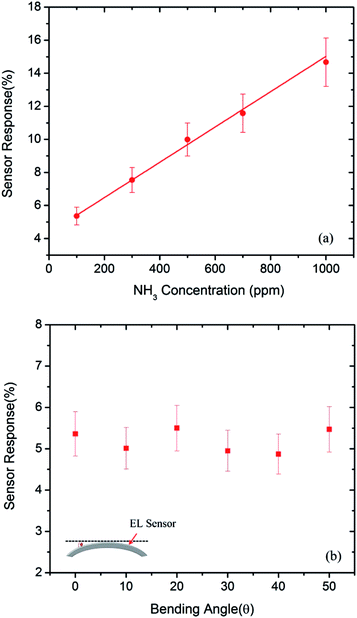 | ||
| Fig. 6 Sensor response of EL gas sensors to (a) various NH3 concentrations between 100 and 1000 ppm and (b) 100 ppm NH3 as a function of bending angle at room temperature (Vrms = 150 V, f = 500 Hz). | ||
To study the influence of PEDOT:PSS thickness on the sensor response, the PEDOT:PSS thickness was varied from 1 to 3 layers by repeating the screen printing process. With increasing the PEDOT:PSS thickness, the conductivity of gas sensing layer increases proportionally to the number of screen-printing cycles. The sensor response of the AC-EL device is improved as the number of printing cycles increases from 1 to 2 but then decreases when the number increases further to 3 as shown in Fig. S4 of the ESI.† The reduction of sensor response at 3 layers may arise from a decreased luminescent efficiency due to lower film porosity when PEDOT:PSS thickness is too high.25
Sensing mechanism of the EL gas sensor for NH3 detection may be based on the resistance change of PEDOT:PSS sensing layer via direct charge transfer between NH3 molecules and PEDOT:PSS surface. It is well-known that an AC-EL device electrically behaves as an RC equivalent circuit.26 When the sheet resistance increases, the emission intensity will decrease due to lower exciting electric field on the EL phosphor.21 When NH3 molecules are adsorbed on the PEDOT:PSS surface by physisorption, the holes of PEDOT:PSS interact with the electron-donating NH3 molecules. This interaction is specifically strong because the NH3 molecules can directly bind to H atoms of PEDOT:PSS via the lone-pair electrons of the N atoms with a binding distance of 2.00 Å and the interaction energy of 6.596 kcal mol−1 according to a theoretical study using the self-consistent charge density functional tight-binding method.27 As a result of the charge transfer from the adsorbed NH3 molecules to PEDOT:PSS, the number of holes decreases and the depletion region thickness of the PEDOT:PSS layer increases, leading to the expansion of the neutral polymer backbone region and the increase in the resistance. Thus, the EL intensity of sensor reduces in the presence of NH3 and recovers to its initial value in the absence of NH3 molecules.
To verify our proposed mechanism, the PEDOT:PSS layer was deposited on a transparent plastic substrate (PET) having prepatterned Ag interdigitated electrodes by the screen printing method. The resistance of PEDOT:PSS layer was then continuously measured while subjected to various NH3 pulses. The relationship of PEDOT:PSS resistance as a function of NH3 concentration is displayed in Fig. S5 of the ESI.† It demonstrates a linear dependence of PEDOT:PSS resistance on the NH3 concentration in accordance with the sensor response behavior of EL gas sensor as previously shown in Fig. 6a.
Conclusions
In summary, an innovative flexible AC electroluminescent device for NH3 detection was successfully fabricated by the screen-printing method. The luminous emission behavior of the AC-EL gas sensor was found to be similar to that of the standard AC-EL device comprising an insulating buffer layer. In addition, the luminance of EL gas sensor device was considerably dependent on excitation frequency, applied voltage and waveform signal. At the same excitation frequency and applied rms voltage, the triangle waveform signal offered higher luminance than sinusoidal and square ones. Additionally, the luminance increased monotonically as the excitation frequency and applied voltage increased. Moreover, the emitted color from ZnS:Cu,Cl phosphor turned from green to blue when the excitation frequency increased from 100 to more than 1500 Hz. Regarding the gas-sensing behaviors, the EL device based on the PEDOT:PSS sensing layer with ZnS:Cu,Cl phosphor exhibited high selectivity and good response to NH3 in the concentration range of 100–1000 ppm. The sensing mechanism was proposed based on the resistance change of PEDOT:PSS sensing layer due to charge transfer interaction with NH3 molecules. The results presented in this work may thus open the door to the new applications of EL, which combine display and gas sensor technologies into one smart wearable device in the future.Acknowledgements
This work was financially supported by a grant (TRF-CHE Research Grant for New Scholar) from Thailand Research Fund and Commission on Higher Education (MRG5980019). T. K. expresses his gratitude to Mahidol University.References
- G. Destriau, J. Chem. Phys., 1936, 33, 587–588 CAS.
- M. Pope, H. P. Kallmann and P. Magnante, J. Chem. Phys., 1963, 38, 2042–2043 CrossRef CAS.
- S. Thomas, K. Joseph, S. K. Malhotra, K. Goda and M. S. Sreekala, Polymer Composites, Nanocomposites, WILEY-VCH, 2013, p. 259, ISBN 978-3-527-65240-2 Search PubMed.
- M. Bredol and H. S. Dieckhoff, Materials, 2010, 3, 1353–1374 CrossRef CAS.
- Y. A. Ono, Electroluminescent Displays, World Scientific, River Edge, NJ, 1995, ISBN 981-0-219-210 Search PubMed.
- V. Wood, J. E. Halpert, M. J. Panzer, M. G. Bawendi and V. Bulovic, Nano Lett., 2009, 9, 2367–2371 CrossRef CAS PubMed.
- E. T. Alonso, G. Karkera, G. F. Jones, M. F. Craciun and S. Russo, ACS Appl. Mater. Interfaces, 2016, 8, 16541–16545 Search PubMed.
- L. Wen, N. Liu, S. Wang, H. Zhang, W. Zhao, Z. Yang, Y. Wang, J. Su, L. Li, F. Long, Z. Zou and Y. Gao, Opt. Express, 2016, 24, 23419–23428 Search PubMed.
- Z.-D. Liu, Z.-Y. Yin, Z.-H. Du, Y. Yang, M.-M. Zhu, L.-H. Xie and W. Huang, Nanoscale, 2014, 6, 5110–5115 RSC.
- B. Wagstaff and A. Kitai, J. Lumin., 2015, 167, 310–315 CrossRef CAS.
- J. Xu, G. M. Smith, C. Dun, Y. Cui, J. Liu, H. Huang, W. Huang and D. L. Carroll, Adv. Funct. Mater., 2015, 25, 4397–4404 CrossRef CAS.
- J. H. Lee, S. H. Cho, R. H. Kim, B. Jeong, S. K. Hwang, I. Hwang, K. L. Kim, E. H. Kim, T. Woo Lee and C. Park, J. Mater. Chem. C, 2016, 4, 4434–4441 RSC.
- Y. Matsuda, K. Ueno, H. Yamaguchi, Y. Egami and T. Niimi, Sensors, 2012, 12, 13899–13906 CrossRef CAS PubMed.
- D. James, S. M. Scott, Z. Ali and W. T. O'Hare, Microchim. Acta, 2005, 149, 1–17 CrossRef CAS.
- Y. Seekaew, S. Lokavee, D. Phokharatkul, A. Wisitsoraat, T. Kerdcharoen and C. Wongchoosuk, Org. Electron., 2014, 15, 2971–2981 CrossRef CAS.
- M. A. Berding, S. Krishnamurthy, A. Sher and A.-B. Chen, J. Cryst. Growth, 1988, 86, 33–38 Search PubMed.
- J. F. Wager and P. D. Keir, Annu. Rev. Mater. Sci., 1997, 27, 223–248 CrossRef CAS.
- A. N. Krasnov, Displays, 2003, 24, 73–79 CrossRef CAS.
- W. Kaiser, R. P. Marques and A. F. Correa, IEEE Trans. Ind. Appl., 2013, 49, 2361–2369 CrossRef.
- Z. G. Wang, Y. F. Chen, P. J. Li, X. Hao, J. B. Liu, R. Huang and Y. R. Li, ACS Nano, 2011, 5, 7149–7154 CrossRef CAS PubMed.
- C. Schrage and S. Kaskel, ACS Appl. Mater. Interfaces, 2009, 1, 1640–1644 CAS.
- Y. Y. Chen, J. G. Duh, B. S. Chiou and C. G. Peng, Thin Solid Films, 2001, 392, 50–55 CrossRef CAS.
- G. Sharma, S. D. Han, J. D. Kim, S. P. Khatkar and Y. W. Rhee, Mater. Sci. Eng., B, 2006, 131, 271–276 CrossRef CAS.
- J. Y. Kim, M. Jong Bae, S. H. Park, T. Jeong, S. Song, J. Lee, I. Han, J. B. Yoo, D. Jung and S. G. Yu, Org. Electron., 2011, 12, 529–533 CrossRef CAS.
- B. Hu, D. Li, O. Ala, P. Manandhar, Q. Fan, D. Kasilingam and P. D. Calvert, Adv. Funct. Mater., 2011, 21, 305–311 CrossRef CAS.
- S. Tiwari, S. Tiwari and B. P. Chandra, J. Mater. Sci.: Mater. Electron., 2004, 15, 569–574 CrossRef CAS.
- A. Marutaphan, Y. Seekaew and C. Wongchoosuk, Nanoscale Res. Lett., 2017, 12, 90 CrossRef PubMed.
Footnote |
| † Electronic supplementary information (ESI) available. See DOI: 10.1039/c7ra01318c |
| This journal is © The Royal Society of Chemistry 2017 |

