 Open Access Article
Creative Commons Attribution 3.0 Unported Licence
Electrospun poly(acrylic acid)/poly(vinyl alcohol) nanofibrous adsorbents for Cu(II) removal from industrial plating wastewater†
Jeong-Ann Parka,
Jin-Kyu Kangb,
Seung-Chan Leeb and
Song-Bae Kim *bc
*bc
aCenter for Water Resource Cycle Research, Korea Institute of Science and Technology, Seoul 02792, Republic of Korea
bEnvironmental Functional Materials and Water Treatment Laboratory, Seoul National University, Seoul 08826, Republic of Korea. E-mail: songbkim@snu.ac.kr; Tel: +82-2-880-4587
cDepartment of Rural Systems Engineering, Research Institute for Agriculture and Life Sciences, Seoul National University, Seoul 08826, Republic of Korea
First published on 24th March 2017
Abstract
Nanofibrous adsorbents were fabricated by electrospinning with a blend solution of poly(acrylic acid) (PAA) and poly(vinyl alcohol) (PVA) polymers and used for copper (Cu(II)) removal from industrial plating wastewater. Fourier-transform infrared spectrometry analysis demonstrated that a new peak appeared at 1617 cm−1 due to the interactions between Cu(II) and carboxyl oxygen on the surfaces of the PAA/PVA nanofibrous adsorbents during Cu(II) removal in the plating wastewater. X-ray photoelectron spectroscopy analysis showed that the Cu 2p peak at a binding energy of 932 eV appeared in a wide scan of the nanofibrous adsorbents after Cu(II) removal in the plating wastewater. The carboxyl groups on the surfaces of the nanofibrous adsorbents could provide sorption sites for Cu(II) removal. Laboratory experiments in synthetic solutions showed that the nanofibrous adsorbents were effective in Cu(II) removal. The nanofibrous adsorbents had a maximum Cu(II) removal capacity of 49.3 mg g−1 with a far higher selectivity for Cu(II) over Ni(II) in a binary system. Also, the nanofibrous adsorbents could be regenerated and reused for Cu(II) removal through successive adsorption–desorption processes. Batch experiments in industrial plating wastewater (Cu(II) concentration = 430.06 mg L−1) demonstrated that the nanofibrous adsorbents had Cu(II) removal capacity of 25.8–33.6 mg g−1 in the adsorbent dose of 0.4–2.0 g L−1. However, the removal of other heavy metal ions (Ni, Zn, etc.) in the wastewater by the nanofibrous adsorbents was negligible. The nanofibrous adsorbents were also applied through filtration tests for Cu(II) removal from the wastewater under dynamic flow conditions.
1. Introduction
Copper (Cu) is widely used in industries such as metal plating, mining, paint manufacturing, electronics, and electrical fields. A large amount of copper is released into bodies of water, causing serious environmental problems.1,2 The United State Environmental Protection Agency (USEPA) sets the permissible limit of Cu(II) in industrial effluents as 1.3 mg L−1, whereas the World Health Organization (WHO) provides an interim drinking water guidance of Cu(II) as 2.0 mg L−1.3 Various technologies including chemical, biological, and membrane treatments have been applied to remove the copper concentration in wastewater before its discharge.4 Among these methods, adsorption is widely used for copper removal mainly because of its cost-effectiveness and simplicity.4,5Electrospinning is a simple and convenient way to fabricate nanofibers as randomly oriented non-woven mats.6 Electrospun nanofibers have been widely used as nanofibrous adsorbents for removal of heavy metals from aqueous solutions, due to their large specific surface area, high porosity, and small interconnected pores.7–11 Two approaches are found in the literature regarding synthesis of electrospun nanofibers for Cu(II) removal. The first approach is related to the synthesis of pure electrospun nanofibers for Cu(II) removal. Some researchers have fabricated electrospun nanofibers using solvent-soluble polymers, including polyacrylonitrile (PAN), poly(vinyl phenol) (PVP), poly(vinyl chloride) (PVC), polyamide (PA), polysulfone (PS), keratin, cellulose, and silk fibroin/nylon-6.12–18 Among electrospun nanofibers from solvent-soluble polymers, PAN nanofibers have been most commonly used in the adsorption of Cu(II) because the amino groups on the surface of PAN form strong complexes with Cu(II).19–23 Even with its good performance for Cu(II) removal, however, PAN dissolves in toxic organic solvent due to its high crystallinity, causing environmental problems during nanofiber synthesis. Other researchers have fabricated electrospun nanofibers using environmentally friendly and water-soluble polymers such as chitosan, poly(vinyl alcohol) (PVA), and poly(acrylic acid) (PAA).24–27 Among water-soluble polymers, chitosan has been most frequently used for the synthesis of electrospun nanofibers for Cu(II) removal because it has both hydroxyl and amine groups on its surface.24,28–30 However, electrospinning of chitosan is difficult due to its high viscosity, poor water solubility, and low chain flexibility, and additives are required to overcome these properties.28,29 Conversely, PAA and PVA polymers easily dissolve in water and can be electrospun to synthesize nanofibers.
The second approach is proceeding to fabrication of electrospun nanofibrous composites for Cu(II) removal using polymers such as PVA and PAA. Through functionalization of the nanofibers with nano-sized inorganic particles such as zero-valent iron (ZVI),27 ZnO,25 thiol-functionalized SiO2,31,32 and graphene oxide,33 Cu(II) removal from aqueous solutions can be enhanced. In nanofibrous composites, inorganic functional materials play a major role as adsorbents for Cu(II) removal. Polymers are fabricated into electrospun nanofibers, mainly to support inorganic particles, with a minor role for Cu(II) removal. Although the nanofibrous composites had a higher Cu(II) removal capacity than pure nanofibers, they have disadvantages for water filtration applications. The release of nanoparticles from nanofibrous composites during the water filtration process can lead to decreased Cu(II) removal capacity along with reduced potential reusability of the composites.25,27
Few researchers have synthesized PAA/PVA electrospun nanofibers for use in Cu(II) removal.34,35 More research is still required to improve our understanding of electrospun PAA/PVA nanofibers as adsorbents for Cu(II) removal. The aim of this study was to characterize Cu(II) removal from industrial plating wastewater using electrospun PAA/PVA nanofibers as adsorbents. Batch experiments were performed using the nanofibrous adsorbents to examine the effects of solution pH, adsorbent dose, reaction time, temperature, initial Cu(II) concentration, and regeneration/reuse, and competing nickel ions (Ni(II)) on Cu(II) removal from synthetic solution and plating wastewater. In addition, filtration experiments were conducted using the nanofibrous adsorbents to observe Cu(II) removal from synthetic solution and wastewater under flow-through conditions. Energy dispersive X-ray (EDX) spectrometer, Fourier-transform infrared (FT-IR) spectrometer, and X-ray photoelectron spectroscopy (XPS) analyses were performed to characterize the nanofibrous adsorbents in Cu(II) removal.
2. Materials and methods
2.1. Preparation and characterization of the nanofibrous adsorbents
A PAA solution (Mw = 240![[thin space (1/6-em)]](https://www.rsc.org/images/entities/char_2009.gif) 000, 25 wt% in water) was used as received from Sigma Aldrich. A PVA powder (Mw = 85
000, 25 wt% in water) was used as received from Sigma Aldrich. A PVA powder (Mw = 85![[thin space (1/6-em)]](https://www.rsc.org/images/entities/char_2009.gif) 000–124
000–124![[thin space (1/6-em)]](https://www.rsc.org/images/entities/char_2009.gif) 000, 99% hydrolyzed, Sigma Aldrich, USA) was dissolved in deionized water as PVA solution (10 wt%). PAA/PVA blend solution was prepared by mixing three solutions (PAA
000, 99% hydrolyzed, Sigma Aldrich, USA) was dissolved in deionized water as PVA solution (10 wt%). PAA/PVA blend solution was prepared by mixing three solutions (PAA![[thin space (1/6-em)]](https://www.rsc.org/images/entities/char_2009.gif) :
:![[thin space (1/6-em)]](https://www.rsc.org/images/entities/char_2009.gif) PVA
PVA![[thin space (1/6-em)]](https://www.rsc.org/images/entities/char_2009.gif) :
:![[thin space (1/6-em)]](https://www.rsc.org/images/entities/char_2009.gif) DW) to attain a mixed polymer solution of 10 wt% (5 wt% PAA + 5 wt% PVA). Prior to use for electrospinning, the mixed solution was stirred for 1 h to create a homogeneous solution. Electrospun PAA/PVA nanofibers were prepared by an electrospinning machine (ESP200/ESP100, NanoNC, Seoul, Korea) as mentioned previous study.36 The applied voltage was 17 kV, while the flow rate of the PAA/PVA solution was 0.5 mL h−1. The nanofibrous adsorbents were deposited on a rotating cylinder (diameter = 9 cm, speed = 1000 rpm, tip-to-collector distance = 15 cm) on a negative terminal. In order to obtain the water stability through crosslinking, the nanofibrous adsorbents were heat-treated at 145 °C for 30 min following the method of Xiao et al.,34 who reported that the PAA/PVA nanofibers were successfully crosslinked between carboxyl groups of PAA and hydroxyl groups of PVA by heat treatment, retaining their structure after immersion in water for a week.
DW) to attain a mixed polymer solution of 10 wt% (5 wt% PAA + 5 wt% PVA). Prior to use for electrospinning, the mixed solution was stirred for 1 h to create a homogeneous solution. Electrospun PAA/PVA nanofibers were prepared by an electrospinning machine (ESP200/ESP100, NanoNC, Seoul, Korea) as mentioned previous study.36 The applied voltage was 17 kV, while the flow rate of the PAA/PVA solution was 0.5 mL h−1. The nanofibrous adsorbents were deposited on a rotating cylinder (diameter = 9 cm, speed = 1000 rpm, tip-to-collector distance = 15 cm) on a negative terminal. In order to obtain the water stability through crosslinking, the nanofibrous adsorbents were heat-treated at 145 °C for 30 min following the method of Xiao et al.,34 who reported that the PAA/PVA nanofibers were successfully crosslinked between carboxyl groups of PAA and hydroxyl groups of PVA by heat treatment, retaining their structure after immersion in water for a week.
The characterization of the nanofibrous adsorbents were investigated by various analytic technologies. The morphology of the nanofibrous adsorbents were observed by field emission scanning electron microscopy (FESEM) and EDX analyses (SUPRA 55VP, Carl Zeiss, Oberkochen, Germany). The nanofibrous adsorbents (n = 30) in each FESEM image was measured for determining the average diameter. Zeta potentials were determined by an electrophoretic light scattering analyzer (ELS-Z2, Otsuka Electronics, Osaka, Japan). FT-IR spectra were obtained using a Nicolet 6700 FT-IR spectrometer (Thermo Scientific, MA, USA) at the range of 400–4000 cm−1. X-ray photoelectron spectroscopy (XPS, Sigma Probe, Thermo VG, East Grinstead, UK) scans were also observed with monochromatic Al Kα radiation. In order to quantify the amount of carboxyl groups available for the adsorption of Cu(II), the acid-base titration was conducted for the nanofibrous adsorbents following the procedures described in the literature.37
2.2. Cu(II) removal in synthetic solution
 | (1) |
The effect of solution pH was investigated at a pH range of 2–5 because of the precipitation of Cu(II) ions as Cu(OH)2 at a pH ≥ 6.38 A HCl solution (0.1 M) was used to adjust the solution pH determined by a pH probe (9107BN, Thermo Scientific, Waltham, MA, USA). The effect of nanofibrous adsorbent dose was examined with adsorbent doses of 0.4–2.0 g L−1. The effect of reaction time was observed at 0.5–24 h, whereas the effect of temperature was examined at 15, 30 and 45 °C. The effect of the initial Cu(II) concentration was investigated with Cu(II) concentrations of 50–935 mg L−1. The sorption models used in the data analyses are presented in ESI.†
In addition, the regeneration and reuse of the nanofibrous adsorbents for Cu(II) removal were evaluated. Thus after removal experiments, the adsorbents were immersed in 40 mL of 0.2 M HCl solution for 15 min at 30 °C and shaken at 150 rpm using a shaking incubator for the desorption of adsorbed Cu(II) and the regeneration of the nanofibrous adsorbents. After drying at 65 °C, the adsorption/desorption procedure was repeated up to five times to test the reusability of the nanofibrous adsorbents for Cu(II) removal.
| n(%) = (1 − an/bn) × 100, | (2) |
To calculate an, the thickness of the nanofibrous adsorbents was determined from an FESEM image. The porosity of the nanofibrous adsorbents was calculated to be 76.2%. Filtration tests were conducted at two different Cu(II) concentrations (10, 50 mg L−1) with a total filtrate volume of Cu(II) solution of 300 mL. Starting from 20 mL, various volumes of Cu(II) solution were serially filtered through a dead-end filtration system (transmembrane pressure (TMP) = 0.6 bar) equipped with the nanofibers. Filtrate water was collected and sampled to analyze Cu(II) concentration via ICP-AES. It should be noted that the nanofibrous adsorbents had a high permeability during filtration tests; 300 mL of Cu(II) solution were filtered within 5 min. The equations used in the filtration data analysis are presented in ESI.†
2.3. Cu(II) removal in industrial plating wastewater
Industrial plating wastewater was collected from a plating plant located in Ansan, Republic of Korea. The major element of the wastewater was Cu(II) (430.06 mg L−1) along with Ni(II) as a minor element (3.995 mg L−1). The solution pH and electrical conductivity (EC) of the wastewater were 1.1 and 50.1 mS cm−1, respectively. Prior to use for the experiments, the solution pH was adjusted to 5 using a 5 M NaOH solution. Following the same procedures for synthetic Cu(II) solution, batch experiments in industrial plating wastewater were conducted to examine Cu(II) removal by the nanofibrous adsorbents (adsorbent dose = 0.4–2.0 g L−1). Filtration experiments were also performed to examine Cu(II) removal from the wastewater (total filtrate volume = 500 mL), following the same procedures for synthetic solution.3. Results and discussion
3.1. EDS, FTIR, and XPS analyses
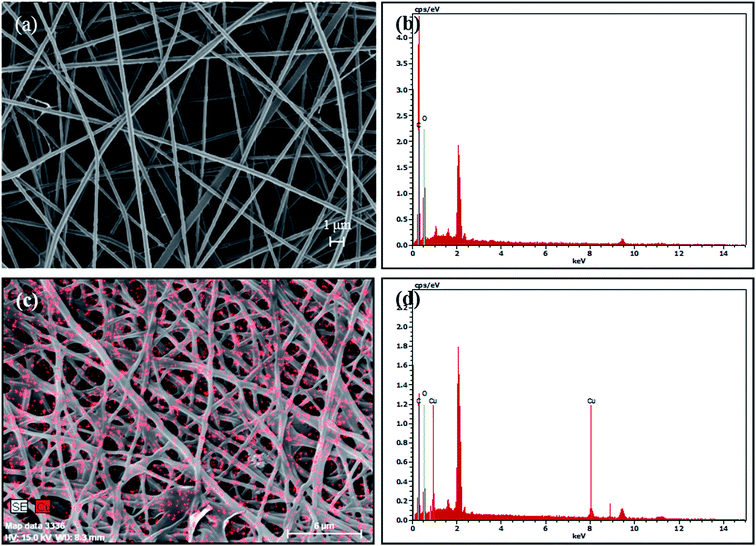
FESEM image (Fig. 1a) showed that the nanofibrous adsorbents were successfully synthesized, and no beaded nanofibers were observed. The nanofibrous adsorbents had the average diameter of 333 ± 54 nm. In the EDS pattern before Cu(II) removal experiment (Fig. 1b), carbon (C) was indicated at the peak positions of 0.277 keV as K alpha, and 0.284 keV as K beta X-ray signals (Fig. 1b). The nanofibrous adsorbents (atomic%) were composed of carbon (71.28) and oxygen (28.72). After Cu(II) removal experiment, the nanofibrous adsorbents successfully retained their morphology, although they swell slightly (Fig. 1c). From the EDS pattern, Cu was observed at the peak positions of 0.930 keV as L alpha, 8.040 keV as K alpha, and 8.904 keV as K beta signals (Fig. 1d). The nanofibrous adsorbents (atomic%) were composed of carbon (77.37), oxygen (16.23), and copper (6.40). In the nanofibrous adsorbents, the amount of carboxyl groups available for the adsorption of Cu(II) was determined to be 4.82 ± 0.01 mmol g−1 from the acid–base titration. According to the zeta potential (ZP) measurement, the ZP value of the nanofibrous adsorbents was estimated as −0.86 mV before Cu(II) adsorption. This value increased slightly and became positive (+0.43 mV) after Cu(II) adsorption, indicating the adsorption of positively-charged Cu(II) to the nanofibrous adsorbent surfaces.FT-IR spectra of the nanofibrous adsorbents before/after Cu(II) removal experiments are presented in Fig. 2. The broad band at 3272 cm−1 was assigned to the stretching vibration of O–H group. The peak at 2919 cm−1 was attributed asymmetric stretching mode of –CH, whereas the band at 1412 cm−1 was ascribed to C–H bending.40,41 The peaks at 822, 1091, and 1237 cm−1 were attributed to C–C–O, C–O, and C–C stretching, respectively.42–44 Bands at 1704 cm−1 and 913 cm−1 were ascribed to a carbonyl group (–CO–O–) of the crosslinked PAA/PVA and an O–H group of the carboxyl group in PAA, respectively.45,46 After Cu(II) adsorption in synthetic solution and industrial plating wastewater, a new peak appeared at 1617 cm−1 due to the interactions between Cu(II) and carboxyl oxygen on the surfaces of the nanofibrous adsorbents.22
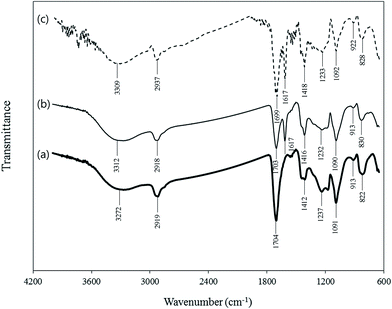 | ||
| Fig. 2 FTIR spectra of the nanofibrous adsorbents: (a) before experiment, (b) after experiment in synthetic solution, and (c) after experiment in industrial plating wastewater. | ||
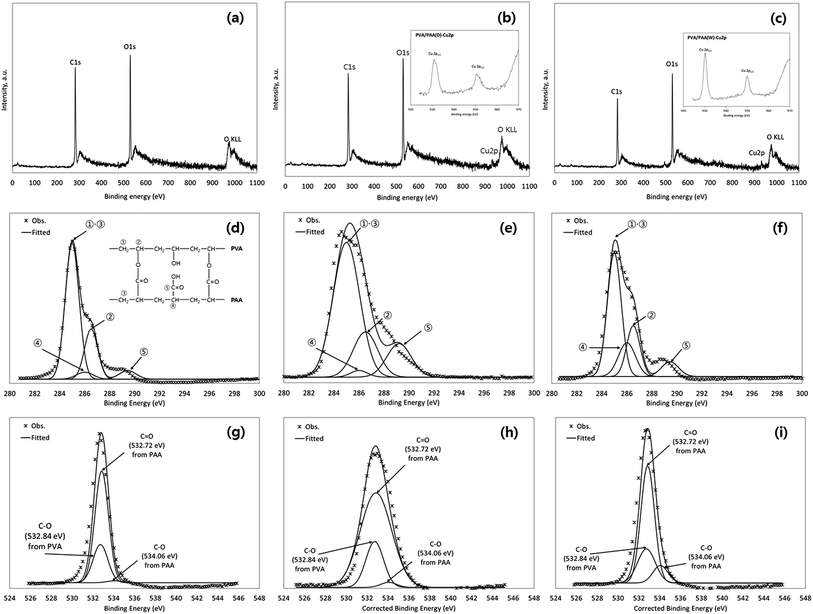
The XPS spectra of the nanofibrous adsorbents before/after Cu(II) removal experiments are presented in Fig. 3. In wide scans (Fig. 3a–c), the photoelectron peaks at the binding energies of 282.4 and 530.0 eV were attributed to C 1s and O 1s, respectively. After Cu(II) removal in synthetic solution (Fig. 3b) and industrial plating wastewater (Fig. 3b), the Cu 2p peak at a binding energy of 932 eV appeared. Within high-resolution scans of the Cu 2p region (insets of Fig. 3b and c), Cu 2p3/2 and Cu 2p1/2 peaks appeared at 930.8 and 950.4 eV, respectively, which were in good agreement with the standard spectrum for CuO.47 In the C 1s spectrum (Fig. 3d–f), the peak at 285.0 eV was assigned to CH2 from PVA and PAA. Other peaks at 286.01 and 286.52 eV were assigned to C–OH (hydroxyl group) from PAA and PVA, respectively. The peak at 289.45 eV was assigned to O![[double bond, length as m-dash]](https://www.rsc.org/images/entities/char_e001.gif) C–OH (carboxyl group) from uncondensed moieties at PAA.48–52 PVA and PAA are both hydrophilic polymers that require crosslinking to gain water stability. PAA has carboxylic acid groups on its surface, whereas PVA has hydroxyl groups on its surface.36,53 PAA could be blended with PVA to improve the water stability of electrospun nanofibers through simple heat treatment,33 which results in strong ester linkage between the carboxyl group of PAA and the hydroxyl group of PVA (inset in Fig. 3d). The carboxyl groups on the surfaces of the nanofibrous adsorbents could provide sorption sites for Cu(II) removal. Within the O 1s spectrum (Fig. 3g–i), the peaks at 532.72 and 534.06 eV could be attributed to C
C–OH (carboxyl group) from uncondensed moieties at PAA.48–52 PVA and PAA are both hydrophilic polymers that require crosslinking to gain water stability. PAA has carboxylic acid groups on its surface, whereas PVA has hydroxyl groups on its surface.36,53 PAA could be blended with PVA to improve the water stability of electrospun nanofibers through simple heat treatment,33 which results in strong ester linkage between the carboxyl group of PAA and the hydroxyl group of PVA (inset in Fig. 3d). The carboxyl groups on the surfaces of the nanofibrous adsorbents could provide sorption sites for Cu(II) removal. Within the O 1s spectrum (Fig. 3g–i), the peaks at 532.72 and 534.06 eV could be attributed to C![[double bond, length as m-dash]](https://www.rsc.org/images/entities/char_e001.gif) O and C–O, respectively, from PAA, whereas 532.84 ev could be assigned to C–O from PVA.50,51
O and C–O, respectively, from PAA, whereas 532.84 ev could be assigned to C–O from PVA.50,51
3.2. Cu(II) removal in synthetic solution: batch and filtration experiments
As initial solution pH increased from 2 to 5, the removal capacity increased sharply from 0.8 to 44.9 mg g−1 (Table 1). Poor adsorption in highly acidic pH is related to competition between hydrogen ions and Cu(II) ions for the same sorption sites on the adsorbents. As solution pH increases, carboxyl groups in PAA and hydroxyl groups in PVA are more dissociated and stretched, increasing the electrostatic interactions with Cu(II) ions.22,54 Similar findings were reported for electrospun nanofibers synthesized from PAA/PVA polymers,35 silk fibroin/nylon-6 polymers,17 and PAA/PAN polymers.23 Wang et al.23 examined the effect of pH on Cu(II) removal by PAA/PAN nanofibers, reporting that adsorption of Cu(II) was pH dependent, with a maximum adsorption capacity at pH 5. The effect of adsorbent dose on Cu(II) removal is presented in Table 2. As the adsorbent dose increased from 0.4 to 2.0 g L−1 by decreasing the removal capacity from 106.0 to 41.8 mg g−1, whereas the percent removal increased from 7.1 to 14.3%.| Initial pH | 2 | 3 | 4 | 5 |
|---|---|---|---|---|
| Adsorption capacity (mg g−1) | 0.8 ± 0.2 | 13.2 ± 0.9 | 33.9 ± 1.5 | 44.9 ± 0.2 |
| Equilibrium pH | 2.2 | 2.9 | 3.0 | 3.1 |
| Adsorbent dose (g L−1) | 0.4 | 0.6 | 1.0 | 2.0 |
|---|---|---|---|---|
| Adsorption capacity (mg g−1) | 106.0 ± 12.2 | 84.7 ± 0.4 | 52.2 ± 4.3 | 45.8 ± 0.6 |
| Percent removal (%) | 7.1 ± 0.8 | 8.48 ± 0.0 | 9.4 ± 1.4 | 14.3 ± 0.2 |
The characteristics of Cu(II) adsorption to the nanofibrous adsorbents are presented in Fig. 4. The reaction at 15 °C reached equilibrium around 12 h, whereas the reactions at 30 and 45 °C reached equilibrium around 6 h (Fig. 4a). Kinetic model analysis (eqn (S1)–(S3), ESI†) for the adsorption data at 30 °C is presented as an example in Fig. 4b, while the model parameters for all three temperatures are provided in Table S1 (ESI†). The effect of temperature on Cu(II) removal is also shown in Fig. 4a. The removal capacity increased from 19.2 to 47.6 mg g−1 with an increasing temperature from 15 to 45 °C. The temperature data were analyzed by the thermodynamic models (eqn (S4)–(S6), ESI†). The thermodynamic analysis is presented in Fig. 4c along with the model parameters. The positive value of ΔH0 (23.47 kJ mol−1) means that Cu(II) removal by the nanofibrous adsorbents is an endothermic process. Similar results have been observed by previous researchers, observed the endothermic nature of Cu(II) removal by titanate nanofibers,55 aminated PAN nanofibers,21 poly(ethylene oxide)/chitosan nanofibers,28 and PVA/ZnO nanofibers.25 A positive value of ΔS0 (56.44 J K−1 mol−1) insisted that the degree of randomness increased at the interface between the adsorbent and the adsorbate during Cu(II) removal. Positive values of ΔG0 (5.5–7.21 kJ mol−1) were also obtained from the model analysis. According to eqn (S5) (ESI†), the value of ΔG0 becomes positive when the Cu(II) in the aqueous phase (Ce) is larger than that on the solid phase (aqe) at equilibrium. The equilibrium isotherm model analysis (eqn (S7)–(S9), ESI†) and related parameters are provided in Fig. 4d and Table S2.† From the Langmuir model, the maximum removal capacity (qm) was determined to be 49.3 mg g−1, which was in the range of Cu(II) removal capacity (5.0–485.4 mg g−1) reported in the literature (Table 3).
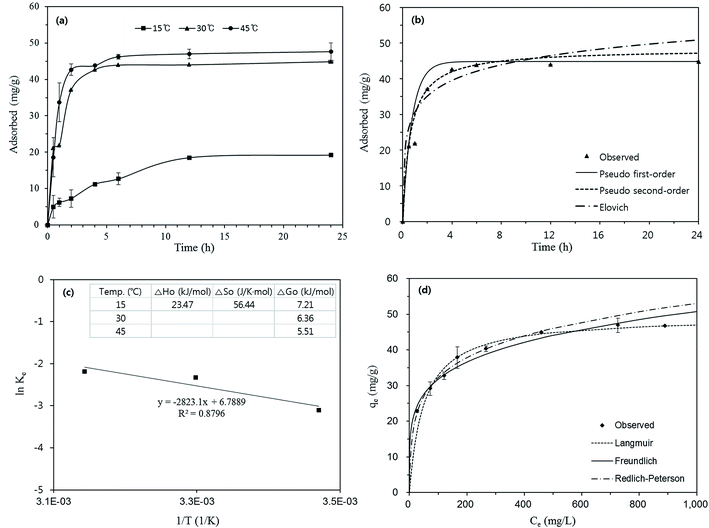 | ||
| Fig. 4 Characteristics of Cu(II) sorption to the nanofibrous adsorbents: (a) effects of reaction time and temperature, (b) kinetic model analysis (model parameters in Table 3), (c) thermodynamic model analysis (inset = model parameters), and (d) effect of initial Cu(II) concentration and equilibrium model analysis (model parameters in Table 4). Error bars represent standard deviation of the mean (n = 3). | ||
| Polymer | Removal capacity (mg g−1) | Initial Cu(II) concentration (mg L−1) | Reference |
|---|---|---|---|
| PAN | 52.7 | 0–1000 | 15 |
| PAN | 150.6 | 40–1000 | 56 |
| PAN | 116.5 | 0–636 | 21 |
| PAN | 215.2 | 0–1000 | 19 |
| PAN | 30.4 | 5–100 | 57 |
| PAA/PAN | 48.2 | 108–268 | 23 |
| PVP | 5.0 | 5–50 | 14 |
| Keratin | 11.0 | 0.1–50 | 12 |
| Chitosan | 485.4 | 100–400 | 24 |
| PEO/chitosan | 302.4 | 50–1000 | 28 |
| PVA (ZnO) | 162.5 | 1–200 | 25 |
| PAA/PVA (nZVI) | 107.8 | 25–200 | 27 |
| PAA/PVA | 49.3 | 50–500 | This study |
The effect of regeneration and reuse of the nanofibrous adsorbents on Cu(II) removal is presented in Table 4. The removal capacity remained relatively constant at 41.9–45.6 mg g−1 during five adsorption–desorption cycles. The desorption rate from the nanofibrous adsorbents was in the range of 82.4–101.2%. Our results indicated that the adsorption of Cu(II) to the nanofibrous adsorbents is mostly reversible. The nanofibrous adsorbents can be regenerated and reused for Cu(II) removal through successive adsorption–desorption processes. The schematic illustrations for the adsorption–desorption mechanisms between Cu(II) and nanofibrous adsorbents are presented in Fig. 5. In the adsorption process, Cu(II) ions are electrostatically interacted with carboxyl groups on the surfaces of nanofibrous adsorbents, whereas in desorption process the adsorbed Cu(II) are released from the nanofibrous adsorbents under a highly acidic condition due to the competitive effect of hydrogen ions.54
| Cycle | 1 | 2 | 3 | 4 | 5 |
|---|---|---|---|---|---|
| Adsorption capacity (mg g−1) | 44.9 ± 0.2 | 42.2 ± 1.3 | 45.6 ± 0.2 | 41.9 ± 0.5 | 42.3 ± 1.9 |
| Desorption rate (%) | 101.2 ± 1.7 | 92.6 ± 1.1 | 82.4 ± 0.6 | 90.2 ± 1.3 | 89.2 ± 2.7 |
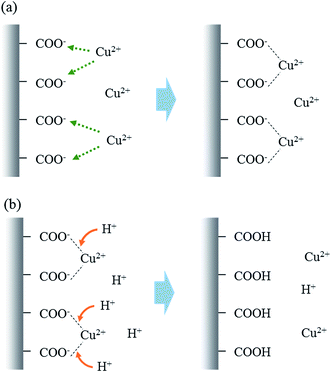 | ||
| Fig. 5 Schematic illustrations for the adsorption–desorption mechanisms between Cu(II) and nanofibrous adsorbents: (a) adsorption and (b) desorption. | ||
Breakthrough curves of Cu(II) obtained from water filtration tests are presented in Fig. 6. In the case of Cu(II) = 10 mg L−1, the filtrate Cu(II) concentration was 4.5 mg L−1 at a filtration volume of 20 mL and then remained relatively constant around 3.4–4.2 mg L−1 thereafter. From eqn (S15) (ESI†), the removal capacity (qa,exp) was determined to be 9.1 mg g−1. For Cu(II) = 50 mg L−1, the value of qa,exp was 25.2 mg g−1, which was 2.8 times larger than that at Cu(II) = 10 mg L−1. The modified dose–response model (eqn (S16), ESI†) analyses are also presented in Fig. 6, demonstrating that the breakthrough curves were well described by the model. The removal capacities (qa,mod) from the model were similar to those (qa,exp) from the experiments (inset in Fig. 6).
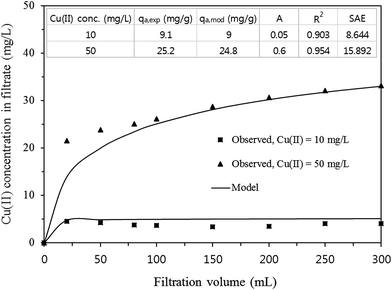 | ||
| Fig. 6 Breakthrough curves of Cu(II) in synthetic solution along with modified dose–response model fits (inset = model parameters). | ||
3.3. Cu(II) removal in industrial plating wastewater: batch and filtration experiments
Batch experimental results for Cu(II) removal from industrial plating wastewater by the nanofibrous adsorbents are presented in Table 5. As the nanofibrous adsorbent dose increased from 0.4 to 1.0 g L−1, Cu(II) removal capacity increased from 25.8 to 33.6 mg g−1 and then decreased to 26.2 mg g−1 as the adsorbent dose further increased to 2.0 g L−1. However, the removal of other heavy metal ions (Ni, Zn, etc.) by the nanofibrous adsorbents was negligible.| Element | Wastewater before removal | Wastewater after removal with adsorbent dose (g L−1) | |||
|---|---|---|---|---|---|
| 0.4 | 0.6 | 1.0 | 2.0 | ||
| a The number in the parenthesis is the Cu(II) removal capacity. | |||||
| Cu (mg L−1) | 430.07 | 416.51 (25.8)a | 403.54 (30.2) | 388.11 (33.6) | 369.24 (26.2) |
| Ni (mg L−1) | 3.995 | 3.971 | 3.959 | 3.991 | 3.994 |
| Zn (mg L−1) | 0.116 | 0.106 | 0.142 | 0.133 | 0.093 |
| Cr (mg L−1) | 0.198 | 0.112 | 0.107 | 0.119 | 0.119 |
| Mn (mg L−1) | 0.012 | 0.008 | 0.009 | 0.009 | 0.010 |
| Fe (mg L−1) | 0.189 | 0.107 | 0.105 | 0.116 | 0.138 |
| Al (mg L−1) | 0.156 | 0.128 | 0.122 | 0.134 | 0.160 |
In order to understand the effect of Ni(II) on Cu(II) removal by the nanofibrous adsorbents, additional batch experiments were performed in synthetic solutions. Ni(II) removal experiments performed in single solution of Ni(II) (initial Ni(II) concentration = 95–985 mg L−1, adsorbent dose = 1 g L−1) indicated that Ni(II) removal capacity increased from 12.2 to 19.3 mg g−1 with an increasing initial Ni(II) concentration from 95 to 985 mg L−1. Ni(II) removal capacity was far lower than that of Cu(II) in a similar concentration range of Cu(II) (see Fig. 4d).
Batch experiments were also conducted in binary solution of Cu(II) and Ni(II) (adsorbent dose = 1 g L−1, each metal concentration = 50–450 mg L−1). The values of Kd and SCu/Ni were calculated using the following relationships:
 | (3) |
 | (4) |
The experimental results are summarized in Table 6. With an increase of initial Cu(II) concentration from 50 to 450 mg L−1, Cu(II) removal capacity in the presence of Ni(II) increased from 10.6 to 35.1 mg g−1, which were slightly lower than those of Cu(II) in the absence of Ni(II) with a similar initial Cu(II) concentration range (Fig. 4d). Ni(II) removal capacity was less than 1.2 mg g−1 in the presence of Cu(II), indicating that Ni(II) was rarely adsorbed by the nanofibrous adsorbents in the presence of Cu(II). The values of SCu/Ni were calculated to be greater than 30, demonstrating that the nanofibrous adsorbents had a far higher selectivity for Cu(II) over Ni(II) in a binary system (Table 6). These results could be ascribed to the higher binding affinity of Cu(II) for a given ligand compared to Ni(II).54 Similar findings were reported by other researchers for functionalized PS nanofibers13 and PVA/zinc oxide nanofibers,25 demonstrating that Cu(II) removal was much larger than Ni(II) removal.
| Cu/Ni ratioa | 50/50 | 100/100 | 150/150 | 200/200 | 300/300 | 450/450 |
|---|---|---|---|---|---|---|
| a mg L−1 of Cu(II) over mg L−1 of Ni(II). | ||||||
| qe,Cu (mg g−1) | 10.6 | 26.0 | 29.8 | 29.9 | 34.3 | 35.1 |
| qe,Ni (mg g−1) | 0.401 | 1.160 | 0.468 | 0.042 | 1.01 × 10⁻⁴ | 0 |
| Kd,cu (L g−1) | 0.298 | 0.362 | 0.260 | 0.187 | 0.140 | 0.085 |
| Kd,Ni (L g−1) | 8.17 × 10⁻³ | 1.19 × 10⁻² | 3.23 × 10⁻³ | 2.19 × 10⁻⁴ | 3.51 × 10⁻⁷ | 0 |
| SCu/Ni | 36.5 | 30.4 | 80.5 | 856 | 3.97 × 10⁵ | ∞ |
Breakthrough curves for heavy metal ions obtained from wastewater filtration tests are presented in Fig. 7. Cu(II) removal capacity (qa,exp) was determined to be 32.4 mg g−1 from eqn (S15).† Cu(II) removal capacity (qa,mod) from the modified dose–response model was calculated to be 32.3 mg g−1. The removal of other heavy metal ions by the nanofibrous adsorbents was negligible under dynamic flow conditions (inset in Fig. 7). Our results showed that the nanofibrous adsorbents could be applied for Cu(II) removal from the wastewater.
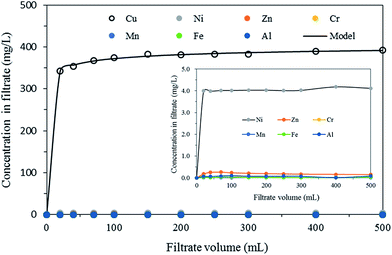 | ||
| Fig. 7 Breakthrough curves of Cu(II) in industrial plating wastewater along with modified dose–response model fit (inset = breakthrough curves for other metal ions). | ||
4. Conclusions
Electrospun PAA/PVA nanofibrous adsorbents were used for Cu(II) removal. FT-IR and XPS analyses demonstrated that the carboxyl groups on the surfaces of the nanofibrous adsorbents could provide sorption sites for Cu(II) removal. Batch experiments showed that the nanofibrous adsorbents were effective at Cu(II) removal and could be regenerated and reused through successive adsorption–desorption processes. The nanofibrous adsorbents had much higher selectivity for Cu(II) over Ni(II) in a binary system. Batch experiments also demonstrated that the nanofibrous adsorbents had slightly lower Cu(II) removal capacity in industrial plating wastewater than that in synthetic solution. However, the nanofibrous adsorbents retained a higher selectivity for Cu(II) over other heavy metal ions in the wastewater. The nanofibrous adsorbents were also applied through filtration tests for Cu(II) removal from the wastewater under dynamic flow conditions.Acknowledgements
This work was supported by the National Research Foundation of Korea, funded by the Ministry of Education, Republic of Korea (grant number 2016-940823).References
- A. Agrawal, S. Kumari and K. Sahu, Ind. Eng. Chem. Res., 2009, 48, 6145–6161 CrossRef CAS.
- M. Ugarte, N. N. Osborne, L. A. Brown and P. N. Bishop, Surv. Ophthalmol., 2013, 58, 585–609 CrossRef PubMed.
- A. Pal, J. Jayamani and R. Prasad, NeuroToxicology, 2014, 44, 58–60 CrossRef CAS PubMed.
- M. Bilal, J. A. Shah, T. Ashfaq, S. M. H. Gardazi, A. A. Tahir, A. Pervez, H. Haroon and Q. Mahmood, J. Hazard. Mater., 2013, 263, 322–333 CrossRef CAS PubMed.
- R. Bazargan-Lari, H. R. Zafarani, M. E. Bahrololoom and A. Nemati, J. Taiwan Inst. Chem. Eng., 2014, 45, 1642–1648 CrossRef CAS.
- S. Ramakrishana, K. Fujihara, W. E. Teo, T. C. Lim and Z. Ma, An introduction to electrospinning and nanofibers, World Scientific Publishing, Singapore, 2005 Search PubMed.
- Y. Huang, Y. Miao and T. Liu, J. Appl. Polym. Sci., 2012, 131, 40864–40875 Search PubMed.
- Q. Qin, Y. Liu, S. C. Chen, F. Y. Zhai, X. K. Jing and Y. Z. Wang, J. Appl. Polym. Sci., 2012, 126, 1556–1563 CrossRef CAS.
- A. A. Taha, Y. Wu, H. Wang and F. Li, J. Environ. Manage., 2012, 112, 10–16 CrossRef CAS PubMed.
- I. Y. El-Sherif, S. Tolani, K. Ofosu, O. A. Mohamed and A. K. Wanekaya, J. Environ. Manage., 2013, 129, 410–413 CrossRef CAS PubMed.
- M. J. Nalbandiana, M. Zhang, J. Sanchez, Y. H. Choa, J. Nam, D. M. Cwiertny and N. V. Myung, Chemosphere, 2016, 144, 975–981 CrossRef PubMed.
- A. Aluigi, C. Tonetti, C. Vineis, C. Tonin and G. Mazzuchetti, Eur. Polym. J., 2011, 47, 1756–1764 CrossRef CAS.
- G. Darko, S. Chigome, Z. Tshentu and N. Torto, Anal. Lett., 2011, 44, 1855–1867 CrossRef CAS.
- A. Mahapatra, B. G. Mishra and G. Hota, J. Hazard. Mater., 2013, 258–259, 116–123 CrossRef CAS PubMed.
- K. Saeed, S. Haider, T. J. Oh and S. Y. Park, J. Membr. Sci., 2008, 322, 400–405 CrossRef CAS.
- Y. Sang, Q. Gu, T. Sun, F. Li and C. Liang, J. Hazard. Mater., 2008, 153, 860–866 CrossRef CAS PubMed.
- E. Yaçin, S. Gedikli, A. Çabuk, Z. Karahaliloğlu, M. Demirbilek, C. Bayram, M. Sam, N. Sağlam and E. B. Denkbaş, Clean Technol. Environ. Policy, 2015, 17, 921–934 CrossRef.
- P. Liu, B. Gaeeido, K. Oksman and A. P. Mathew, RSC Adv., 2016, 6, 107759–107767 RSC.
- F. Huang, Y. Xu, S. Liao, D. Yang, Y. L. Hsieh and Q. Wei, Materials, 2013, 6, 969–980 CrossRef CAS.
- H. Li, C. Li, J. Bai, T. Xu, W. Sun, W. Xu and Y. Huang, Polym.-Plast. Technol. Eng., 2014, 53, 513–519 CrossRef CAS.
- P. K. Neghlani, M. Rafizadeh and F. A. Tatomi, J. Hazard. Mater., 2010, 186, 182–189 CrossRef PubMed.
- B. Sun, X. Li, R. Zhao, M. Yin, Z. Wang, Z. Jiang and C. Wang, J. Taiwan Inst. Chem. Eng., 2016, 62, 219–227 CrossRef CAS.
- J. Wang, P. Jia, K. Pan and B. Cao, Desalin. Water Treat., 2015, 54, 2856–2867 CrossRef CAS.
- S. Haider and S. Y. Park, J. Membr. Sci., 2009, 328, 90–96 CrossRef CAS.
- H. Hallaji, A. R. Keshtkar and M. A. Moosavian, J. Taiwan Inst. Chem. Eng., 2015, 46, 109–118 CrossRef CAS.
- A. Razzaz, S. Ghorban, L. Hosayni, M. Irani and M. Aliabadi, J. Taiwan Inst. Chem. Eng., 2016, 58, 333–343 CrossRef CAS.
- R. Xu, M. Jia and F. Li, Adv. Mater. Res., 2012, 356–360, 488–492 CAS.
- M. Aliabadi, M. Irani, J. Ismaeili, H. Piri and M. J. Parnian, Chem. Eng. J., 2013, 220, 237–243 CrossRef CAS.
- N. Horzum, E. Boyaci, A. E. Eroğlu, T. Shahwan and M. M. Demir, Biomacromolecules, 2010, 11, 3301–3308 CrossRef CAS PubMed.
- R. M. Nthumbi, J. C. Ngila, A. Kindness, B. Moodley and L. Petrik, Anal. Lett., 2011, 44, 1937–1955 CrossRef CAS.
- S. Wu, F. Li, H. Wang, L. Fu, B. Zhang and G. Li, Polymer, 2010, 51, 6203–6211 CrossRef CAS.
- S. Wu, F. Li, Y. Wu, R. Xu and G. Li, Chem. Commun., 2010, 46, 1694–1696 RSC.
- P. Tan, J. Wen, Y. Hu and X. Tan, RSC Adv., 2016, 6, 79641–79650 RSC.
- S. Xiao, M. Shen, H. Ma, G. Rui, M. Zhu, S. Wang and X. Shi, J. Appl. Polym. Sci., 2010, 116, 2409–2417 CAS.
- S. Xiao, H. Ma, M. Shen, S. Wang, Q. Huang and X. Shi, Colloids Surf., A, 2011, 381, 48–54 CrossRef CAS.
- J. A. Park and S. B. Kim, React. Funct. Polym., 2015, 93, 30–37 CrossRef CAS.
- K. Kumeta, I. Nagashima, S. Matsui and K. Mizoguchi, J. Appl. Polym. Sci., 2003, 90, 2420–2427 CrossRef CAS.
- N. Ferrah, O. Abderrahim, M. A. Didi and D. Villemin, Desalination, 2011, 269, 17–24 CrossRef CAS.
- Z. Ma, M. Kotaki, T. Yong, W. He and S. Ramakrishna, Biomaterials, 2005, 26, 2527–2536 CrossRef CAS PubMed.
- S. Abbasizadeh, A. R. Keshtkar and M. A. Mousavian, Chem. Eng. J., 2013, 220, 161–171 CrossRef CAS.
- C. Yuan, J. Zhang, G. Chen and J. Yang, Chem. Commun., 2011, 47, 899–901 RSC.
- W. Li, X. Y. Li, Y. Chen, X. X. Li, H. B. Deng, T. Wang, R. Huang and G. Fan, Carbohydr. Polym., 2013, 92, 2232–2238 CrossRef CAS PubMed.
- W. Siriwatcharapiboon, N. Tinnarat and P. Supaphol, J. Polym. Res., 2013, 20, 1–8 CAS.
- X. M. Sui, C. L. Shao and Y. C. Liu, Appl. Phys. Lett., 2005, 87, 113–115 CrossRef.
- A. Atymur and I. Uslu, Polym.-Plast. Technol. Eng., 2014, 156, 655–660 CrossRef.
- D. S. Kim, H. B. Park, J. W. Rhim and Y. M. Lee, Solid State Ionics, 2005, 176, 117–126 CrossRef CAS.
- A. Pendashteh, M. F. Mousavi and M. S. Rahmanifar, Electrochim. Acta, 2013, 88, 347–357 CrossRef CAS.
- B. M. Dekoven and P. L. Hagans, Appl. Surf. Sci., 1986, 27, 199–213 CrossRef CAS.
- S. Akhter, K. Allan, D. Buchaan, J. A. Cook, A. Campion and J. M. White, Appl. Surf. Sci., 1988-1989, 35, 241–258 Search PubMed.
- P. Louette, F. Bodino and J. J. Pireaux, Surf. Sci. Spectra, 2005, 12, 22–26 CrossRef CAS.
- P. Louette, F. Bodino and J. J. Pireaux, Surf. Sci. Spectra, 2005, 12, 106–110 CrossRef CAS.
- J. Yan, Y. Huang, Y. E. Miao, W. W. Tjiu and T. Liu, J. Hazard. Mater., 2015, 283, 730–739 CrossRef CAS PubMed.
- H. Hayashi and T. Komatsu, Bull. Chem. Soc. Jpn., 1991, 64, 303–305 CrossRef CAS.
- H. Irving and R. J. P. Williams, J. Chem. Soc., 1953, 3192–3210 RSC.
- N. Li, L. Zhang, Y. Chen, Y. Tian and H. Wang, J. Hazard. Mater., 2011, 189, 265–272 CrossRef CAS PubMed.
- P. Kampalanonwat and P. Supaphol, ACS Appl. Mater. Interfaces, 2010, 2, 3619–3627 CAS.
- P. Kampalanonwat and P. Supaphol, Energy Procedia, 2014, 56, 142–151 CrossRef CAS.
Footnote |
| † Electronic supplementary information (ESI) available. See DOI: 10.1039/c7ra01362k |
| This journal is © The Royal Society of Chemistry 2017 |

