 Open Access Article
Creative Commons Attribution 3.0 Unported Licence
Evaluating the performance of MoS2 based materials for corrosion protection of mild steel in an aggressive chloride environment†
S. ArunKumar,
V. Jegathish,
R. Soundharya,
M. JesyAlka,
C. Arul,
S. Sathyanarayanan and
Sundar Mayavan *
*
CSIR-Central Electrochemical Research Institute, Corrosion and Materials Protection Division, Karaikudi – 630006, Tamil Nadu, India. E-mail: sundarmayavan@cecri.res.in
First published on 20th March 2017
Abstract
In this work for the first time, metal doped (Fe, Co, Ni) MoS2 sheets dispersed in sunflower oil were explored as a coating for inhibiting Fe metal corrosion in a sodium chloride (NaCl) solution. The incorporation of Fe, Co, and Ni ions resulted in an appreciable increase in the corrosion resistance properties of MoS2.
Exposure of metals to environmental and service conditions often results in failure due to oxidation and corrosion. Various types of coatings based on ceramics, metals, and polymers have been used for corrosion protection.1–3 Organic/polymer coatings can be easily formulated and find wide applications in various industries. However, the main issue with polymeric coatings is the presence of pores/pinholes that lead to the corrosion of the underlying metal substrate. Recently, nanomaterials (as fillers) have shown to significantly improve the corrosion resistance of the polymeric coatings. Among nanomaterials, graphene is believed to be an ideal material for metal protection due to its high impermeability to gases and moisture.4–6 However, the main issue with graphene is its ability to form a galvanic cell with underlying metals, promoting oxidation/corrosion in the long term.7 Hence, exploring substitute materials akin to graphene is an area of current research.
MoS2 is a better alternative to graphene as it has desirable properties similar to graphene, and being a semiconductor it does not form (or enhance) a galvanic cell with underlying metals. In addition, MoS2 is a phosphorescent material and has greater thermal/chemical stability and lubricity.8,9 Doping MoS2 with metals (like cobalt, iron, selenium, etc.) results in the formation of a Mo-metal-S phase, which significantly alters/modifies the electronic, chemical and surface properties of MoS2 for various applications. Fe doped MoS2 shows enhanced conductivity and catalytic activity compared to pristine MoS2.10 Co doped MoS2 nanosheets showed enhanced catalytic activity for hydrogen evolution than pristine MoS2.11 Doping with metals like Fe, Co, Ni improved the surface area of MoS2.10,11 Most of the reported work focuses on the utilization of metal doped MoS2 for catalytic/electronic applications. But to the best of our knowledge pristine MoS2/metal doped MoS2 has not been explored for corrosion control applications. In this work, for the first time metal doped (Fe, Co, Ni) MoS2 sheets dispersed in oil were explored as a coating for inhibiting mild steel (Fe) corrosion in a sodium chloride (NaCl) solution. Sunflower oil is used as the binder to increase the adhesion of MoS2 flakes with the steel surfaces. The incorporation of Fe, Co, and Ni ions resulted in an appreciable increase in the corrosion resistance properties of MoS2.
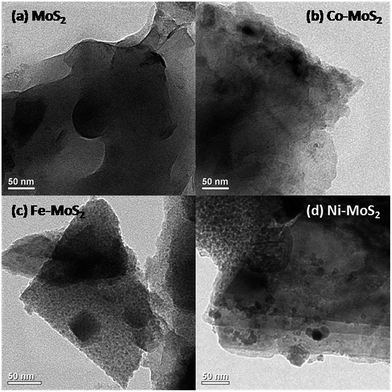
Fe, Co and Ni containing MoS2 nanosheets were prepared via thermal treatment involving MoS2 (commercially sourced), glycine and metal nitrate (see Experimental in the ESI†). The XRD pattern of pristine MoS2 and as-prepared Fe–MoS2, Co–MoS2, Ni–MoS2 are shown in Fig. S1a.† All peaks can be assigned to hexagonal MoS2. After metal (Fe, Co and Ni) doping, all peaks slightly shifted toward smaller diffraction angles (Fig. S1b†), indicating that there is an increase in the interplanar distance. Besides, it is also clear that the XRD peaks of the metal-doped MoS2 are broader and weaker in intensity, indicating the reduction of the average grain size/crystallinity and an increase of defective and disordered structures in the MoS2 due to metal doping. No peaks relating to Fe, Co, Ni are evident which is in line with the previously reported Co/Fe/Ni containing MoS2 compounds.11 This is an indication that Co/Fe/Ni species are chemically coordinated to the MoS2 phase. XPS data confirms the presence of Mo, S, O, N, C and metallic species (Fig. S1c†). The morphology and structure of the as-prepared composites were examined by transmission electron microscopy (TEM). Pristine MoS2 sample have an irregular layered sheet like structure. Addition of metals (to pristine MoS2) seems to have significant influence on the surface morphology (Fig. 1). Incorporation of Fe, Co and Ni resulted in an appreciable increase in the porosity of the film (Fig. 1b–d). Field emission scanning electron microscopy (FE-SEM) images of Fe–MoS2 (Fig. S2a†) showed the clear presence of large number of pores (around hundreds of nanometres) along the entire structure, possibly formed due to the gas evolution by glycine–nitrate decomposition during synthesis process. But pristine MoS2 shows non-porous sheet like structures (with no pores) (Fig. S2b†). XRF was used to further verify the composition of MoS2 samples. XRF data indicates the presence of Mo, S, O along with corresponding metallic species (Fig. S3†).
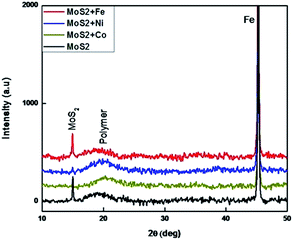
The as-prepared MoS2 and metal doped MoS2 powders are dispersed in sunflower oil under sonication to form a MoS2-based coating solution (MOC) (see Experimental in ESI†). XRD pattern of the MoS2–oil coated samples is shown in Fig. 2. Most of the diffraction originating from the (100), (101), (103), (105) and (110) planes of the bulk MoS2 (Fig. S1†) are completely absent except the low intensity broad (002) peak at around 15°, indicating that the oil sheets. The additional diffraction peak at 45° and 20° originates from the Fe substrate and oil crystallization.12 The surface morphology of the MOC coated samples were examined by SEM. SEM and AFM images (Fig. S4†) show the smooth morphology of the coating surface without any nanostructures.
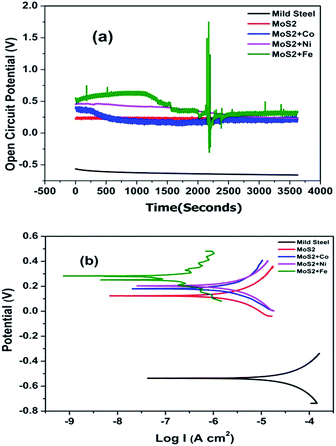
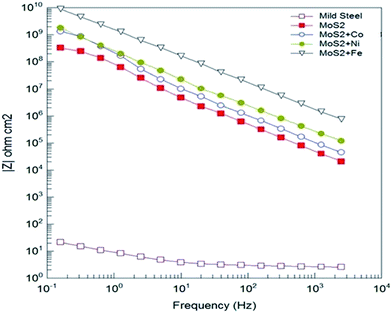
Open circuit voltage (OCV) measurements of MOC coated Fe samples in 3.5% sodium chloride (NaCl) solution are shown in Fig. 3. As a reference the OCV curve of Fe is also displayed. OCV values shows that all samples are nobler than the bare Fe (Fig. 3). For metal doped MoS2 the potential was shifted to more noble direction (ennobling). The observed ennobling is an indication of passivation. Coating with pristine MoS2 and MoS2–Co does not show any influence of the steel substrate at test duration (as there is no significant change in the OCV values for the test duration). For the Ni and Fe the influence of underlying Fe substrate (change in the OCV values) can be observed at test duration. Potentiodynamic polarization measurements in 3.5% NaCl solution of MOC on Fe substrates are plotted in Fig. 3b. As a reference the curve of Fe is also displayed. Table 1 shows the corrosion protection performance of MOC in 3.5% NaCl solution. Ecorr values shows that all samples are nobler than the bare Fe. With the addition of metals the corrosion potential was shifted to more noble direction (ennobling). A maximum Ecorr value of 0.279 V was obtained for the MoS2–Fe coated sample. The Icorr value decreases from 83.66 μA cm−2 corresponding to the mild steel to 0.001 μA cm−2 in the case of MoS2–Fe coating. The corrosion protection efficiency deduced from measured Icorr value is shown in Table 1. The protection efficiency is about 99% for MOC coatings. Among various metals Fe shows the highest protection efficiency with low Icorr and high Ecorr values. Bode plots corresponding to MOC (shown in Fig. 4) proved that the coating is highly capacitive. The slope of the high-frequency data is an indication of the mechanism of coating degradation. A slope of −1 over the entire spectrum indicates capacitive behaviour, whereas a slope of −1/2 is an indication of diffusion control leading to substrate corrosion. From the Bode plot it is observed that MoS2/Fe oil coating showed a high impedance of >1010 ohm cm−2, as compared MoS2/Co, MoS2/Ni and MoS2 oil coating. Fig. S5† shows Nyquist plots of bare Fe and MOC in NaCl. The plot for bare Fe exhibits semicircular characteristics with low resistivity to the corrosive medium. The MoS2 based coatings provides a clear indication about capacitive behaviour, consistent with an intact coating in the absence of defects. The prepared coating shows much better anticorrosion properties than graphene and conducting polymer based coatings in terms of OCV and impedance values.13–16 The coating resistance of the as-prepared oil coating is at least 2 orders of magnitude higher than observed with conducting polymer based coatings and graphene based coatings.13,14
| S. No | Sample name | Ecorr (V) | I μA cm−2 | Protection efficiency (%) |
|---|---|---|---|---|
| 1 | Mild steel | −0.536 | 83.66 | — |
| 2 | MoS2 | 0.149 | 0.005 | 99.993 |
| 3 | MoS2 + Co | 0.180 | 0.003 | 99.996 |
| 4 | MoS2 + Ni | 0.209 | 0.002 | 99.997 |
| 5 | MoS2 + Fe | 0.279 | 0.001 | 99.998 |
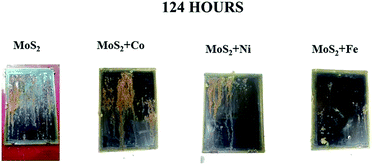
Salt spray test was conducted as per ASTM B117 to test the stability of the coatings. After 74 hour, MoS2/Co, MoS2/Fe, MoS2/Ni, MoS2/Zn and MoS2/Mn oil coated sample starts to form rust. After 124 hour, MoS2/Fe oil coated sample showed a less percentage in corrosion over the metal surface and remaining coated sample gets mostly corroded (Fig. 5). From the salt spray test, we can conclude that MoS2/Fe shows a superior anticorrosion protection to the Fe. Contact angle (Fig. S6†) for the MOC coatings was taken and it was observed that the coated material showed a hydrophobic nature. Contact angle for MoS2/Fe (84.4°), MoS2/Ni (82.1°) MoS2/Co (81.4°) and for MoS2 (78.5°). The adhesion test was done over the coating surface by cross cut square lattice from the substrate surface and the edges are completely smooth and satisfied with ASTM D3359 scale. To understand the abrasion resistance of the coatings, the coated surface was abraded by using two rotating wheels of 500 g load. The coated sample withstands more than 1000 cycles indicating excellent abrasion resistance.
In conclusion, for the first time a MoS2 based oil coatings has been successfully tested for its metallic corrosion resistance under aggressive chloride ion conditions. Metal containing MoS2 coatings showed better corrosion protection properties as compared to pristine MoS2 materials.
Notes and references
- H. Jensen and G. Sorensen, Surf. Coat. Technol., 1996, 84, 500 CrossRef CAS.
- T. K. Rout, G. Jha, A. K. Singh, N. Bandyopadhyay and O. N. Mohanty, Surf. Coat. Technol., 2003, 167, 16 CrossRef CAS.
- A. K. Satapathy, G. Gunasekaran, S. C. Sahoo, K. Amit and P. V. Rodrigues, Corros. Sci., 2009, 51, 2848 CrossRef CAS.
- R. K. Singh Raman, P. C. Banerjee, D. E. Lobo, H. Gullapalli, M. Sumandasa, A. Kumar, L. Choudhary, R. Tkac, P. M. Ajayan and M. Majumder, Carbon, 2012, 50, 4040 CrossRef CAS.
- N. T. Kirkland, T. Schiller, N. Medhekar and N. Birbilis, Corros. Sci., 2012, 56, 1 CrossRef CAS.
- S. Mayavan, T. Siva and S. Sathiyanarayanan, RSC Adv., 2013, 3, 24868 RSC.
- M. Schriver, W. Regan, W. J. Gannett, A. M. Zaniewski, M. F. Crommie and A. Zettl, ACS Nano, 2013, 7, 5763–5768 CrossRef CAS PubMed.
- G. Zhang, H. Liu, J. Qu and J. Li, Energy Environ. Sci., 2016, 9, 1190 CAS.
- I. Song, C. Park and H. C. Choi, RSC Adv., 2015, 5, 7495–7514 RSC.
- D. Ma, Y. Tang, G. Yang, J. Zeng, C. He and Z. Lu, Appl. Surf. Sci., 2015, 328, 71 CrossRef CAS.
- X. Dai, K. Du, Z. Li, M. Liu, Y. Ma, H. Sun, X. Zhang and Y. Yang, ACS Appl. Mater. Interfaces, 2015, 7, 27242 CAS.
- T. Balakrishnan, S. Sathiyanarayanan and S. Mayavan, ACS Appl. Mater. Interfaces, 2015, 7, 19781 CAS.
- S. Sathiyanarayanan, S. Muthkrishnan and G. Venkatachari, Corrosion Protection of Steel by Polyaniline Blended Coating, Electrochim. Acta, 2006, 51, 6313 CrossRef CAS.
- S. Mayavan, T. Siva and S. Sathiyanarayanan, RSC Adv., 2013, 3, 24868 RSC.
- E. Owczare and L. Adamczyk, J. Appl. Electrochem., 2016, 46, 635 CrossRef.
- S. Radhakrishnan, N. Sonawane and C. R. Siju, Prog. Org. Coat., 2009, 64, 383 CrossRef CAS.
Footnote |
| † Electronic supplementary information (ESI) available. See DOI: 10.1039/c7ra01372h |
| This journal is © The Royal Society of Chemistry 2017 |

