 Open Access Article
Protein-derived carbon nanodots with an ethylenediamine-modulated structure as sensitive fluorescent probes for Cu2+ detection
Liman Saia,
Jun Chenb,
Quanhong Changa,
Wangzhou Shia,
Qi Chena and
Lei Huang *a
*a
aJoint Lab with Wuhu Token for Graphene Electrical Materials and Application, Department of Physics, Shanghai Normal University, Guilin Road 100, Shanghai 200234, China. E-mail: leihuang@shnu.edu.cn; Fax: +86-021-64328968
bDepartment of Orthopedic Sport Medicine, Huashan Hospital, Fudan University, Shanghai, 200040, China
First published on 15th March 2017
Abstract
The increasing use of fluorescent carbon nanodots (CNDs) demonstrates their advantages for sensing applications; these include superior photostability, absence of toxicity, and rapid analytical capability. However, CNDs usually have multiple types of functional groups covering their surfaces, which decrease their sensitivity and selectivity. In this study, the required structure of β-lactoglobulin (LG)-derived carbon nanodots was achieved by adding ethylenediamine (EDA) to the synthesis process. Due to the consumption of protein carboxyl groups during the preparation process, a homogeneous coverage of amino groups on the surfaces of the CNDs was achieved, resulting in high sensitivity of the CNDs to copper ions. Furthermore, owing to effective passivation of trap states and a high content of N doping, the as-prepared CNDs showed a high quantum yield and an excitation-independent emission property. We believe that this type of preparation method is useful for the design of protein-derived CNDs, which may have promising applications for detecting various metal ions in a biological environment.
Introduction
Copper ion (Cu2+) is a transition metal ion that is essential to human health and that performs an important role in a range of fundamental physiological processes in living organisms.1 However, excessive uptake of Cu2+ can lead to diseases such as Alzheimer's, Wilson's, or Menkes' diseases.2 According to the U.S Environmental Protection agency (EPA), the average concentration of Cu2+ in blood is 15.7–23.6 μM (ref. 3) in a normal human population, and the upper limit of Cu2+ in drinking water is 20 μM.4 Therefore, there is a great demand for simple, rapid, sensitive, and selective detection of Cu2+. Traditional techniques for detecting metal ions include atomic absorption spectroscopy, plasma mass spectrometry, and electrochemical sensors. These methods suffer from defects such as complex sample preparation, requiring well-skilled professional operators, and expensive equipment. Recently, carbon-based nanoparticles as a simple, cheap, and sensitive fluorescent probe for detecting metal ions have attracted great attention, due to their unique properties, such as superior photostability, non-toxicity, good biocompatibility, simple synthesis, and rapid analytical capability.5–11The sensing principle of CNDs in the detection of metal ions is based on fluorescence quenching of CNDs, which derives from a charge transfer or energy transfer process through conjugation of ions on the surfaces of the CNDs. Selectivity is achieved through the specificity of particular ions or functional groups on the surfaces of CNDs. Thus, to achieve high sensitivity and selectivity of a CND, the its surface should be covered with a large amount of a single type of functional group. However, CNDs prepared by various methods so far usually have multiple types of functional groups on their surfaces,12–14 which limits their sensitivity and specificity to metal ions. Some types of CNDs even showed a response to different types of ions from those anticipated,15,16 and the explanation for this remained unclear.
Moreover, CNDs usually have a relatively low quantum yield compared to traditional semiconductor quantum dots17–19 and show an excitation-dependent emission,20–22 which means that the fluorescence peak position shifts with a change of excitation wavelength. A series of specific energies between LUMO and HOMO related to surface traps were believed to cause this phenomenon. Generally, the strategies for passivation of trap states were based on post-treatment of surface groups.23,24 However, these methods suffered from drawbacks including complex reaction steps, limited control of the synthesis process, and functionalized groups occupying the reactive groups on the surfaces of CNDs.
Commonly-used bottom-up methods to synthesize CNDs always include dehydration of amino and carboxylate groups followed by aromatization and carbonization.25–27 Proteins, natural bio-macromolecules possessing an abundance of functional groups, have been used as effective carbon sources to construct CNDs.18,22,28–30 In these previous works, similar methods were applied to form CNDs, using bovine serum albumin (BSA) as the main carbon source for providing functional groups, and denaturing agents such as urea, acetic acid, or ethanol to transform the proteins into unfolded peptide chains. However, these CNDs mostly showed excitation-dependent emissions with relatively low quantum yields.18,22,28 Furthermore, various surface groups such as –OH, –COOH, and –NH2 were present together on the surface of the CNDs, as indicated by FTIR and XPS data.18,29 This was probably due to limited control of the synthesis process in these studies. In any event, only a small number of protein-derived CNDs were applied to the sensing of metal ions,22,29 and the mechanism was not discussed.
Herein, we developed a simple and green synthetic approach for preparing water-soluble, fluorescent carbon nanodots derived from β-lactoglobulin (LG) by hydrothermal treatment. Compared to BSA, LG is smaller, less hydrophobic, and highly resistant to proteolytic degradation. Thus, LG has been used as a capping agent for synthesis of Ag2S31 and PbS32 quantum dots. Additionally, ethylenediamine (EDA) was selected, on account of the reactive –NH2 groups at both ends of its carbon chain. EDA is an organic compound which has been widely used for preparation of carbon-based nanoparticles.33,34 A formation mechanism was proposed and confirmed by UV-vis, PL, FTIR, and XPS data. Due to the consumption of protein carboxyl groups during the synthesis process, a uniform coverage of –NH2 groups on the surface of CNDs was achieved, and the CNDs showed a sensitive response to Cu2+. Moreover, with the reduction of trap states and a high content of N doping, the as-prepared CNDs showed a high quantum yield, and the emission from LOMO to HOMO dominated the fluorescence spectra, resulting in an excitation-independent property.
Experimental
Materials
β-Lactoglobulin (LG, molecular weight ∼ 18 kDa) was purchased from Sigma (USA). Ethylenediamine (EDA) was purchased from Shanghai Chemical Reagents Company (China). Milli-Q water was used as the solvent for all solutions. All reagents were used without further purification.Preparation of carbon nanodots
Carbon nanodots were prepared in aqueous solution by means of a one-step hydrothermal method. Typically, 100 mg of β-lactoglobulin was dissolved in 10 mL of deionized water. Then, a further 10 mL of water, which contained a specific amount of ethylenediamine (0–750 μL), was added dropwise to the above LG solution under stirring. The LG protein can be denatured and transformed into linear peptide polymers under alkaline conditions.22 In the absence of EDA, the pH value of the LG solution was adjusted to 11 with 20 μL of concentrated NaOH. In the presence of EDA (from 15–750 μL), the pH value already exceeded 11 so no further adjustment was applied. The mixed solution then underwent hydrothermal synthesis at 200 °C for 7 h. The as-prepared CNDs were cooled naturally to room temperature and concentrated by rotary evaporation. Purification was achieved by dialysis (0.5 KD) for about 2 days, and the obtained CNDs were stored at 4 °C.Selective detection of metal ions
To investigate the effect of metal ions on the fluorescence property of CNDs, different types of metal salts were used as follows: Zn(NO3)2, FeCl2, FeCl3, Cu(NO3)2, Hg(NO3)2, Pb(NO3)2, Mg(NO3)2, CdCl2, and CaCl2. Typically, 1 mL aqueous solutions of 450 μM metal salts were freshly prepared and mixed with 2 mL of diluted CNDs solution. The absorbance values of CNDs in the mixed solution were set to 0.1. The fluorescence measurement was performed after equilibrating for 20 min.Structural and optical characterizations
Transmission electron microscopy (TEM) and high-resolution TEM (HRTEM) images were recorded from a JEOL-2011 electron microscope (JEOL, Tokyo, Japan) with an accelerating voltage of 200 kV. Samples for TEM and HRTEM were prepared by dropping CNDs solution onto a carbon-coated copper grid. Powder X-ray diffraction (XRD) spectra were measured on a Philips X'Pert diffractometer using Cu Kα radiation. Fourier transform infrared (FTIR) spectra were recorded on a Thermo-Nicolet transform infrared spectrometer (Nicolet/Nexus 670). X-ray photoelectron spectroscopy (XPS) analyses were carried out using an ESCALAB 250 spectrometer equipped with a monochromatic X-ray source with Al Kα excitation (1486.6 eV). CNDs powder for XRD, FTIR, and XPS samples was obtained by freeze drying. UV-vis absorption spectra were recorded using a Lambda 950 UV-vis spectrophotometer (Perkin Elmer, USA). Photoluminescence (PL) spectra were obtained using a Shimadzu RF-6310PC spectrofluorometer (Shimadzu Corporation, Columbia, MD, USA). Time-resolved fluorescence decay curves were obtained using a Horiba Jobin Yvon single-photon counting system with a 375 nm diode and a 1 MHz repetition rate and 1.3 ns pulse width.Calculation of fluorescence quantum yield
Quinine sulfate dissolved in 0.1 M H2SO4 (literature quantum yield = 54%) was selected as a reference standard. The quantum yield of the CNDs was calculated by comparing the integrated photoluminescence intensities (excited at 320 nm) and the absorbance values at 320 nm of the CNDs with the reference quinine sulfate. Absorbance values for all the solutions were measured at the excitation wavelength. Then, a graph was plotted of the integrated fluorescence intensity against the absorbance and a trend line was produced for each curve, with its intercept at zero. Absolute values were calculated according to the following equation:
 | (1) |
Results and discussion
Structure characterization
The structure and surface groups were confirmed through TEM, HRTEM, and FTIR analysis. TEM and HRTEM images of CNDs are shown in Fig. 1. The CNDs had spherical shape and good monodispersity (Fig. 1a–c). The average diameter of the nanoparticles was measured as about 8.42 nm. The well-resolved lattice fringe in HRTEM images (Fig. 1d and e) confirmed the good crystalline nature of the CNDs. Fig. 2 shows the powder XRD pattern of the CNDs. The broad diffractive peak at 18.21° revealed the amorphous nature of the CNDs,20 while the peak at 26.18° (d002) was attributed to highly disordered carbon, similar to graphite lattice spacing.23,26,35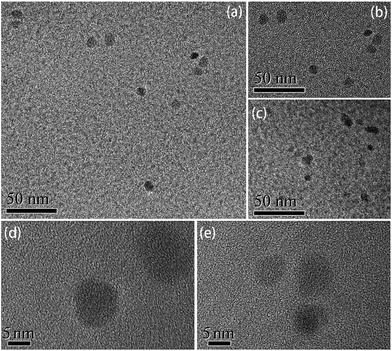 | ||
| Fig. 1 TEM (a–c) and HRTEM (d and e) images of the CNDs prepared with the addition of 300 μL of EDA. | ||
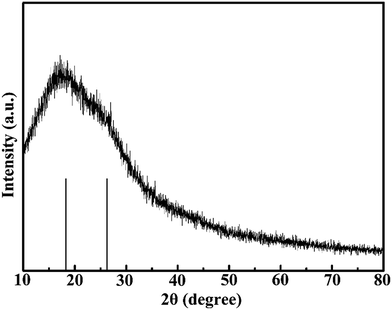 | ||
| Fig. 2 XRD pattern of CNDs. The black bars at the bottom represent the peak position of the pattern. | ||
Optical properties
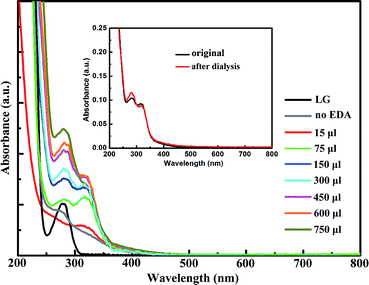
To investigate the optical properties of the CNDs prepared in the presence of EDA, UV-vis spectra of the CNDs prepared with different amounts of EDA are shown in Fig. 3. Without EDA, the protein can also form fluorescent nanodots (named as LG-CND) in basic solution, with a weak absorption shoulder which may come from residual protein, as pure LG showed an absorption peak at about 280 nm. However, we believe that the peaks at 280 nm in the curves of CNDs prepared with EDA (named as EDA-CND) originated from the n–π* transition23 of C![[double bond, length as m-dash]](https://www.rsc.org/images/entities/char_e001.gif) O bonds in the carbonic core rather than in the LG protein, because with a small amount of EDA (15 μL), the peak at 280 nm disappeared, due to complete denaturing of the protein. A new absorption band was observed in EDA-CND at 317 nm, which can be assigned to the π–π* transition of surface groups.26 As supplementary data, UV-vis spectra of the CNDs before and after dialysis were recorded. As impurities in solution are likely to adsorb to the surface of CNDs, the intensity of the 317 nm peak, which is related to surface groups, should decrease after purification, which is consistent with the data (inset in Fig. 3). With additional amounts of EDA, the ratio of the intensity of the 280 nm peak to that of the 317 nm peak gradually increased. Based on the above discussion, this indicated formation of the graphite structure and ordering of the surfaces of the CNDs.
O bonds in the carbonic core rather than in the LG protein, because with a small amount of EDA (15 μL), the peak at 280 nm disappeared, due to complete denaturing of the protein. A new absorption band was observed in EDA-CND at 317 nm, which can be assigned to the π–π* transition of surface groups.26 As supplementary data, UV-vis spectra of the CNDs before and after dialysis were recorded. As impurities in solution are likely to adsorb to the surface of CNDs, the intensity of the 317 nm peak, which is related to surface groups, should decrease after purification, which is consistent with the data (inset in Fig. 3). With additional amounts of EDA, the ratio of the intensity of the 280 nm peak to that of the 317 nm peak gradually increased. Based on the above discussion, this indicated formation of the graphite structure and ordering of the surfaces of the CNDs.
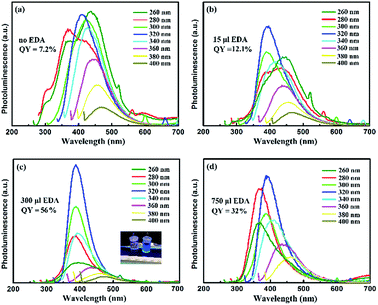
The PL spectra of CNDs excited by various excitation wavelengths are shown in Fig. 4. In the cases of no EDA (Fig. 4a) and 15 μL addition of EDA (Fig. 4b), the CNDs clearly showed excitation-dependent emission. There existed multiple peaks upon high-energy excitation, and trap emission could be found in the wavelength range of 600–800 nm, indicating multiple transition modes of the CNDs due to various energy levels. These energy levels were probably caused by formation of a disordered structure during the intermolecular dehydration process and poor passivation of the surfaces of CNDs. On the other hand, the position of the emission peaks for CNDs synthesized with 300 μL addition of EDA remained almost unchanged in the excitation wavelength range of 280–340 nm (Fig. 4c). Further increase of excitation wavelength led to a red-shift of the emission wavelength as well as a large decrease in the fluorescence intensity. Surface states are known to introduce emission levels between HOMO and LUMO, which cause the excitation-dependent behaviour of CNDs.36,37 Thus, the emission occurring with an excitation wavelength above 340 nm can be assigned to the trap states. The low fluorescence intensity of these peaks indicated the relatively low proportion of trap emission compared to the intrinsic emission that came from the radiative transition of sp2 carbon. With a further increase in the amount of EDA, the emission of CNDs again showed excitation dependence (Fig. 4d). This was caused by excess amino groups on the surfaces of the CNDs giving rise to non-radiative defects, which is commonly observed in the case of semiconductor quantum dots.38
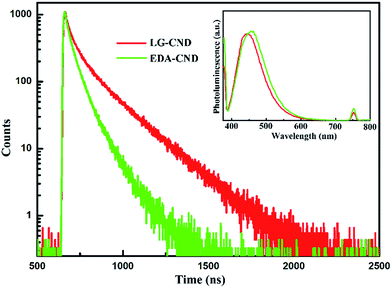
To further investigate the fluorescence property of the CNDs, lifetime measurements were carried out, and the PL decay curves of LG-CND and EDA-CND are shown in Fig. 5. As discussed above, upon excitation at 375 nm, the emission at 444 nm (LG-CND) and 458 nm (EDA-CND) originated from trap states. As shown in Fig. 5, an obvious decrease in lifetime was observed in CNDs prepared with EDA. The decay curve can be fitted into a multiexponential function with three lifetimes. Fitting parameters are listed in Table 1. The average lifetime was calculated using eqn (2):
 | (2) |
| τ1/ns | τ2/ns | τ3/ns | 〈τ〉/ns | |
|---|---|---|---|---|
| LG-CND | 2.23 | 6.89 | 21.69 | 9.76 |
| EDA-CND | 1.30 | 4.46 | 10.61 | 4.68 |
The average lifetimes of LG-CND and EDA-CND were calculated to be 9.76 ns and 4.68 ns, respectively. The reduced lifetime of trap emission in EDA-CND indicated the effective passivation of trap states by EDA. Moreover, in agreement with the PL and lifetime spectra, the quantum yield of the CNDs reached the highest value of 56% with addition of 300 μL of EDA. A photograph of CNDs showing strong blue emission under a UV lamp is shown in the inset of Fig. 4c. To the best of our knowledge, this is the highest quantum yield for CNDs derived from protein.18,22,28–30
Characterization of surface groups
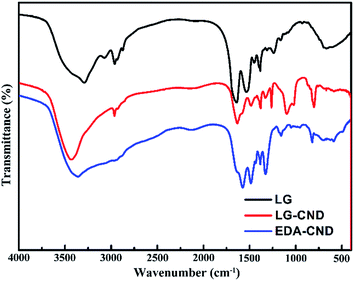
Next, FTIR and XPS spectroscopy were used to investigate the surface functional groups of CNDs. FTIR spectra of LG protein, LG-CND, and EDA-CND are shown in Fig. 6. In all three curves, O–H and –CH2– groups were confirmed by peaks at 3300–3500 cm−1 and 1380 cm−1, respectively. In the curves of both kinds of CNDs, a unique peak at about 810 nm appeared, which can be assigned to the vibration of an epoxy group,26 indicating formation of the sp2 carbonic core. In addition, the peaks at 1638 cm−1, 1578 cm−1, and 1482 cm−1 can be assigned to the amide I C![[double bond, length as m-dash]](https://www.rsc.org/images/entities/char_e001.gif) O,20 amide II N–H,17,39 and amide III C–N stretching vibrations,40 respectively. These peaks confirmed the formation of amide bonds, resulting from a dehydration reaction between carboxyl and amino groups. Comparing the two kinds of CNDs, in the curve for EDA-CND the absorption intensity of the N–H peak was stronger, whereas the intensity of the C
O,20 amide II N–H,17,39 and amide III C–N stretching vibrations,40 respectively. These peaks confirmed the formation of amide bonds, resulting from a dehydration reaction between carboxyl and amino groups. Comparing the two kinds of CNDs, in the curve for EDA-CND the absorption intensity of the N–H peak was stronger, whereas the intensity of the C![[double bond, length as m-dash]](https://www.rsc.org/images/entities/char_e001.gif) O peak was weaker, than in the curve for LG-CND. This indicated that more amino groups were present in EDA-CND.
O peak was weaker, than in the curve for LG-CND. This indicated that more amino groups were present in EDA-CND.
To further investigate the surface groups of CNDs, XPS measurements of LG-CND (Fig. 7a–c) and EDA-CND (Fig. 7d–f) were carried out. In the spectra of both kinds of CNDs, the C1s spectrum revealed different types of carbon atoms: graphitic (C![[double bond, length as m-dash]](https://www.rsc.org/images/entities/char_e001.gif) C) or aliphatic (C–C); oxygenated (C–O); and nitrous (C
C) or aliphatic (C–C); oxygenated (C–O); and nitrous (C![[double bond, length as m-dash]](https://www.rsc.org/images/entities/char_e001.gif) O or C
O or C![[double bond, length as m-dash]](https://www.rsc.org/images/entities/char_e001.gif) N).18 Moreover, the N1s spectrum showed two peaks which were attributed to aromatic N and surface –NH2 groups, respectively.23 In the spectrum of EDA-CND, the oxygen content decreased while the carbon content increased (Table 2), and the peak intensity of C
N).18 Moreover, the N1s spectrum showed two peaks which were attributed to aromatic N and surface –NH2 groups, respectively.23 In the spectrum of EDA-CND, the oxygen content decreased while the carbon content increased (Table 2), and the peak intensity of C![[double bond, length as m-dash]](https://www.rsc.org/images/entities/char_e001.gif) C/C–C was higher (Fig. 7b and e). This indicated a higher content of a graphite structure, due to more adequate carbonization, which is consistent with the UV-vis data in Fig. 3. Meanwhile, the nitrogen content in EDA-CND was higher (Table 2), and in the N1s spectrum (Fig. 7c and f), the ratio of the peak intensities for –NH2 and –CONH was larger. This provided evidence that there existed more surface –NH2 groups in EDA-CND, which would be important for Cu2+ ion detection.
C/C–C was higher (Fig. 7b and e). This indicated a higher content of a graphite structure, due to more adequate carbonization, which is consistent with the UV-vis data in Fig. 3. Meanwhile, the nitrogen content in EDA-CND was higher (Table 2), and in the N1s spectrum (Fig. 7c and f), the ratio of the peak intensities for –NH2 and –CONH was larger. This provided evidence that there existed more surface –NH2 groups in EDA-CND, which would be important for Cu2+ ion detection.
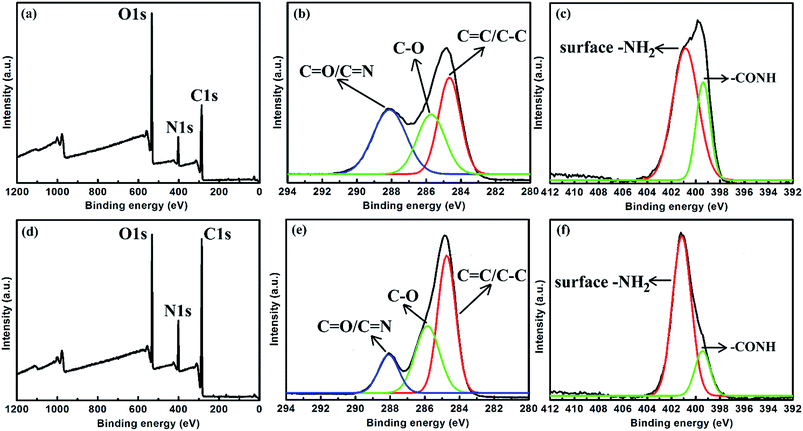 | ||
| Fig. 7 XPS survey spectra of (a) LG-CND and (d) EDA-CND. The detailed (high-resolution) scans of (b) C1s and (c) N1s of LG-CND. The detailed (high-resolution) scans of (e) C1s and (f) N1s of EDA-CND. | ||
| C | O | N | |
|---|---|---|---|
| LG-CND | 66.29% | 24.00% | 9.71% |
| EDA-CND | 73.24% | 15.04% | 11.72% |
Sensitive detection of Cu2+
The interaction between CNDs and Cu2+ was investigated by optical characterization. In the UV-vis spectra in Fig. 8, the CNDs had two absorption bands centered at 280 and 317 nm. However, after adding 150 μM Cu2+, the absorption band at 280 nm disappeared, and another new broad band in the range from 500 to 700 nm (inset in Fig. 8a and b) appeared. This indicated combination of Cu2+ ions with the amino groups on the surfaces of CNDs, which was similar to other CNDs with abundant amino groups in a previous report.41 Furthermore, in the PL spectra in Fig. 8, addition of Cu2+ ions gave rise to a significant decrease in the fluorescence intensity of EDA-CND (Fig. 8b), while Cu2+ at the same concentration had little effect on the fluorescence of LG-CND (Fig. 8a). The UV-vis and PL data clearly indicated the strong interaction of Cu2+ with the amino groups on the surfaces of EDA-CND.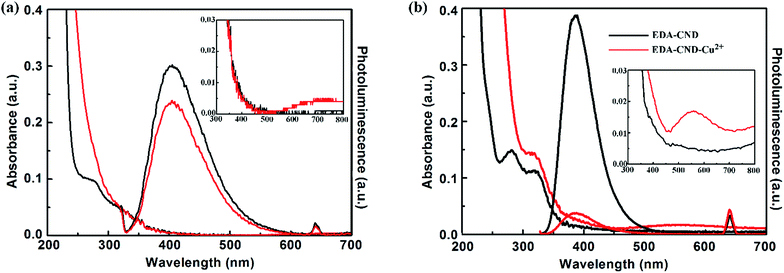 | ||
| Fig. 8 UV-vis and PL spectra of LG-CNDs (a) and EDA-CNDs (b) solution in the absence and presence of 150 μM Cu2+. | ||
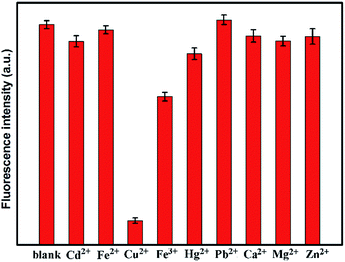
The selectivity of the EDA-CND sensing system was then evaluated. A variety of metal ions including Cd2+, Hg2+, Fe2+, Fe3+, Pb2+, Ca2+, Mg2+, and Zn2+ were examined. Fig. 9 shows the fluorescence intensity of CNDs solutions containing Cu2+ and other metal ions (150 μM). It can be seen that other metal ions had little influence on the fluorescence of CNDs, indicating that the CNDs were highly selective for Cu2+ as compared to other metal ions.
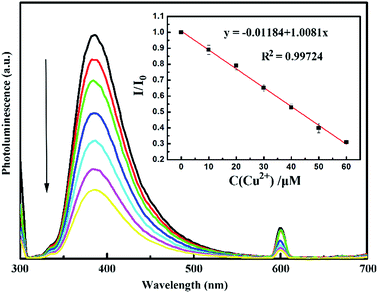
To determine the detection limit, different concentrations of Cu2+ ranging from 10 to 60 μM were mixed with CNDs, and the corresponding fluorescence spectra were measured after 20 min. The relationship between I/I0 and concentration of Cu2+ is shown in Fig. 10. The quenching effect can be described by the Stern–Volmer eqn (3):
 | (3) |
Mechanism of formation of CNDs
Based on the data and the discussion above, we propose a formation mechanism for the CNDs (Scheme 1). In general, the LG protein was first denatured into unfolded peptide chains in basic solution (Scheme 1a). With increasing heating time, dehydration of the amino groups in the EDA and of carboxyl groups in the protein occurred (Scheme 1b), C![[double bond, length as m-dash]](https://www.rsc.org/images/entities/char_e001.gif) C bonds were formed inside the peptide network, resulting in aromatic clusters (Scheme 1c), and nucleation of CNDs took place (Scheme 1d).22
C bonds were formed inside the peptide network, resulting in aromatic clusters (Scheme 1c), and nucleation of CNDs took place (Scheme 1d).22
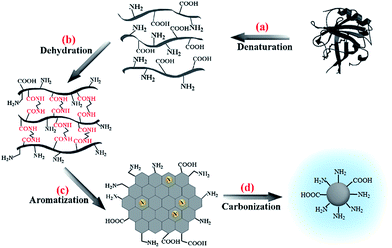 | ||
| Scheme 1 A formation mechanism for CNDs derived from β-lactoglobulin in the presence of ethylenediamine. | ||
In previous studies involving protein-derived CNDs, the synthesis process was based on intermolecular dehydration between peptide chains of the protein, while various other denaturing reagents,22 crosslinking18 reagents, or a stabilizer28 were used. In this work, EDA can act both as the denaturing agent and as a reaction precursor for synthesis of the CNDs. EDA is an organic compound with strong basicity and two reactive amino groups, and it has been proven to be an efficient precursor for preparing CNDs. Previous studies also found EDA to be optimal in comparison with various other amino-containing molecules, when molecules containing single amino groups led to inadequate condensation polymerization.26 As shown in Scheme 1b, in the presence of EDA, amino groups at both ends of the short chain of EDA could react with carboxyl groups in the LG protein, and the peptide chains of the protein were then linked by EDA instead of through intermolecular crosslinking. Carbonization then took place and resulted in CNDs with strong fluorescence.
Our results revealed that EDA played a key role in the improvement of both optical properties and sensitivity to Cu2+ of the CNDs. The reason can be explained as follows. First, the regular structure obtained by this strategy could result in fewer defects inside the CNDs, and the degree of N doping was improved by incorporation of amine groups into the CNDs (confirmed by XPS data), which was believed to be responsible for high luminescence of CNDs.42,43 In addition, –NH2 groups exposed on the surface of CNDs could act as surface passivation agents which reduced the surface trap states.23 As a consequence, the EDA-CNDs showed excitation-independent emission and high quantum yield when compared to LG-EDA. The strong fluorescence and stable emission of the CND paved the way for its application in sensing.
Most importantly, the high alkalinity of the EDA molecule, which means strong protonation of –NH2 groups in aqueous solution, facilitated its interaction with –COOH groups in the LG protein.26 However, in previous studies, the long chain of TTDDA,28 or the weak protonation of –NH2 groups in urea,22 prevented full participation in the reaction. In previous accounts, CNDs prepared from proteins have seldom been reported to be sensitive to Cu2+.18,22,28–30 The interference of diverse types of surface groups in CNDs prepared directly from proteins could reduce their sensitivity to Cu2+, which specifically bonds with –NH2 groups. In our work, the participation of EDA in the formation of CNDs led to consumption of the carboxyl groups in the protein, and resulted in a homogeneous coverage of –NH2 groups on the surfaces of the CNDs obtained (confirmed by FTIR and XPS data). As revealed by the data, the high sensitivity and selectivity of our CNDs to Cu2+ ions provided evidence for the proposed mechanism.
Conclusions
In summary, a hydrothermal treatment of β-lactoglobulin in the presence of ethylenediamine has been proven to be an effective strategy for producing fluorescent CNDs. During the synthesis process, EDA acted as both denaturing agent and reaction precursor. Owing to the high degree of N doping and surface passivation by amino groups, the as-prepared CNDs showed excitation-independent emission and high quantum yield. Moreover, the surface groups of the CNDs can be adjusted through varying the amount of EDA used. Due to the consumption of –COOH groups of the LG protein during synthesis of the CNDs, the surfaces of the CNDs were homogeneously covered with –NH2 groups. Finally, the CNDs obtained showed high sensitivity and good selectivity for the detection of Cu2+. On account of their superior optical characteristics and sensitivity, these CNDs are very promising for applications in sensing.Acknowledgements
This research was supported by the Natural Science Foundation of Shanghai (No. 16ZR1424400), Shanghai Municipal Education Committee Key Laboratory of Molecular Imaging Probes and Sensors for Shanghai Universities, and the Industrial Research Fund of Wuhu Token Sciences Co., Ltd. Prof. Lei Huang appreciates the support of the Program for Professor of Special Appointment (Eastern Scholar) at Shanghai Institutions of Higher Learning.Notes and references
- E. L. Que, D. W. Domaille and C. J. Chang, Chem. Rev., 2008, 108, 1517–1549 CrossRef CAS PubMed
.
- K. J. Barnham, C. L. Masters and A. I. Bush, Nature, 2004, 3, 205–214 CrossRef CAS
.
- H. S. Jung, P. S. Kwon, J. W. Lee, J. I. Kim, C. S. Hong, J. W. Kim, S. H. Yan, J. Y. Lee, J. H. Lee, T. Joo and J. S. Kim, J. Am. Chem. Soc., 2009, 131, 2008–2012 CrossRef CAS PubMed
.
- R. Uauy, M. Olivares and M. Gonzalez, Am. J. Clin. Nutr., 1998, 67, 952s–959s CAS
.
- G. Gedda, C. Y. Lee, Y. C. Lin and H. F. Wu, Sens. Actuators, B, 2016, 224, 396–403 CrossRef CAS
.
- J. Chen, Y. Li, K. Lv, W. Zhong, H. Wang, Z. Wu, P. Yi and J. Jiang, Sens. Actuators, B, 2016, 224, 298–306 CrossRef CAS
.
- Y. Li, X. Q. Liu, Q. Y. Li, J. Ge, H. Liu, S. Li, L. F. Wang, J. Wang and N. Ma, Chem. Phys. Lett., 2016, 664, 127–132 CrossRef CAS
.
- W. Lu, X. Qin, S. Liu, G. Chang, Y. Zhang, Y. Luo, A. M. Asiri, A. O. Al-Youbi and X. Sun, Anal. Chem., 2012, 84, 5351–5357 CrossRef CAS PubMed
.
- J. Tian, Q. Liu, A. M. Asiri, A. O. Al-Youbi and X. Sun, Anal. Chem., 2013, 85, 5595–5599 CrossRef CAS PubMed
.
- L. Zhou, Y. Lin, Z. Huang, J. Ren and X. Qu, Chem. Commun., 2012, 48, 1147–1149 RSC
.
- H. Sun, N. Gao, L. Wu, J. Ren, W. Wei and X. Qu, Chem.–Eur. J., 2013, 19, 13362–13368 CrossRef CAS PubMed
.
- L. L. Li, J. Ji, R. Fei, C. Z. Wang, Q. Lu, J. R. Zhang, L. P. Jiang and J. J. Zhu, Adv. Funct. Mater., 2012, 22, 2971–2979 CrossRef CAS
.
- D. Wang, L. Wang, X. Y. Dong, Z. Shi and J. Jin, Carbon, 2012, 50, 2147–2154 CrossRef CAS
.
- H. Tan, W. X. Liu, B. Gong, W. Zhang, H. D. Li, D. H. Yu, H. L. Wang, G. D. Li and L. A. Lucia, Langmuir, 2015, 31, 9537–9545 CrossRef CAS PubMed
.
- S. W. Zhang, J. X. Li, M. Y. Zeng, J. Z. Xu, X. K. Wang and W. P. Hu, Nanoscale, 2014, 6, 4157–4162 RSC
.
- J. Yu, N. Song, Y.-K. Zhang, S.-X. Zhong, A.-J. Wang and J. Chen, Sens. Actuators, B, 2015, 214, 29–35 CrossRef CAS
.
- H. Liu, Z. He, L.-P. Jiang and J.-J. Zhu, ACS Appl. Mater. Interfaces, 2015, 7, 4913–4920 CAS
.
- M. Tan, X. Li, H. Wu, B. Wang and J. Wu, Colloids Surf., B, 2015, 136, 141–149 CrossRef CAS PubMed
.
- X. Hu, X. An and L. Li, Mater. Sci. Eng., C, 2016, 58, 730–736 CrossRef CAS PubMed
.
- P.-C. Hsu and H.-T. Chang, Chem. Commun., 2012, 48, 3984–3986 RSC
.
- Y. Y. Zhang, M. Wu, Y. Q. Wang, X. W. He, W. Y. Li and X. Z. Feng, Talanta, 2013, 117, 196–202 CrossRef CAS PubMed
.
- X. Liu, T. Li, Y. Hou, Q. Wu, J. Yi and G. Zhang, RSC Adv., 2016, 6, 11711–11718 RSC
.
- X. M. Li, S. L. Zhang, S. A. Kulinich, Y. L. Liu and H. B. Zeng, Sci. Rep., 2014, 4 Search PubMed
.
- R. X. Tian, S. L. Hu, L. L. Wu, Q. Chang, J. L. Yang and J. Liu, Appl. Surf. Sci., 2014, 301, 156–160 CrossRef CAS
.
- P. Zhang, W. C. Li, X. Y. Zhai, C. J. Liu, L. M. Dai and W. G. Liu, Chem. Commun., 2012, 48, 10431–10433 RSC
.
- S. Zhu, Q. Meng, L. Wang, J. Zhang, Y. Song, H. Jin, K. Zhang, H. Sun, H. Wang and B. Yang, Angew. Chem., Int. Ed., 2013, 52, 3953–3957 CrossRef CAS PubMed
.
- X. Hu, L. Cheng, N. Wang, L. Sun, W. Wang and W. Liu, RSC Adv., 2014, 4, 18818–18826 RSC
.
- Z. Zhang, J. Hao, J. Zhang, B. Zhang and J. Tang, RSC Adv., 2012, 2, 8599–8601 RSC
.
- Q. X. Yang, L. Wei, X. F. Zheng and L. H. Xiao, Sci. Rep., 2015, 5 Search PubMed
.
- V. B. Kumar, J. Sheinberger, Z. Porat, Y. Shav-Tal and A. Gedanken, J. Mater. Chem. B, 2016, 4, 2913–2920 RSC
.
- J. Chen, Y. Kong, Y. Wo, H. Fang, Y. Li, T. Zhang, Y. Dong, Y. Ge, Z. Wu, D. Zhou and S. Chen, J. Mater. Chem. B, 2016, 4, 6271–6278 RSC
.
- J. Chen, Y. F. Kong, W. Wang, H. W. Fang, Y. Wo, D. J. Zhou, Z. Y. Wu, Y. X. Li and S. Y. Chen, Chem. Commun., 2016, 52, 4025–4028 RSC
.
- S. Liu, J. Tian, L. Wang, Y. Luo, J. Zhai and X. Sun, J. Mater. Chem., 2011, 21, 11726–11729 RSC
.
- S. Liu, J. Tian, L. Wang, Y. Luo and X. Sun, RSC Adv., 2012, 2, 411–413 RSC
.
- Y. H. Yang, J. H. Cui, M. T. Zheng, C. F. Hu, S. Z. Tan, Y. Xiao, Q. Yang and Y. L. Liu, Chem. Commun., 2012, 48, 380–382 RSC
.
- J. Z. Shang, L. Ma, J. W. Li, W. Ai, T. Yu and G. G. Gurzadyan, Sci. Rep., 2012, 2 Search PubMed
.
- L. Bao, Z.-L. Zhang, Z.-Q. Tian, L. Zhang, C. Liu, Y. Lin, B. Qi and D.-W. Pang, Adv. Mater., 2011, 23, 5801–5806 CrossRef CAS PubMed
.
- L. H. Yuwen, H. T. Lu, Y. He, L. Q. Chen, M. Hu, B. Q. Bao, F. Boey, H. Zhang and L. H. Wang, J. Mater. Chem., 2010, 20, 2788–2793 RSC
.
- P. Karfa, E. Roy, S. Patra, S. Kumar, A. Tarafdar, R. Madhuri and P. K. Sharma, RSC Adv., 2015, 5, 58141–58153 RSC
.
- J. Jiang, Y. He, S. Li and H. Cui, Chem. Commun., 2012, 48, 9634–9636 RSC
.
- Y. Dong, R. Wang, G. Li, C. Chen, Y. Chi and G. Chen, Anal. Chem., 2012, 84, 6220–6224 CrossRef CAS PubMed
.
- J. Zhou, X. Zhou, R. Li, X. Sun, Z. Ding, J. Cutler and T.-K. Sham, Chem. Phys. Lett., 2009, 474, 320–324 CrossRef CAS
.
- X. Huang, L. Yang, S. Hao, B. Zheng, L. Yan, F. Qu, A. M. Asiri and X. Sun, Inorg. Chem. Front., 2017 Search PubMed
.
| This journal is © The Royal Society of Chemistry 2017 |

