 Open Access Article
Creative Commons Attribution 3.0 Unported Licence
Negative thermal expansion of pure and doped graphene
Sarita Mann,
Ranjan Kumar and
V. K. Jindal *
*
Department of Physics, Panjab University, Chandigarh-160014, India. E-mail: Jindal@pu.ac.in
First published on 24th April 2017
Abstract
Graphene and its derivatives distinguish themselves for their large negative thermal expansion even at temperatures as high as 1000 K. The linear thermal expansion coefficients (LTEC) of two-dimensional honeycomb structured pure graphene and B/N doped graphene are analyzed using ab initio density functional perturbation theory (DFPT) employed in VASP software under quasiharmonic approximation. One of the essential ingredients required is the phonon frequencies for a set of points in the Brillouin zone and their volume dependence. These were obtained from the dynamical matrix which was calculated using VASP code in interface with phonopy code. In particular, the transverse acoustic modes (ZA) behave drastically differently as compared to planer modes and so also their volume dependence. Using this approach firstly thermal expansion for pure graphene is calculated. The results agree with earlier calculations using similar approach. Thereafter we have studied the effect of boron and nitrogen doping on LTEC. The LTEC of graphene is found to be negative in the entire range of temperature under study (0–1000 K) and its value at room temperature (RT) is around −3.26 × 10⁻⁶ K−1. The value of LTEC at RT becomes more negative with B/N doping in graphene. In order to get an insight into the cause of negative thermal expansion, we have computed the contribution of individual phonon modes of vibration. We notice that it is principally the ZA modes which are responsible for negative thermal expansion. It has been concluded that transverse mode in 2D hexagonal lattices have an important role to play in many of the thermodynamical properties of 2D structures. We have extended the study to calculate the LTEC of h-BN sheet also.
1. Introduction
The first successful experimental synthesis of graphene,1 a 2D thermodynamically stable structure of carbon, created a great deal of research interest. In graphene, sp2 hybridized carbon atoms are arranged in a honeycomb lattice structure. It has attracted great scientific interest mainly because of its unusual electronic properties. In fact it has been identified as a very promising candidate as a future application material, based on its chemical and mechanical stability along with ballistic transport at room temperature (RT).2 Its charge carriers exhibit very high intrinsic mobility. Its special electronic transport which is governed by a Dirac-like-equation makes it act as a bridge between the condensed matter physics and electrodynamics.3–5 There has been a lot of research ongoing to study and modify electronic and optical properties of graphene by doping with a variety of atoms. We in our previous research6–8 have studied the band gap modification and optical behavior by optical behavior by replacing some percentage of the carbon atoms with nitrogen/boron atom dopants.Equally important aspect of graphene is its unique thermal properties. Its thermal conductivity is unusually high9 which is a subject of intensive research. Heat flow hindrance in miniature components is a matter of concern in the micro and nano-electronics. There is a lot of research ongoing in this area. In addition to this, graphene also has unusual negative linear thermal expansion coefficient (LTEC) as reported by several authors.10–15 Mounet et al.10 have made a detailed study of LTEC of carbon materials including graphene using first-principles based quantum espresso code under quasi harmonic approximation (QHA). They report the LTEC for graphene upto temperatures as high as 2500 K with a RT value around −3.6 × 10⁻⁶ K−1. Calculations made by Monte Carlo simulations11 estimated the average value of LTEC of graphene to be −4.8 × 10⁻⁶ K−1 between the temperatures ranges 0–300 K and estimated negative behavior only up to 900 K. We also notice a calculation12 determining the LTEC of graphene using non-equilibrium green's function with and without substrate. They report large negative values of LTEC at low temperature region and small positive values at high-temperature region, with a RT value of −6 × 10⁻⁶ K−1. Thereafter Sevik13 has reported similar results as10 for graphene using DFPT implemented in VASP. However none of the above theoretical calculations bring out clearly the origin of the negative thermal expansion though it remains a feature of 2D systems which is also found to be reported by Kim et al.14 who observe it for graphene too. Recently, Jiang et al.15 have reviewed the significance of flexural mode of graphene. They report that flexural mode is responsible for high negative contribution to thermal expansion of graphene by studying the contribution of individual phonon modes to thermal expansion. Michel et al.16 have made a detailed analysis on the role of anharmonic phonons on 2D crystals reporting negative thermal expansion whenever flexural modes are involved. They17 also report selective contribution from various acoustic modes to thermal expansion in graphene and introduce finite size to check the divergent Grüneisen parameter from flexural modes.
Experimental studies of thermal expansion of graphene have also been reported.18–20 Bao et al.18 have measured the change in length of suspended graphene sample and estimated the LTEC of graphene in a narrow range of temperature (300–400 K), which remains negative only upto 350 K with a RT value of −7 × 10⁻⁶ K−1. Yoon et al.19 have measured temperature dependent Raman shift in G band of graphene and analytically estimated the LTEC in temperature range of (200–400) K, with RT value of (−8 ± 0.7) × 10−6 K−1. Similarly, Pan W. et al.20 also report useful data for thermal expansion in the high temperature range from RT to above 1000 K from the measured Raman shifts of G and 2D peaks in graphene. Most of the theoretical estimates10–17 underestimate the experimental observations.
The h-BN (hexagonal-boron nitride) sheet is another two-dimensional (2D) material which has attracted great attention in last few years due to its interesting application related properties.21,22 The h-BN crystal structure is similar to graphene as boron and nitrogen atoms are arranged in sp2 bonded 2D hexagonal structure. In the h-BN sheet, nitrogen and boron atoms are attached by strong covalent bonds. Despite the polar nature of the BN bond in contrast to graphene which lead to significant electronic structural changes, its elastic properties remain similar. h-BN distinguishes itself also because of a large band gap of 5–6 eV as compared to zero band gap in graphene.23 It also shows high thermal stability, large dielectric breakdown and enhanced chemical inertness compared to graphene. On account of these properties, it becomes a useful material for applications in industries. Therefore, it follows naturally that the unique electronic properties are supplemented by a study of their thermodynamic and phonon related properties as well, only then the full potential in the applications of graphene or doped graphene or BN sheet is exploited. Sevik13 has also studied LTEC of h-BN sheet using VASP software and reported negative thermal expansion with almost double the RT value as compared to graphene. Thomas et al.24 have studied the LTEC of h-BN sheet using molecular dynamics and shows negative LTEC at low temperature.
Negative LTEC is crucial, as it is reported in almost all 2D substances. Moreover, this phenomenon initiates at low temperature. At finite temperature, LTEC is negative due to out-of-plane vibrations as reported in theoretical calculation25 of self-consistent phonons.
We have previously studied the phonon dispersion and various thermal properties like specific heat, entropy and free energy of pure graphene and how they varied with different B and N doping concentrations for graphene26 where we also reported some estimates of LTEC for pure graphene. Since these estimates gave us negative values of thermal expansion, we now recalculate the estimates by carefully understanding the origin of negative expansion.
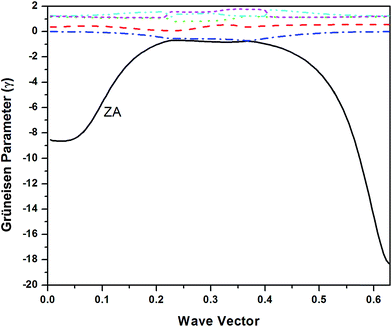
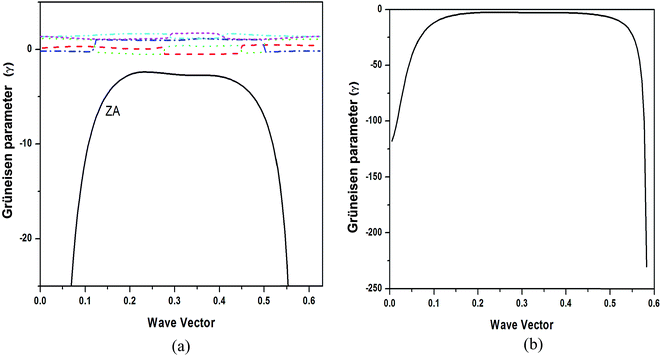
Therefore apart from study of thermal expansion, the primary goal of this paper has been to emphasize on the reasons for negative thermal expansion by focusing on contribution by individual phonon branches. Due to the 2-D structure of graphene with 2 atoms per unit cell, the 4 external phonon branches are usually present with 2 acoustic and 2 optic ones. The external branches arise due to intermolecular vibrations representing lattice modes. We calculate their contribution to thermal expansion separately. The other two branches in the transverse direction identified as ZA (transverse acoustic) and ZO (transverse optic) originate due to quasi-2D behavior and are very special modes of vibration for 2-D structures. Their restoring forces are derived from in plane modes and these behave very differently. Realizing that the Grüneisen parameter for ZA mode is largely negative, we have focused on its contribution separately from other branches and found that it is the most important branch which accounts for NTE in graphene. Although a detailed study for pure graphene looking into the negative thermal expansion has been made17 but we have extended the LTEC study of graphene to doped graphene also by varying the boron and nitrogen dopant concentrations leading to h-BN sheet. Therefore despite the fact that quite a lot has been studied recently outlining the significance of ZA mode on thermal properties of graphene, this study supplements the recent study on the subject, giving detailed results of temperature dependence on thermal expansion and comparing most of the available results. Since pure graphene is not a suitable material for device applications, a study of doped graphene based on B or N will be of great practical use.
The present paper is structured as follows. After Introduction in Section 1 where graphene, the overview of its various electronic and thermodynamic properties and h-BN and its various properties are presented, a brief summary of theory and computational details are presented in Sec. 2. Section 3 gives results and discussion which includes lattice thermo-dynamical properties like thermal expansion, surface bulk modulus and mode Grüneisen parameters as acquired from the variation of free energy with volume for pure graphene, B and N doped graphene and h-BN sheet. Sec. 4 contains Summary and conclusions.
2. Theory and computational details
2.1 Theory
To calculate the frequencies of phonon, the VASP (Vienna Ab-initio Simulation Package)27,28 code which is a density functional theory (DFT) based software was used in combination with phonopy29 software. The VASP software is based on ab initio density functional theory. The position coordinates of the atoms in unit cell and lattice parameters are given as input to the software with necessary conditions set by input parameters for cell relaxation. After relaxing the cell for minimum energy configuration, the lattice parameter of the structure is calculated. The structure is given small perturbations through displacements of atoms and VASP is again run under density perturbation theory for calculation of the dynamical matrix. The phonopy code uses the dynamical matrix obtained in the VASP to calculate the phonons and related thermodynamic properties. Under quasi harmonic approximation, thermal expansion gives rise to implicit shift in phonon frequencies and can be procured from dependence of the phonon frequencies on volumes, termed as Grüneisen parameter that can be defined30,31 as
 | (1) |
The mode Grüneisen parameters are the key ingredient in thermal expansion mechanisms. These parameters are generally positive but for some modes and for specific q values, they are found to be negative in a narrow temperature range. They are highly negative for lowest acoustic mode in case of graphene which gives negative values for thermal expansion coefficient at low temperatures. This may be due to that fact that only lower acoustic modes can be excited at low temperatures.
In absence of external pressure, the equilibrium structure of a crystal structure can be obtained at temperature T by free energy minimization w.r.t. its degrees of freedom.
The expression for quasi-harmonic free energy is written as30
 | (2) |
 | (3) |
 | (4) |
In case of 2D structure, we define surface bulk modulus as
 | (5) |
Using condition for minimum energy, expression for thermal expansion coefficient β [derived in ref. 30] is
 | (6) |
 | (7) |
As is evident from eqn (6), the thermal expansion involves summation over all branches and the mode dependent Grüneisen parameters. It has been found that mode dependent Grüneisen parameter is very sensitive to the choice of branch. Therefore we introduce βj for each branch to calculate branch dependent thermal expansion such that
 | (8) |
2.2 Computational parameters
In the calculations, we have made use of the Perdew–Burke–Ernzerhof (PBE)32 functional which is an exchange correlational functional of generalized gradient approximation (GGA). The cut off energy for plane waves was taken as 750 eV. A 4 × 4 supercell has been employed which makes a sheet of 32 atoms to simulate the sheet of graphene. Two sheets of graphene are maintained at a separation larger than 10 Å in the transverse direction in order to avoid interlayer interactions. For sampling of Brillouin zone, the Monkhorst–pack scheme is employed. A Г centered k mesh of size 7 × 7 × 1 is used for relaxing the structure. We have made use of tetrahedron method for treating the partial occupancies with Blöchl corrections.33 The geometry of coordinates of the system was optimized till the Hellmann–Feynman forces were as low as 0.005 eV Å−1. The phonon frequencies and surface bulk modulus are used in calculation of LTEC using eqn (6) and (7).3. Results and discussion
3.1 Pure graphene
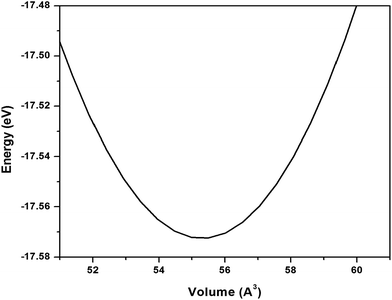
The study of pure graphene under quasiharmonic approximation gives an approximate value of Grüneisen parameters and bulk modulus which contribute in calculation of thermal expansion coefficient. We have earlier obtained the phonon dispersion for pure and B and N doped graphene and compared the dispersion curves with various theoretical and experimental results.26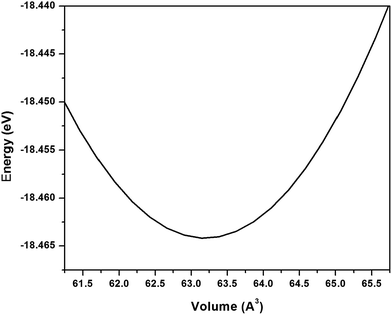 | ||
| Fig. 1 Energy–volume curve for pure graphene where volume is area multiplied by a constant height in z-direction. | ||
Thus bulk modulus using eqn (4) is obtained from second derivative of the fitted curve to the calculated E–V data as shown in Fig. 1. Hence we obtained surface bulk modulus as defined by us (eqn (5)) for pure graphene to be equal to 90.24 N m−1. The bulk modulus of graphene has earlier been studied by many authors.34–37 Reich et al.34 have reported a bulk modulus value of 700 GPa and Milowska et al.37 has reported a value of 528 GPa for pure graphene. It may be noted that for calculation of volume of the unit cell they take thickness of the cell around 3.4 Å. The 2D bulk modulus as defined by Kalosakas et al.35 has been reported to be 200 N m−1 for graphene. We have found a bulk modulus value of 262 GPa which is in qualitative agreement when compared to previous studies based on similar cell volume calculations.
As observed in Fig. 3(a), there is a large variation between theoretical and experimental data. Even the experimental data shows variation. In the low temperature regime, the size dependence might have a role to play17 – smaller size tends to reduce the large negative value but it has not been mentioned by experimentalists. Our results are in overall agreement with those of Mounet et al.10 and show a better agreement with experiments above room temperature.
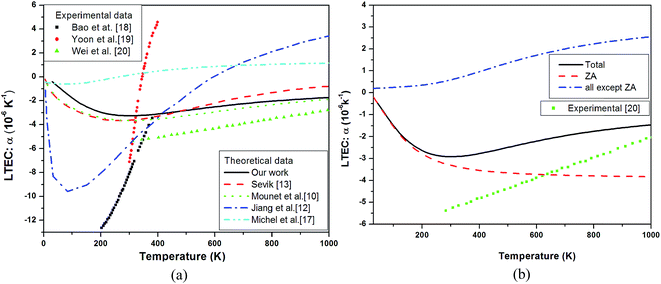 | ||
| Fig. 3 (a) Theoretical linear thermal expansion coefficient α of single layer graphene plotted as a function of temperature and compared with experimental data18 (black squares),19 (red circles) and20 (green triangles) and theoretical measurements10 (green dots),13 (red dash line),12 (blue dash dot line) and17 (cyan dash dot dot line). (b) Branch dependent thermal expansion coefficient (total-black solid line, ZA mode contribution – red dash line and all except ZA contribution – blue dash dot line) compared with experimental data20 shown by green squares in the curve. | ||
To get complete and accurate understanding of the behavior of LTEC near room temperature, which is important in designing graphene-based heat devices, we studied the branch dependent LTEC in detail.
DFPT calculations of pure graphene for LTEC calculations show a negative behavior in whole range of temperature under study with a RT value of (−3.26 × 10⁻⁶). In this calculation we have made use of surface bulk modulus calculated earlier using E–V curve. Our results matches well with the theoretical studies10,13 as shown in Fig. 3(a) but there is still a discrepancy as compared to experimental results. Theoretical measurements by ref. 12 are very close and ref. 17 are very much off to experimental value of LTEC. The reasons for this disagreement have been attributed to finite size effect incorporated by ref. 17. To analyze it further, we present partial contributions to LTEC arising from each branch separately as the phonon branch ZA in particular has large negative Grüneisen parameters and must be visualized separately. Fig. 3(b) shows the branch dependent LTEC which clearly chows that thermal expansion of graphene is negative only due to presence of large negative Grüneisen parameters corresponding to ZA branch. Here we have made use of eqn (8) to calculate branch dependent thermal expansion. The dominant contribution to thermal expansion in graphene is from ZA branch which is negative. The overall thermal expansion is negative due to dominant effect of ZA branch compared to other branches. The experimental data reported here is from three sources18–20 – all obtaining it from the shift in 2D peak and exploiting thermal expansion as responsible for the shift. However in the small domain of overlap of three measurements i.e. around 300–400 K, there is no agreement between the three. In the high temperature limit above RT our results show a reasonably good agreement with the experimental data. It may be possible that Grüneisen parameter depends on temperature but there is no theoretical or experimental estimate of dependence of Grüneisen parameters on temperature. This assumption introduces uncertainty in estimation of thermal expansion.
3.2 Doped graphene
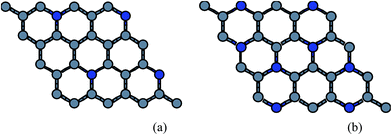
Since the B (N) doped structures are stable upto 25% doping,26 we have done the quasiharmonic study for two cases only i.e. 12.5% and 25% The atomic configurations corresponding to doped sheet is shown in Fig. 4.We have also considered the minimum doping configuration. The minimum doping can be one atom in a sheet of 32 atoms i.e. 3.125% in this case. But the configuration with low doping i.e. 1/2/3 atoms in a sheet is also thermodynamically unstable where almost all of the ZA mode frequencies are imaginary for boron doping and half of ZA frequencies are imaginary for nitrogen doping, as doping of B atoms introduces more lattice mismatch compared to N atoms doping which makes the structure thermodynamically more unstable. Thus considering one, two or three atoms doping in a hexagonal ring gives the thermodynamically unstable structures. We finally studied thermal expansion in only above two thermodynamically stable structures as already reported in our previous studies.26
3.3 h-BN sheet
To understand thermodynamic properties of h-BN sheet, the first step is to inspect lattice vibrational modes (phonons).The phonon frequencies are obtained under harmonic approximation which gives phonon dispersion curve of h-BN sheet as shown in Fig. 7. The curves have been obtained by simulating the h-BN sheet over a set of points on the line for different directions between Г points. We have made use of density functional perturbation theory with displacement along all the three directions which give rise to 6 phonon branches in dispersion curve. The phonon dispersion curve is in good agreement with ref. 38 where Wirtz et al. have studied the phonon dispersion curve using molecular dynamics. Our dispersion curve also matches with39 where vibrational properties of h-BN are studied. They have shown that in a strictly 2D material, the electrostatic interactions do not produce any macroscopic term at Г point and hence no splitting is observed between LO/TO modes in an h-BN sheet. Our phonon dispersion curve is also fairly in agreement with experimental studies40,41 done using inelastic X-ray scattering and Raman analysis methods.
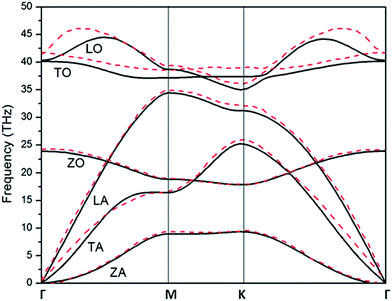 | ||
| Fig. 7 Phonon dispersion for h-BN (solid lines) compared to that in ref. 38 (red dashed lines). The longitudinal, transversal and out-of-plane acoustical/optical modes are represented by LA/LO, TA/TO and ZA/ZO respectively. | ||
The lattice constant corresponding to minimum unit cell volume is 2.515 Å. The surface bulk modulus found to be 74.6 N m−1 for h-BN sheet which is much smaller than surface bulk modulus of pure graphene.
We obtained the behavior of LTEC for h-BN sheet using DFPT under QHA as shown in Fig. 10(a). Although the RT value of LTEC is much larger than that determined by Sevik13 of the order of −12.86 × 10⁻⁶ but the behavior is in conformity with B and N doped structures. The negative thermal expansion can be explained by the existence of more negative Grüneisen parameters corresponding to the transverse acoustic (ZA) mode and lower surface bulk modulus compared to graphene explains the occurrence of negative thermal expansion. The experimentally measured values in the temperature range 0–400 K are for bulk h-BN crystals which are lower than estimates for single h-BN sheet. The prominent difference in estimates arises due to the strong anharmonic character of h-BN structure, which is not taken into account in QHA calculations. Alternately, the LTEC values predicted by Thomas et al.24 based on fully atomistic simulations gives a lower estimate compared with Sevik.13 Fig. 10(b) shows branch dependent LTEC which depicts the contribution of ZA branch is of utmost importance to total thermal expansion as compared to other branches.
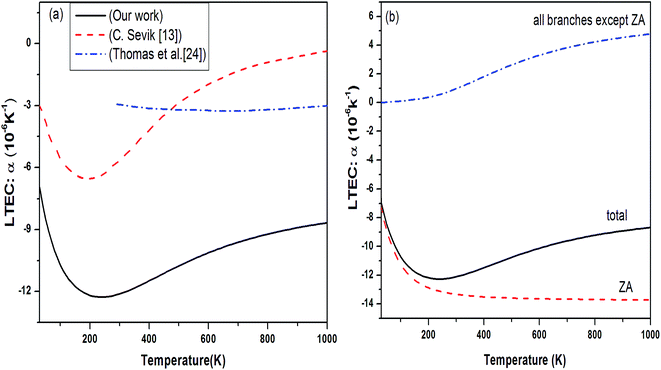 | ||
| Fig. 10 (a) Temperature dependence of LTEC for single layer h-BN black solid line. Our results are compared with various theoretical measurement (ref. 13 red dashed line and ref. 24 blue dash dot line). (b) Branch dependent thermal expansion. | ||
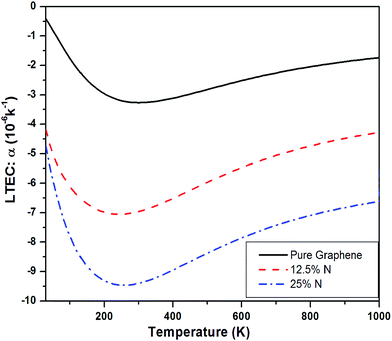
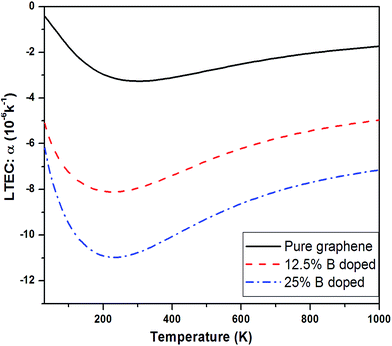
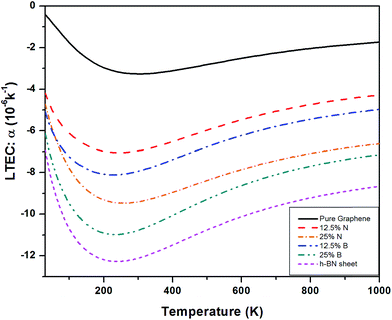
Fig. 11 shows a comparison of LTEC for pure and doped graphene compared with h-BN sheet. The graph trend shows an increase in negative thermal expansion with increase in N and B doping and further increases in h-BN sheet. We also observe that B doping makes the LTEC value more negative as compared to same doping percentage of N atom. Further we notice that our estimates are overestimating the LTEC values for h-BN sheet when compared to ref. 13 by a factor close to 2. However, our study of systematic doping by increasing B and N concentrations follows the pattern of LTEC as shown in Fig. 11 quite well where we present results for doping of graphene with individual B and N atoms going from 12.5% to 25% and finally 50% B and N doping together creating h-BN sheet.
4. Summary and conclusions
In this paper, we have made a detailed first-principles study using the quasi-harmonic approximation at the GGA-PBE level to obtain the finite temperature dependence of LTEC in pure graphene. The thermal expansion coefficient is negative in the whole temperature region under study and is in qualitatively good agreement with available theoretical data although it deviates from experimental studies especially in the low temperature region. In the high temperature region our results are in better agreement with experiments as compared to some other calculations.Thereafter we have extended the calculation to doped graphene. We have already shown that boron and nitrogen doped graphene is an interesting material whose band gap and other electronic properties can be designed by varying the concentration and type of the dopant.6,8 The calculation of thermal properties is thus of great importance for using these doped materials in practical applications.
We notice that there is consistent trend of increase in negative Grüneisen parameters with B and N doping which continues even for h-BN sheet. The values of Grüneisen parameters tend to vary by a factor of 5 or more for B or N doping upto 25%. The same concentration of B atom doping brings about larger change in the negative LTEC value as compared to N doping. The results for thermal expansion presented here for doped graphene sheet are new.
We extend this approach further by substituting all the carbon atoms by B and N atoms to obtain h-BN sheets. We have presented a study of h-BN phonon dispersion and estimated its linear thermal expansion coefficient similarly. The phonon frequencies and phonon dispersions are in good agreement with various theoretical and experimental results. Some calculations report results for thermal expansion of h-BN sheets. Although our results follow similar qualitative temperature dependence, the results differ by about a factor of two. Our results (Fig. 11) follow a pattern showing a systematic increase in thermal expansion values as the concentration of dopants increases.
On the basis of the results acquired here for various pure and different doping concentrations of 2D graphene it emerges that the negative thermal expansion originates from ZA modes. These modes result in highly negative Grüneisen parameters and their contribution dominates from the other planar modes. The planar modes (LA, LO, TA, TO) and the remaining transverse modes (ZO) contribute positively but their combined effect remains systematically smaller than the negative contribution from ZA mode. It seems that this feature will always be a unique feature of all 2D materials. Exceptions could be those 2D materials like MoS2 and MoSe2 having larger number of atoms in unit cell and many more branches in planner directions contributing positively to thermal expansion which may end up in combining to nullify most of the negative contribution from ZA mode as measured by Sevik.13
Experimental measurements for thermal expansion for graphene lack consistency. There is significant variation and unusual temperature dependence in low temperature region. More experimental work for pure graphene as well as for doped graphene for thermal expansion would be useful to correlate theoretical results.
Acknowledgements
We are grateful to VASP and phonopy team for providing the code, the departmental computing facilities at Department of Physics, Panjab University, Chandigarh and the HPC facilities at IUAC (New Delhi). VKJ acknowledges great support from Alexander von Humboldt for support as a Guest Professor at University of Würzburg.References
- K. S. Novoselov, A. K. Geim, S. V. Morozov and D. Jiang, et al., Electric field in atomically thin carbon films, Science, 2004, 306(5696), 666–669 CrossRef CAS PubMed.
- A. K. Geim and K. S. Novoselov, The rise of graphene, Nat. Mater., 2007, 6(3), 183–191 CrossRef CAS PubMed.
- A. K. Geim, Graphene: status and prospects, Science, 2009, 324(5934), 1530–1534 CrossRef CAS PubMed.
- A. H. Castro Neto, F. Guinea, N. M. R. Peres, K. S. Novoselov and A. K. Geim, The electronic properties of graphene, Rev. Mod. Phys., 2009, 81, 109–162 CrossRef CAS.
- P. Avouris, Z. Chen and V. Perebeinos, Carbon based electronics, Nat. Nanotechnol., 2007, 2(10), 605–615 CrossRef CAS PubMed.
- P. Rani and V. K. Jindal, Designing band gap of graphene by B and N dopants, RSC Adv., 2013, 3(3), 802–812 RSC.
- P. Rani and V. K. Jindal, Stability and electronic properties of isomers of b/n co-doped graphene, Appl. Nanosci., 2014, 4(8), 989–996 CrossRef CAS.
- P. Rani, G. S. Dubey and V. K. Jindal, DFT study of optical properties of pure and doped graphene, Phys. E, 2014, 62, 28–35 CrossRef CAS.
- D. L. Nika, E. P. Pokatilov, A. S. Askerov and A. A. Balandin, Phonon thermal conduction in graphene: Role of Umklapp and edge roughness scattering, Phys. Rev. B, 2009, 79(15), 155413 CrossRef.
- N. Mounet and N. Marzari, First-principles determination of the structural, vibrational and thermodynamic properties of diamond, graphite, and derivatives, Phys. Rev. B: Condens. Matter Mater. Phys., 2005, 71(20), 205214 CrossRef.
- K. V. Zakharchenko, M. I. Katsnelson and A. Fasolino, Finite temperature lattice properties of graphene beyond the quasiharmonic approximation, Phys. Rev. Lett., 2009, 102, 046808 CrossRef CAS PubMed.
- J. W. Jiang, J. S. Wang and B. Li, Young's modulus of graphene: A molecular dynamics study, Phys. Rev. B: Condens. Matter Mater. Phys., 2009, 80, 205429 CrossRef.
- C. Sevik, Assessment on lattice thermal properties of two-dimensional honeycomb structures: Graphene, h-BN, h-MoS2, and h-MoSe2, Phys. Rev. B: Condens. Matter Mater. Phys., 2014, 89, 035422 CrossRef.
- C. W. Kim, S. H. Kang and Y. K. Kwon, Rigid unit modes in sp−sp2 hybridized carbon systems: Origin of negative thermal expansion, Phys. Rev. B: Condens. Matter Mater. Phys., 2015, 92, 245434 CrossRef.
- J. W. Jiang, B. S. Wang, J. S. Wang and H. S. Park, A review on flexural mode of graphene: lattice dynamics, thermal conduction, thermal expansion, elasticity, and nanomechanical resonance, J. Phys.: Condens. Matter, 2015, 27(8), 083001 CrossRef PubMed.
- K. H. Michel, S. Costamagna and F. M. Peeters, Theory of thermal expansion in 2D crystals, Phys. Status Solidi B, 2015, 252(11), 2433–2437 CrossRef CAS.
- K. H. Michel, S. Costamagna and F. M. Peeters, Theory of anharmonic phonons in two-dimensional crystals, Phys. Rev. B: Condens. Matter Mater. Phys., 2015, 91(13), 134302 CrossRef.
- W. Bao, F. Miao and Z. Chen, et al., Controlled ripple texturing of suspended graphene and ultrathin graphite membranes, Nat. Nanotechnol., 2009, 4, 562 CrossRef CAS PubMed.
- D. Yoon, Y. W. Son and H. Cheong, Negative Thermal Expansion Coefficient of Graphene Measured by Raman Spectroscopy, Nano Lett., 2011, 11(8), 3227–3231 CrossRef CAS PubMed.
- W. Pan, J. Xiao, J. Zhu and C. Yu, et al., Biaxial Compressive Strain Engineering in Graphene/Boron Nitride Heterostructures, Sci. Rep., 2012, 2, 893 Search PubMed.
- X. Blase, A. Rubio, S. G. Louie and M. L. Cohen, Quasiparticle band structure of bulk hexagonal boron nitride and related systems, Phys. Rev. B: Condens. Matter Mater. Phys., 1995, 51, 6868 CrossRef CAS.
- K. Watanabe, T. Taniguchi and H. Kanda, Direct-bandgap properties and evidence for ultraviolet lasing of hexagonal boron nitride single crystal, Nat. Mater., 2004, 3, 404–409 CrossRef CAS PubMed.
- D. Golberg, Y. Bando, Y. Huang, T. Terao, M. Mitome, C. Tang and C. Zhi, Boron nitride nanotubes and nanosheets, ACS Nano, 2010, 4(6), 2979–2993 CrossRef CAS PubMed.
- S. Thomas, K. M. Ajith, S. Chandra and M. C. Valsakumar, Temperature dependent structural properties and bending rigidity of pristine and defective hexagonal boron nitride, J. Phys.: Condens. Matter, 2015, 27(31), 315302 CrossRef PubMed.
- Y. Hu, J. Chen and B. Wang, On the intrinsic ripples and negative thermal expansion of graphene, Carbon, 2015, 95, 239–249 CrossRef CAS.
- S. Mann, P. Rani, R. Kumar, G. S. Dubey and V. K. Jindal, Thermodynamic properties of pure and doped (B, N) graphene, RSC Adv., 2016, 6(15), 12158–12168 RSC.
- G. Kresse and J. Furthmüller, Efficient iterative schemes for ab initio total-energy calculations using a plane-wave basis set, Phys. Rev. B: Condens. Matter Mater. Phys., 1996, 54(16), 11169 CrossRef CAS.
- G. Kresse and D. Joubert, From ultrasoft pseudopotentials to the projector augmented-wave method, Phys. Rev. B: Condens. Matter Mater. Phys., 1999, 59(3), 1758 CrossRef CAS.
- A. Togo, F. Oba and I. Tanaka, First-principles calculations of the ferroelastic transition between rutile-type and CaCl2-type SiO2 at high pressures, Phys. Rev. B: Condens. Matter Mater. Phys., 2008, 78(13), 134106 CrossRef.
- V. K. Jindal and J. Kalus, Calculation of thermal expansion and phonon frequency shift in deuterated naphthalene, Phys. Status Solidi B, 1986, 133, 189 CrossRef.
- R. Bhandari and V. K. Jindal, Calculation of thermal expansion and implicit phonon frequency shift in deuterated anthracene, J. Phys.: Condens. Matter, 1991, 3, 899–907 CrossRef CAS.
- J. P. Perdew, K. Burke and M. Ernzerhof, Generalized Gradient Approximation Made Simple, Phys. Rev. Lett., 1996, 77(18), 3865–3868 CrossRef CAS PubMed.
- P. E. Blöchl, Projector augmented-wave method, Phys. Rev. B: Condens. Matter Mater. Phys., 1994, 50(24), 17953 CrossRef.
- S. Reich and C. Thomsen, Elastic properties of carbon nanotubes under hydrostatic pressure, Phys. Rev. B: Condens. Matter Mater. Phys., 2002, 65, 153407 CrossRef.
- G. Kalosakas, N. N. Lathiotakis, C. Galiotis and K. Papagelis, In-plane force fields and elastic properties of graphene, J. Appl. Phys., 2013, 113, 134307 CrossRef.
- K. V. Zakharchenko, M. I. Katsnelson and A. Fasolino, Finite temperature lattice properties of graphene beyond the quasiharmonic approximation, Phys. Rev. Lett., 2009, 102(4), 046808 CrossRef CAS PubMed.
- K. Z. Milowska, M. Woińska and M. Wierzbowska, Contrasting Elastic Properties of Heavily B-and N-doped Graphene with Random Impurity Distributions Including Aggregates, J. Phys. Chem. C, 2013, 117(39), 20229–20235 CAS.
- L. Wirtz and A. Rubio, Ab initio calculations of the lattice dynamics of boron nitride nanotubes, Phys. Rev. B: Condens. Matter Mater. Phys., 2003, 68(4), 045425 CrossRef.
- D. S. Portal and E. Hernandez, Vibrational properties of single-wall nanotubes and monolayers of hexagonal BN, Phys. Rev. B: Condens. Matter Mater. Phys., 2002, 66(23), 235415 CrossRef.
- J. Serrano, A. Bosak, R. Arenal, M. Krisch, K. Watanabe and T. Taniguchi, et al., Vibrational Properties of Hexagonal Boron Nitride: Inelastic X-Ray Scattering and Ab Initio Calculations, Phys. Rev. Lett., 2007, 98, 095503 CrossRef CAS PubMed.
- S. Reich, A. C. Ferrari, R. Arenal, A. Loiseau, I. Bello and J. Robertson, Resonant Raman scattering in cubic and hexagonal boron nitride, Phys. Rev. B: Condens. Matter Mater. Phys., 2005, 71, 205201 CrossRef.
- G. L. Belenkii, E. Y. Salaev, R. A. Suleimanov, N. A. Abdullaev and V. Shteinshraiber, The nature of negative linear expansion in layer crystals C, Bn, GaS, GaSe and InSe, Solid State Commun., 1985, 53(11), 967–971 CrossRef CAS.
- W. Paszkowicz, J. Pelka, M. Knapp, T. Szyszko and S. Podsiadlo, Lattice parameters and anisotropic thermal expansion of hexagonal boron nitride in the 10–297.5 K temperature range, Appl. Phys. A: Mater. Sci. Process., 2002, 75(3), 431–435 CrossRef CAS.
- B. Yates, M. Overy and O. Pirgon, The anisotropic thermal expansion of boron nitride, Philos. Mag., 1975, 32(4), 847–857 CrossRef CAS.
| This journal is © The Royal Society of Chemistry 2017 |

