 Open Access Article
Creative Commons Attribution 3.0 Unported Licence
Evaporation controlled particle patterns in a polymer droplet†
Chongfeng Zhang and
Pinar Akcora *
*
Department of Chemical Engineering & Materials Science, Stevens Institute of Technology, 1 Castle Point on Hudson, Hoboken, NJ 07030, USA. E-mail: pakcora@stevens.edu
First published on 30th March 2017
Abstract
Colloidal microspheres in aqueous polymer drops were previously shown to spatially order into stripes upon drying due to a combination of the phase separation of highly bridged particles and the Marangoni flow effect. In this work, the dynamics of contact line movement of a colloidal–polymer droplet under varying evaporation conditions was monitored in real-time. It was shown that slowing the evaporation rate decreased the contact angle and the resulting stationary contact line enabled a balance between capillary shear and Marangoni flows. Thus, particle deposition into concentric rings was dependent on contact line velocity and receding contact angle. Adding nanoparticles into a polymer–microparticle mixture did not perturb the hydrodynamic flows, subsequently nanoparticles were observed to deposit onto multiple rings and striped patterns. The presented colloidal assembly which is controlled by the bridging of chains between polymer-adsorbing particles was also shown to be effective in the formation of lines parallel to the contact line prepared in a dip-coating process.
Introduction
Droplets containing nonvolatile solutes typically leave a ring-shaped pattern on a solid substrate after drying. This effect, known as a coffee-ring, is due to the pinning of a contact line and occurrence of high evaporation flux near the droplet edge.1 In a freely evaporating droplet, pinning of particles at the edge is accompanied by liquid flowing from the center towards the edges.2–4 As a result of this flow, various microstructure patterns have been obtained in colloidal systems.5–8 Colloidal particles have been observed to deposit either perpendicular9,10 or parallel11,12 to the direction of a moving contact line. The lines perpendicular to the moving contact line are mainly produced by stick-slip motions in previous works as a result of the competition between capillary and pinning forces,13 and stripes parallel to the direction of the contact line are explained commonly by fingering instability in drop casting14–16 and dip-coating17,18 processes. Pinned contact line continuously decreases the contact angle and because of the capillary flow and sufficiently low mobility of colloids, particles accumulate in edge areas.17 Thus, the remaining thin-film starts dewetting and instability between dewetted and pinned areas results in finger-like patterns at short times.19 Previous works have used the evaporative process to control deposition of particles in a restricted geometry.20–23 For example, the capillary flow effect in a confined environment (such as a sphere contacting a flat surface) creates multiple rings,24 radial spikes,25 regular lines26 or patterns of quantum dots.10 Multiple rings can be also obtained as a result of competition between the coffee-ring and the reversing capillary forces.27Our previous results on the unique striped deposition of colloids in a polymer droplet showed that polymer bridging between particles led to the spontaneous demixing of polymer and colloidal phases.28 Polymer chain length and affinity of chains to adsorb on particles determine particle–polymer phase separation and hence deposition of particles into spatially ordered stripes. We observed in optical microscopy videos that particles circulate within the stripes (see Video S1 in ESI†). These ordered aggregates grow in solution with the continuous entry of particles and the contact angle slightly increases during the growth of aggregates, unlike the decrease of contact angle in fingering instability at short times. Moreover, we observed that stripes form at large areas. In this work, we measured the contact line movements of a polymer droplet under varying evaporation conditions to reveal the dynamics of assembling particles into stripes and rings using goniometer and real-time optical microscope. We discuss the effect of surface hydrophilicity on drying of droplets and concentric ring formation by slowing the evaporation rate. This method of ordering spherical particles in two directions has potentials in preparing functional polymeric films with spherical fillers such as flexible paper-based fluidic surface-enhanced Raman scattering devices for chemical detection and solar cells.
Experimental
Materials
Polyvinylpyrrolidone (PVP) of 55 kg mol−1 and 100 nm fluorescent polystyrene (PS) particles was purchased from Sigma-Aldrich and used as received. Aqueous suspensions of colloidal polystyrene (PS) microparticles with diameters of 1 μm were purchased from Polysciences Inc. PVP was dissolved in deionized (DI) water (18.2 MΩ, Direct-Q Millipore) at concentration of 10 mg ml−1 and then mixed with 1 μm PS particles at 0.1 wt% solution concentration by a vortex mixer for 20 min to prepare microparticle/polymer solution. 100 nm fluorescent PS particles were added to the microparticle/polymer solution at 0.01 wt%. Additionally, pure 10 mg ml−1 PVP solution, and 0.1 wt% PS beads in water were prepared for comparison.Preparation of substrates
Mica substrates were used after peeling without prior cleaning. Glass slides and silicon wafers of 25 mm × 15 mm in size were treated with piranha solution, rinsed with DI water and ethanol, and dried with nitrogen. Additional acetone-washed glass slides were also prepared and rinsed with DI water.Measuring contact line movements
1–5 μl drops of microparticle/polymer solution were placed on substrates. Data of contact angle and width of contact area were collected in real time at 10 frames per second in a goniometer (Ramé-hart Model 500-F1) at ambient condition. Similar dynamic contact line measurements were performed at varying evaporation rates. The droplet was evaporated at ambient condition for 50–100 s, and then was covered with a glass lid to slow down the evaporation rate. These steps were repeated several times during evaporation. Evaporation rate was also controlled by pulling-out the glass slide from a one-side open glass cell (purchased from Vitrocom) and particle deposition was observed using a Nikon OPTIPHOT 2POL microscope at different magnifications (5× to 140×). Fluorescent-labeled nanoparticles were observed using a Nikon E1000 upright C1 confocal microscope. Dynamic contact angle and force data in dip-coating experiments were measured by Sigma 700 tensiometer.Results and discussion
We studied the kinetics of contact-line movement of colloidal polymer drops under varying evaporation conditions and observed that when the contact line dynamics is slowed down, micron-size particles deposit into concentric lines. While these rings are thought to be forming due to contact line pinning akin to coffee rings, the dynamics data we collected, in fact, revealed that particle deposition was controlled with the contact line velocity varied by the evaporation rates and with the change of contact angle. To understand the assembly of particles as stripes and rings in PVP solutions above the overlapped polymer concentration,28 it was essential to investigate the growth of aggregates (stripes) in time.Fig. S1† shows top-view optical micrographs of aqueous droplets containing pure PVP, pure PS particles, and PS particles in PVP at different evaporation stages on piranha-treated substrates. A typical coffee ring effect with pinned contact line is seen in microparticle droplets as a result of the accumulation of particles carried by radial capillary flow.3 It is observed that inhomogeneity of a surface influences the pinning of contact line.3 In a polymer droplet, however, pinning is not seen and the contact line recedes smoothly, similar to the evaporation behavior of pure liquids on a smooth and chemically homogenous surface.29 In polymer solution with microparticles, contact lines moved freely during drying and left behind stripes of particles.28
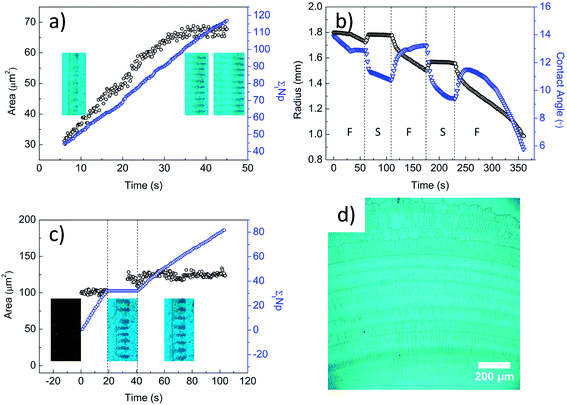
To understand the contact line dynamics of colloidal polymer solutions at varying contact angle and evaporation rate, we monitored the droplets during evaporation using a goniometer and optical microscope. Fig. 1a shows the receding of the contact line as a function of time while stripes are being formed. Circulation of particles within the aggregates, as seen in Video S1 of ESI† and sketched in Fig. 2b, is attributed to the shear fields along the capillary flows coupled with the Marangoni flow. We counted the particles entering one circulating aggregate of stripe (Np). Fig. 1a shows constant number of particles entering in time (Np ∼ 1.9 particle per s) and the linear growth of aggregate area at a constant rate ∼1.4 particle per μm2. Constant particle entry rate and stripe growth result from the stable capillary flows. Change in area becomes steady with the balance between capillary and Marangoni flows. This balance then leads to formation of stripes as contact line recedes. The contact line of the microparticle/polymer droplet first undergoes an initial pinning with decreasing contact angle and then recedes with increasing contact angle at ambient condition (J = 0.0032 ± 0.0003 μL s−1), which is labeled as F in Fig. 1b. With the slowing down of the evaporation (J = 0.0013 ± 0.0001 μL s−1), the motion of contact line suddenly changes from receding to advancing and then reaches to a stationary state. The change in droplet volume and evaporation rate is shown in Fig. S2.† Decrease of the contact angle limits the circulation volume for particles.
 | ||
| Fig. 2 (a) Particle carrying capacity of a droplet is measured on surfaces listed in Table 1 with different contact angle θ. (b) Schematic representation of circulating striped aggregates and ring formation on the edge of a contact line as contact angle decreases. | ||
Fig. 1c shows the change in area of one circulating aggregate and the number of particles entering into circulatory region during evaporation. We see a steady entry of particles in free evaporation in the first 20 s. At slow evaporation between 20 and 40 s, droplet spreads (i.e. contact angle decreases) and the area of aggregates increases, and stripes get wider (see Video S2 in ESI†) even though number of particles in aggregates does not change. With the contact line becoming stationary, particle entry is observed at a slower rate (∼0.8 particle per s), referring to lower capillary flow rates acting on particles. Albeit the continuous entry of particles, the area of aggregates does not change as some particles deposit to form a ring between 40 and 100 s. These observations indicate that stationary contact line is achieved with the balance of capillary and Marangoni flows. Hence, particle carrying capacity of the drop, which depends on contact angle, is easily reached and particles deposit at the contact lines. We observe ring formation under microscope during this controlled evaporation. Fig. 1d shows that the distance between rings is controlled with the duration time of free evaporation. Particles deposit as concentric rings with stationary contact line rather than the stick-slip motion mechanism which is generally known to be the cause of ring formation.8,22
To explain ring formation at low contact angles, we observed the drops on four different substrates (in Table 1) with different receding contact angles and analyzed the aggregation growth in the circulatory region. We measured that the amount of circulating particles increases linearly with contact angle on mica, hydrophilic-glass, -silicon and acetone-cleaned glass (Fig. 2a). Radius and contact angle change during evaporation on different surfaces is presented in Fig. S3.† Fig. 2b depicts that when the evaporation rate is slowed down, microparticle/polymer droplet spreads and its contact angle decreases, subsequently, some particles are left out from the circulating aggregates.
| Receding contact angle, θ (°) | |
|---|---|
| Mica | 6 ± 0.9 |
| Hydrophilic glass | 13 ± 1 |
| Hydrophilic silicon | 21 ± 2 |
| Acetone-washed glass | 38 ± 4 |
Next, the balance between capillary and Marangoni flows is predicted by calculating the contact line dynamics of evaporating droplet at different evaporation rates. Spreading of a droplet is defined by fluid velocity parallel to substrate (UCL), which relates the competing capillary and Marangoni flows. For pure liquid, UCL is determined by capillary flow and expressed by:30
dr/dt = UCL − J(r)/[ρL![[thin space (1/6-em)]](https://www.rsc.org/images/entities/char_2009.gif) sin sin![[thin space (1/6-em)]](https://www.rsc.org/images/entities/char_2009.gif) θ(t)] θ(t)]
| (1) |
![[thin space (1/6-em)]](https://www.rsc.org/images/entities/char_2009.gif) sin
sin![[thin space (1/6-em)]](https://www.rsc.org/images/entities/char_2009.gif) θ(t)] and advances at slow evaporation rate where UCL > J(r)/[ρL
θ(t)] and advances at slow evaporation rate where UCL > J(r)/[ρL![[thin space (1/6-em)]](https://www.rsc.org/images/entities/char_2009.gif) sin
sin![[thin space (1/6-em)]](https://www.rsc.org/images/entities/char_2009.gif) θ(t)]. Assuming that evaporation rate gradient is constant across the droplet, evaporation rate (J) can be obtained from the volume change by J = dV/dt. Volume of the droplet is calculated using the equation31
θ(t)]. Assuming that evaporation rate gradient is constant across the droplet, evaporation rate (J) can be obtained from the volume change by J = dV/dt. Volume of the droplet is calculated using the equation31
 | (2) |
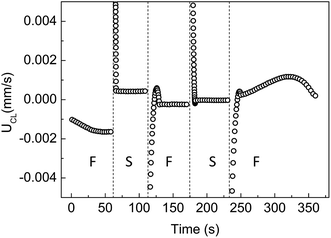
Using the experimental data radius (r) and contact angle (θ) with evaporation time, we have calculated J and determined the value of UCL by fitting the experimental data of dr/dt to eqn (1). Constant UCL represents a stable balance between capillary and Marangoni flows, which is in agreement with well-developed circulation of particles within stripes. The unstable UCL in the first 30 s is due to the gradual establishment of Marangoni flows and particle concentration inhomogeneities near the edge area. The UCL at varying evaporation rates (of Fig. 1b) is shown in Fig. 3. The outward capillary flow, a result of the higher evaporation rate close to the edges, leads to the accumulation of particles and polymers at contact lines. This accumulation decreases the local surface tension, inducing the Marangoni flows that carry solutes from edges to center, and lowers the local concentration of particles and polymer in edge area. Subsequently, UCL decreases in the first 30 s under free evaporation (Fig. 3). UCL gets relatively stable between 30 and 50 s indicating a dynamic balance between the two flows and stable local concentration of particles and polymers. This balance between capillary and Marangoni flows is in-line with discussions of Fig. 1. At a lower evaporation rate, the dynamic balance between capillary and Marangoni flow is interrupted with spreading of the drop and then a new balance is reached which is in agreement with the circulating area change in Fig. 1. Under free evaporation, system re-balances itself.
 | ||
| Fig. 3 The fluid velocity parallel to substrate (UCL) is calculated for the radius and contact angle data (shown in Fig. 1b) for microparticle/polymer droplet under varying evaporating conditions. | ||
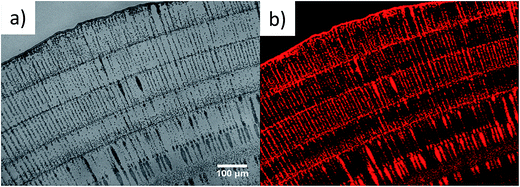
We hypothesize that microparticle arrays may be used to direct nanoparticle depositions. We added 100 nm fluorescent PS nanoparticles (0.1 mg ml−1) to the microparticle/polymer solution and observed that nanoparticles deposit onto arrays of microparticles (Fig. 4a). These patterns are very close to what we observed in Fig. 1d, verifying that addition of nanoparticles does not disturb the deposition of microparticles. The confocal image in (Fig. 4b) also coincides with the optical micrograph of pure microparticles, indicating that nanoparticles deposit along the microparticles due to the lateral depletion forces that push nanoparticles toward circulating aggregates. Another reason of nanoparticles sticking onto micron-arrays is the capillary attractions arising as liquid film thickness gets smaller than the diameter of deposited microparticles. At higher concentration of nanoparticles (0.2 mg ml−1) (Fig. S4†), some nanoparticles deposit between stripes meaning that the lateral depletion force and capillary force may only transfer certain amount of nanoparticles.
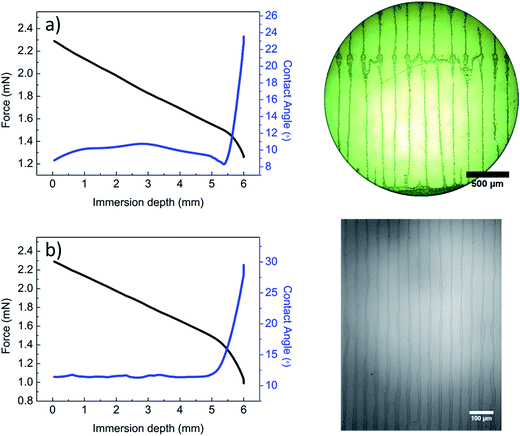
To observe particle depositions in dip-coating, we inserted hydrophilic substrates vertically into microparticle/polymer solution for 2 min during which microparticles start to accumulate near the contact line. The surface was withdrawn at a velocity of 0.2 mm min−1 that is equivalent to the receding velocity of a solution-cast drop. Fig. 5a shows that contact angle decreases and pinning occurs initially. Then contact line starts to recede with slight increment of contact angle. Stripes parallel to substrate withdraw direction are seen over a large area but with higher periodicity than that observed in drop-cast films. When a hydrophilic substrate is dipped vertically into 100 nm PS particle–polymer solution, stripes equally spaced at wavelength of 45 ± 5 μm are obtained (Fig. 5b). We note that contact angle remains steady during receding of the contact line. This behavior and the distance between stripes suggest that fingering instabilities, as previously reported for stripe formations,32 may play a role in the phase separation and aggregation of nanoparticles into micron thick lines (Fig. S5†).
 | ||
| Fig. 5 Tensile force, contact angle and optical micrograph of a withdrawn hydrophilic silicon surface from (a) microparticle/polymer and (b) nanoparticle/polymer solution. | ||
Conclusions
The contact line dynamics of microparticle/polymer droplets is studied to reveal the effect of contact angle on particle carrying capacity and deposition of particles. Dynamic data showed that when the internal shear flows, which arise from the phase separation between particles and polymer chains, were balanced with the Marangoni flows, distinctive stripes and concentric rings are seen. The accumulation rate of particles increased linearly in the early evaporation stage and the size of stripe domains became constant when the competing forces of Marangoni and internal flows were balanced. Slowing the evaporation rate decreased the contact angle and colloidal particles deposit as concentric rings whereas the size of striped aggregates within droplet remains the same. Furthermore, the bimodal mixtures of micron and nanoparticles were shown to order into similar stripe and ring patterns in an aqueous polymer drop. The bridging of chains between polymer-adsorbing particles appeared to be an effective mechanism for the assembly of colloids into lines that are parallel to the substrate withdraw direction in dip-coating.Acknowledgements
We thank Prof. Carlos Colosqui and Mr Dhiraj Nandyala at Stony Brook University for their help in using the tensiometer. Acknowledgment is made to the Donors of the American Chemical Society Petroleum Research Fund (Award# 54633-ND7) for support of this research.References
- R. D. Deegan, O. Bakajin, T. F. Dupont, G. Huber, S. R. Nagel and T. A. Witten, Nature, 1997, 389, 827–829 CrossRef CAS.
- W. Han and Z. Lin, Angew. Chem., Int. Ed., 2012, 51, 1534–1546 CrossRef CAS PubMed.
- R. D. Deegan, O. Bakajin, T. F. Dupont, G. Huber, S. R. Nagel and T. A. Witten, Phys. Rev. E, 2000, 62, 756 CrossRef CAS.
- H. Hu and R. G. Larson, J. Phys. Chem. B, 2006, 110, 7090–7094 CrossRef CAS PubMed.
- R. Sharma, C. Y. Lee, J. H. Choi, K. Chen and M. S. Strano, Nano Lett., 2007, 7, 2693–2700 CrossRef CAS PubMed.
- J. Chen, W.-S. Liao, X. Chen, T. Yang, S. E. Wark, D. H. Son, J. D. Batteas and P. S. Cremer, ACS Nano, 2008, 3, 173–180 CrossRef PubMed.
- J. B. Miller, A. C. Usselman, R. J. Anthony, U. R. Kortshagen, A. J. Wagner, A. R. Denton and E. K. Hobbie, Soft Matter, 2014, 10, 1665–1675 RSC.
- R. G. Larson, AIChE J., 2014, 60, 1538–1571 CrossRef CAS.
- M. Byun, S. W. Hong, L. Zhu and Z. Lin, Langmuir, 2008, 24, 3525–3531 CrossRef CAS PubMed.
- L. Shmuylovich, A. Q. Shen and H. A. Stone, Langmuir, 2002, 18, 3441–3445 CrossRef CAS.
- M. Abkarian, J. Nunes and H. A. Stone, J. Am. Chem. Soc., 2004, 126, 5978–5979 CrossRef CAS PubMed.
- G. Pu and S. J. Severtson, Langmuir, 2008, 24, 4685–4692 CrossRef CAS PubMed.
- J. Xu, J. Xia, S. W. Hong, Z. Lin, F. Qiu and Y. Yang, Phys. Rev. Lett., 2006, 96, 066104 CrossRef PubMed.
- S. Maheshwari, L. Zhang, Y. Zhu and H.-C. Chang, Phys. Rev. Lett., 2008, 100, 044503 CrossRef PubMed.
- J. Xu, J. Xia and Z. Lin, Angew. Chem., 2007, 119, 1892–1895 CrossRef.
- R. De Dier, W. Sempels, J. Hofkens and J. Vermant, Langmuir, 2014, 30, 13338–13344 CrossRef CAS PubMed.
- J. Huang, F. Kim, A. R. Tao, S. Connor and P. Yang, Nat. Mater., 2005, 4, 896–900 CrossRef CAS PubMed.
- H. Uchiyama, W. Namba and H. Kozuka, Langmuir, 2010, 26, 11479–11484 CrossRef CAS PubMed.
- A. Crivoi and F. Duan, Colloids Surf., A, 2013, 432, 119–126 CrossRef CAS.
- M. Byun, N. B. Bowden and Z. Lin, Nano Lett., 2010, 10, 3111–3117 CrossRef CAS PubMed.
- W. Han, M. Byun and Z. Lin, J. Mater. Chem., 2011, 21, 16968–16972 RSC.
- Y. Men, W. Wang, P. Xiao, J. Gu, A. Sun, Y. Huang, J. Zhang and T. Chen, RSC Adv., 2015, 5, 31519–31524 RSC.
- S. Zhang, W. Luan, Q. Zhong, S. Yin and F. Yang, Soft Matter, 2016, 12, 8285–8296 RSC.
- S. W. Hong, M. Byun and Z. Lin, Angew. Chem., Int. Ed., 2009, 48, 512–516 CrossRef CAS PubMed.
- B. Li, W. Han, M. Byun, L. Zhu, Q. Zou and Z. Lin, ACS Nano, 2013, 7, 4326–4333 CrossRef CAS PubMed.
- M. Byun, W. Han, F. Qiu, N. B. Bowden and Z. Lin, Small, 2010, 6, 2250–2255 CrossRef CAS PubMed.
- B. M. Weon and J. H. Je, Phys. Rev. E, 2010, 82, 015305 CrossRef PubMed.
- E. Senses, M. Black, T. Cunningham, S. A. Sukhishvili and P. Akcora, Langmuir, 2013, 29, 2588–2594 CrossRef CAS PubMed.
- C. Poulard, O. Benichou and A. Cazabat, Langmuir, 2003, 19, 8828–8834 CrossRef CAS.
- D. Anderson and S. Davis, Phys. Fluids, 1995, 7, 248–265 CrossRef CAS.
- V. H. Chhasatia, A. S. Joshi and Y. Sun, Appl. Phys. Lett., 2010, 97, 231909 CrossRef.
- A. R. Tao, J. Huang and P. Yang, Acc. Chem. Res., 2008, 41, 1662–1673 CrossRef CAS PubMed.
Footnote |
| † Electronic supplementary information (ESI) available. See DOI: 10.1039/c7ra01687e |
| This journal is © The Royal Society of Chemistry 2017 |


