 Open Access Article
Fabrication of injectable hydrogels based on poly(L-glutamic acid) and chitosan
Shifeng Yan*,
Taotao Wang,
Xing Li,
Yuhang Jian,
Kunxi Zhang,
Guifei Li and
Jingbo Yin *
*
Department of Polymer Materials, Shanghai University, 333 Nanchen Road, Shanghai 200444, People's Republic of China. E-mail: yansf@staff.shu.edu.cn; jbyin@oa.shu.edu.cn
First published on 17th March 2017
Abstract
Injectable hydrogels as an important biomaterial class have been widely used in regenerative medicine. A series of injectable poly(L-glutamic acid)/chitosan (PLGA/CS) hydrogels were fabricated by self-crosslinking aldehyde-modified PLGA (PLGA–CHO) and lactic acid-modified chitosan (CS–LA). The oxidation degree of PLGA–CHO and degree of substitution (DS) of CS–LA could be adjusted by the amount of sodium periodate and lactic acid, respectively. The effect of the solid content of the hydrogels, oxidation degree of PLGA–CHO and CS–LA/PLGA–CHO mass ratio on the gelation time, gel content, water uptake, mechanical properties, microscopic morphology, and in vitro degradation of the hydrogels was examined. The pH and ion sensitivity of PLGA/CS hydrogels was also examined. Encapsulation of rabbit chondrocytes within the hydrogels showed viability of the entrapped cells and cytocompatibility of the injectable hydrogels. The injectable PLGA/CS hydrogels demonstrated attractive properties for future application in pharmaceutical delivery and tissue engineering.
1. Introduction
Hydrogels are cross-linked, hydrophilic, polymeric networks capable of imbibing large amount of water or biological fluids, and have been widely used as carrier materials for controlled drug delivery and as scaffolds in tissue engineering.1 As an artificial designed extracellular matrix (ECM), injectable hydrogels are highly desirable because of the advantages for various biomedical applications, such as the ease of administration, simple cell or drug encapsulation, minimally invasive procedures, the filling of irregular surgical defects during hydrogel formation and possibly enhanced patient compliance.2A wide variety of natural and synthetic injectable hydrogel systems have been developed using physical or chemical crosslinking. Physical crosslinking hydrogels are spontaneously formed by weak secondary forces, such as ionic interactions,3 host–guest interactions,4 crystallization,5 stereocomplexation,6 and hydrophobic interactions7 between water soluble polymer chains. Some physical crosslinking hydrogel systems exhibit attractive external stimuli-responsibility, of which the formation can be triggered by temperature, pH or ion changes.8 Physical crosslinking hydrogel can be formed easily without reactive chemical reagents, but the hydrogels show the disadvantage of poor stability and mechanical properties in the body, and diffusion of hydrogel precursors to the surrounding tissue.9 In contrast, injectable hydrogels prepared by chemical crosslinking demonstrate higher stability and better mechanical properties. However, a major handicap of these chemical crosslinkers is the potential cytotoxicity when the biomaterial is exposed to biological environments.10
Recently, intermacromolecular in situ chemical cross-linking systems using Schiff base reactions have attracted wide attention due to their various advantages, such as biocompatibility and easily controlled reaction rate under mild conditions. Injectable hydrogels can be prepared by self-crosslinking of the component polymers bearing amine groups and aldehyde groups, without additional chemical crosslinking reagents. Several natural polysaccharides, including alginate,11 dextran,12 hyaluronic acid,13 and chondroitin sulphate14 were partially oxidized and used for the preparation of hydrogels via Schiff base reaction. However, natural polysaccharides display batch-to-batch variation, and offer limited control over chemical structure, molecular weight, and degradation profiles. The oxidation degree of polysaccharides is uncontrollable, partial oxidation often leads to the side reaction of backbone depolymerization and substantial deterioration of mechanical strength.15 Moreover, the natural polysaccharides based hydrogels could only mimic the component of polysaccharides in the ECM, since ECM is composed of an interlocking mesh of fibrous proteins and glycosaminoglycans.16
Synthetic polypeptides, which can mimick the protein component of native ECM, have received great interest because they possess a more regular arrangement and a smaller diversity of amino acid residues than those derived from natural proteins. Poly(L-glutamic acid) (PLGA), a synthetic polypeptide, is unique in that it is composed of naturally occurring L-glutamic acid linked together through amide bonds. It is non-toxic, hydrophilic, biodegradable and exhibits no antigenicity or immunogenicity.17 Thus, a hybrid polymeric injectable hydrogel combining natural polysaccharide and synthetic poly(L-glutamic acid) is expected to make up for the deficiencies of nature polysaccharides.
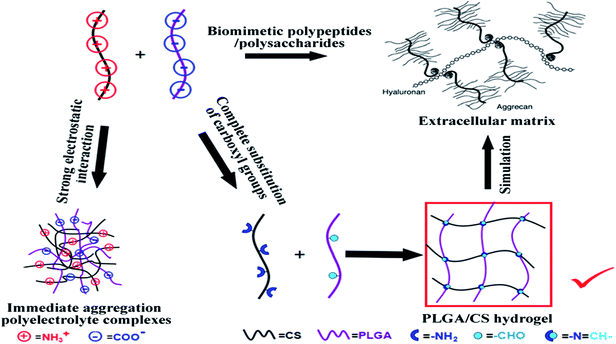
In our previous work, we have reported the preparation of poly(L-glutamic acid)/chitosan (PLGA/CS) polyelectrolyte complex porous scaffolds for cartilage tissue engineering.18 However, the PLGA/CS scaffolds were noninjectable. Bearing opposite charges, the direct combination of PLGA and CS solutions often results in immediate formation of polyelectrolyte complexes precipitating from the solution because of strong electrostatic interaction between component polymers. Moreover, CS shows poor solubility in physiological solvents due to its strong intermolecular hydrogen bonding between the macromolecular chains, thereby greatly limiting its further use in injectable hydrogel system.19 The development of PLGA/CS injectable hydrogels remains a challenge.
Herein, we describe a strategy for fabricating injectable, self-crosslinking hydrogels composed of PLGA and CS derivatives and open an avenue for the design of oppositely charged polypeptide–polysaccharide hybrid hydrogels. The aldehyde-modified PLGA (PLGA–CHO) and lactic acid modified chitosan (CS–LA) were prepared using EDC activation and NaIO4 oxidation. The in situ cross-linking mechanism of PLGA/CS hydrogel was shown in Fig. 1. Advantages of the method include: (1) complete substitution of the carboxyl groups with diol groups avoiding the strong electrostatic interaction between oppositely charged component polymers, (2) precise control of oxidation degree and the amount of aldehyde groups in the subsequent oxidation process, (3) expected environment-dependent behavior of hydrogels considering the component polymers were both weak polyelectrolytes and the hydrogels were crosslinked via reversible schiff base reaction.
2. Experimental
2.1. Materials
PLGA was synthesized by ring-opening polymerization of the N-carboxyanhydride of γ-benzyl-L-glutamate, followed by removal of γ-benzyl protection groups of poly(γ-benzyl-L-glutamate) (PBLG).20,21 CS (Mv = 4.0 × 10⁴) with a deacetylation degree of 95% was purchased from Jinan Haidebei Marine Bioengineering Corp. (Shandong, China). 1-Ethyl-3-(3-dimethylaminopropyl) carbodiimide hydrochloride (EDC·HCl) and 1-hydroxy-benzotriazole (HOBT) were purchased from Jier biochemical company. N-hydroxysuccinimide (NHS) was purchased from Aladdin Industry Corporation (Shanghai, China). Sodium periodate (NaIO4), hydroxylamine hydrochloride, ethylene glycol and 3-amino-1,2-propanediol were purchased from Shanghai Darui Fine Chemical Co., Ltd. (Shanghai, China). Other reagents were of analytical grade and used as received. Dialysis membranes (7000 Da cut off) were purchased from Shanghai Canspec Scientific Instruments Co., Ltd.2.2. Synthesis of aldehyde-functionalized poly(L-glutamic acid) (PLGA–CHO)
PLGA (0.3 g) was dispersed in 60 ml of aqueous alkaline solution (pH = 9) under magnetic stirring until a clear solution was obtained. Then, 3-amino-1,2-propanediol (AP, 0.423 g, 4.65 mmol) was added, followed by HOBT (0.31 g, 2.32 mmol). The pH of the reaction mixture was adjusted to 6 by the addition of 1 M HCl solution. Finally, a solution of EDC·HCl (0.89 g, 4.65 mmol) was added to the mixture and stirred overnight. The solution was transferred to a dialysis tube and dialysed exhaustively against de-ionized water for 2 days, and the solution obtained was lyophilized to gain white fluffy product of diol-modified PLGA (PLGA–AP).Different amounts of NaIO4 aqueous solution was added to the aqueous solution of PLGA–AP (0.5% (w/v), 100 ml) and stirred at ambient temperature for 5 min in the dark to obtain PLGA–CHO with different oxidation degree. An excess dose of diethylene glycol was added to quench any unreacted periodate. The mixture was then dialyzed exhaustively against de-ionized water for 3 days and pure PLGA–CHO was obtained by lyophilization.
2.3. Synthesis of chitosan–lactic acid (CS–LA) conjugate
CS conjugate was prepared in one step by reacting with lactic acid (LA). The molar ratios of LA to the –NH2 groups of chitosan were varied to obtain a series of CS–LA conjugates with different derivatization degree.Typically, 0.3 g CS was dissolved in 100 ml of LA aqueous solution (LA: 1 g, 11.05 mmol). Afterwards, NHS (0.424 g, 3.68 mmol) was added into the solution. The pH of the reaction mixture was adjusted to 5 with a 3 M NaOH aqueous solution followed by addition of a water solution of EDC·HCl (1.412 g, 7.36 mmol). The mixture was stirred for 48 h at room temperature followed by being neutralized using a 3 M NaOH solution. The resultant mixture was dialyzed first against 1% NaCl aqueous solution followed by de-ionized water. Finally, the CS–LA was lyophilized.
The solubility of unmodified and modified CS at a fixed concentration (20 mg ml−1) and different pH values was measured. Briefly, CS and CS–LA were separately dispersed in the phosphate buffer with different pH values and stirred to get a clear solution. The maximum pH for solubilization was taken as an indicator to evaluate the solubility of chitosan and its derivatives.
2.4. Formation of PLGA/CS hydrogels
PLGA–CHO and CS–LA were dissolved in PBS separately at different concentration ranging from 1.5 to 3 wt%. The PLGA–CHO and CS–LA solutions with same concentrations were then gently mixed with a magnetic stirrer at 200 rpm to form the hydrogels with corresponding solid contents. Other factors that might affect the properties of hydrogels, including oxidation degree of PLGA–CHO and CS–LA/PLGA–CHO mass ratio were also considered during the preparation of the PLGA/CS hydrogels with the solid content of 2 wt%. The gelation time was determined as the point at which the mixture solution (100 μl PLGA–CHO/100 μl CS–LA) formed a globule.222.5. Characterization of polymers and hydrogels
Some amount of PLGA–CHO was dissolved in 10 ml of 0.25 mol l−1 hydroxylamine hydrochloride solution (pH adjusted to 4.5). The mixture was stirred at room temperature for 24 h. The conversion of aldehydes into oximes was followed by titration of the released hydrochloric acid with 0.1 mol l−1 NaOH solution until the pH = 5 end point was achieved. The change of pH with the volume of added NaOH solution was recorded. The related reactions and calculation formula are as follows:
PLGA–(CHO)n + nHO–NH2–HCl → PLGA–(CH![[double bond, length as m-dash]](https://www.rsc.org/images/entities/char_e001.gif) N–OH)n + nHCl + nH2O N–OH)n + nHCl + nH2O
| (1) |
| HCl + NaOH = NaCl + H2O | (2) |
| ΔV × nNaOH = n |
| W = n × MPLGA–CHO + m × MPLGA–AP |
| Oxidation degree (100%) = n/(n + m) = n/[(W − n × MPLGA–CHO)/MPLGA–OH + n] |
Dried hydrogels were immersed in buffered solution (pH 7.4) to reach equilibrium swelling. The swelling hydrogels were weighted (Ws) after removing the buffered solution superficially with filter paper. The water uptake was denoted as (Ws − Wg)/Wg × 100%.
2.6. Chondrocyte culture and viability analysis
Animals were maintained in accordance with the Guidelines of the Shanghai Jiao Tong University, Shanghai, China. And all animal experiment procedures were approved by the Animal Care and Experiment Committee of Shanghai Jiao Tong University School of Medicine. Primary chondrocytes were isolated enzymatically from ear cartilage of New Zealand rabbits (2.5–3 kg). The tissue was cut into small pieces and digested by 0.2% collagenase (Serva, Heidelberg, Germany) at 40 °C for 8 h and cultured in high glucose Dulbecco's modified Eagle's medium (DMEM) containing 10 vol% fetal bovine serum (FBS), and 1 wt% of penicillin–streptomycin. Cells at passage less than 2 were collected for cell seeding.Chondrocytes were encapsulated in the injectable hydrogels under sterile condition. Briefly, PLGA–CHO and CS–LA solution with the concentration of 2 wt% in phosphate buffered saline (PBS) were sterilized by filtration through filters with a pore size of 0.22 μm. Chondrocytes were first resuspended in 10 ml of CS–LA solution at final cell density of 1 × 10⁶ cells per ml, and then 10 ml of PLGA–CHO solution in PBS was added. The mixture solution was immediately injected into 24-well plate before the formation of hydrogels, and then incubated at 37 °C to form a composite cell/hydrogel matrix.
The effect of hydrogels on cell survival was studied using a live–dead assay. At 1, 3 and 5D of culture, the hydrogel constructs were rinsed with PBS and stained with fluorescein diacetate/propidium iodide (FDA/PI) using the live–dead assay kit (Invitrogen), according to the manufacturers' instructions. Hydrogel/cell constructs were observed using fluorescence microscopy (Leica). As a result live cells fluoresce green and the nuclei of dead cells fluoresce red.
The morphology of the chondrocytes in the hydrogels was observed using a Phenom G2 pro desktop SEM equipped with a cold stage (temperature controlled sample holder, TCSH). After in vitro culture for 1 and 3D, the hydrogel/cell constructs were fixed with glutaraldehyde for 5 h, the samples were then placed on the sample holder and cooled from room temperature to −20 °C at the rate of −20 °C min−1 for cryo-microscopy.
3. Results and discussion
3.1. Synthesis and characterization of PLGA and CS derivatives
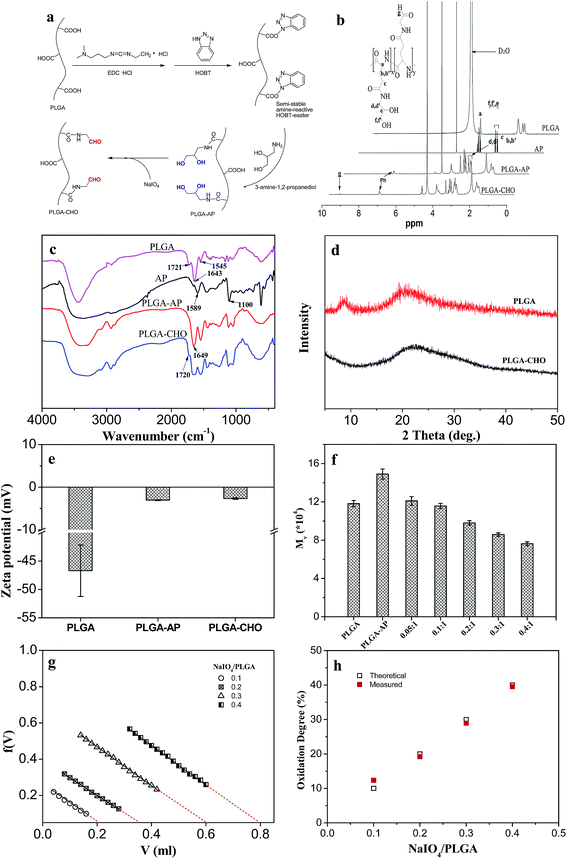
Fig. 2b shows the 1H NMR spectra of PLGA before and after aldehyde-modification. For PLGA, the peak at 4.2 ppm was assigned to the protons binding to the α-carbon of L-glutamic acid (1H, α-CH). For AP, the multiple peaks located at 2.50 and 2.60 ppm were attributed to the methylene protons (–C![[H with combining low line]](https://www.rsc.org/images/entities/char_0048_0332.gif) 2–NH2) adjacent to the amino group. The resonance peaks appeared at 3.43, 3.50 and 3.58 ppm were ascribed to other methylene (–C
2–NH2) adjacent to the amino group. The resonance peaks appeared at 3.43, 3.50 and 3.58 ppm were ascribed to other methylene (–C![[H with combining low line]](https://www.rsc.org/images/entities/char_0048_0332.gif) 2–OH) adjacent to the hydroxyl group and methine (–C
2–OH) adjacent to the hydroxyl group and methine (–C![[H with combining low line]](https://www.rsc.org/images/entities/char_0048_0332.gif) –) protons. The 1H NMR spectrum of PLGA–AP exhibited the characteristic peaks for both PLGA and AP. However, the two multiple peaks for methylene protons shifted from 2.50/2.60 ppm to 3.13/3.23 ppm, indicating the diol-modification of PLGA. Diol-modification degree could be calculated from the relative peak area. The value was about 99%, suggesting almost complete substitution of the carboxyl groups. After oxidation, the 1H NMR spectrum of PLGA–CHO was similar to that of PLGA–AP. The only difference was that a small peak appeared at 4.98 ppm, which is ascribed to the protons of the hydrate forms of aldehyde arised from the oxidation cleavage of the vicinal diol groups in PLGA–AP.26
–) protons. The 1H NMR spectrum of PLGA–AP exhibited the characteristic peaks for both PLGA and AP. However, the two multiple peaks for methylene protons shifted from 2.50/2.60 ppm to 3.13/3.23 ppm, indicating the diol-modification of PLGA. Diol-modification degree could be calculated from the relative peak area. The value was about 99%, suggesting almost complete substitution of the carboxyl groups. After oxidation, the 1H NMR spectrum of PLGA–CHO was similar to that of PLGA–AP. The only difference was that a small peak appeared at 4.98 ppm, which is ascribed to the protons of the hydrate forms of aldehyde arised from the oxidation cleavage of the vicinal diol groups in PLGA–AP.26
Fig. 2c shows the FTIR of PLGA before and after functionalization. PLGA showed the characteristic absorption peaks at 1721, 1643 and 1545 cm−1, corresponding to the stretching vibration of the C![[double bond, length as m-dash]](https://www.rsc.org/images/entities/char_e001.gif) O stretch band from COOH groups, amide I and II vibration bands, respectively.27,28 After modification with AP, a new absorption band at 1649 cm−1 was detected in the spectrum of PLGA–AP. While after oxidation of PLGA–AP, an inconspicuous absorption band was detected at 1720 cm−1 in the spectrum of PLGA–CHO, corresponding to the aldehyde symmetric vibration,19,29 which suggested 1,2-diol structure was partly converted to the aldehyde groups in the final PLGA–CHO.
O stretch band from COOH groups, amide I and II vibration bands, respectively.27,28 After modification with AP, a new absorption band at 1649 cm−1 was detected in the spectrum of PLGA–AP. While after oxidation of PLGA–AP, an inconspicuous absorption band was detected at 1720 cm−1 in the spectrum of PLGA–CHO, corresponding to the aldehyde symmetric vibration,19,29 which suggested 1,2-diol structure was partly converted to the aldehyde groups in the final PLGA–CHO.
Fig. 2d shows the X-ray diffraction patterns of PLGA before and after modification. PLGA exhibited weak peaks at around 9 and 19°, due to its low crystallizability. After modification, only a broad peak centered at 22° was observed, corresponding to the amorphous nature of PLGA–CHO. This indicated that the aldehyde-modification destructed the original crystalline structure of PLGA.
Since the charge state of carboxylic groups is quite different from that of diol and aldehyde groups, the analysis of zeta potentials was further conducted to confirm the modification of PLGA. Fig. 2e presents the zeta potentials for PLGA, PLGA–AP and PLGA–CHO dissolved in de-ionized water. The zeta potential for PLGA solution was −46.7 mV. It was observed that the zeta potential shifted to −3.06 mV after modification with AP, and then shifted to −2.67 mV after further aldehyde-functionalization. This confirmed the substantial diol-functionalization of carboxylic groups for PLGA followed by NaIO4 oxidation to aldehyde groups.
The viscosity average molecular weights (Mv) of PLGA during modification are also shown in Fig. 2f. Compared with pure PLGA, the diol-modified PLGA (PLGA–AP) showed an increase in molecular weight, indicating successful grafting of AP onto PLGA. The molecular weight decreased with increasing amount of NaIO4, which could be ascribed to the oxidation of vicinal diol groups and partial fracture of the molecular chain.
The oxidation degree of PLGA–CHO is defined as the percentage of oxidized PLGA repeating units, which can be quantified using hydroxylamine hydrochloride potentiometric titration method, which was widely used to determine the oxidation degree of some oxidized polysaccharides.30 As shown in Fig. 2g, F(V) is plotted against V. F(V) = (V0 + V)([H+]–[OH−])/CB, where V0 is the volume of PLGA–CHO solution before the titration commenced, V the volume of strong base added, and CB the concentration of titrant solution.31 A straight line obtained should intersect X-axis at ΔV, which was the equivalent consumed volume of sodium hydroxide solution. Then oxidation degree can be calculated from ΔV with the formula above-mentioned. Fig. 2h displays the theoretical degree of oxidation, i.e. the molar ratio of sodium periodate per initial diol groups in PLGA–AP, and the measured oxidation degree calculated by hydroxylamine hydrochloride potentiometric titration. As expected, the oxidation degree of PLGA–CHO increased as the amount of added periodate increased. Moreover, the oxidation degree obtained experimentally for PLGA–CHO was very close to the theoretical values, with the deviation not more than 2.5%. Therefore, oxidation degree could be easily adjusted by sodium periodate amount.
It has been reported that the rate of periodate oxidation of the glycol residues of some polysaccharides was slow (more than 2 h) for several reasons including highly hydrogen bonded structure, the trans-geometry of the diols, and the unfavorable electrostatic interaction of the periodate with carboxyl groups.15 Moreover, the oxidation degree was uncontrollable. However, with amino-glycerol-functionalized PLGA, controllable quick oxidation reaction of the glycerol unit could be observed within 5 min, followed by the quenching of the oxidizing agent using ethylene glycol.
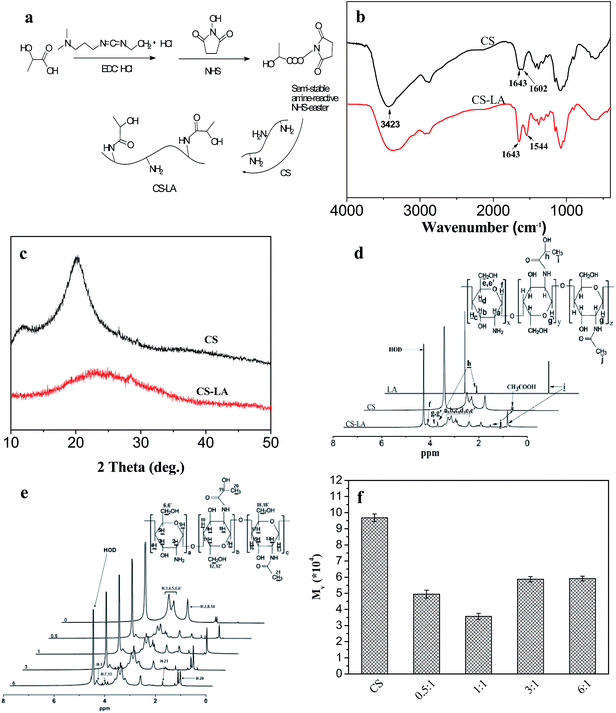
Fig. 3b shows the FTIR spectra of CS before and after modification. A characteristic peak at 1602 cm−1 in CS spectrum could be ascribed as –NH2 bending vibration.32 In the spectrum of CS–LA, it was noted that the band at 1602 cm−1 decreased while two new prominent bands at 1544 (–NH–bending vibration) and 1643 cm−1 (Amide I) appeared, indicating the substitution of the CS.
Fig. 3c illustrates the XRD patterns of CS before and after modification. The CS showed two characteristic peaks centered at 10.3 and 20.1°, as the previous reported by Samuels,33 indicating relatively high degree of crystallinity. The diffraction peak at 2θ = 10.3° was assigned to crystal forms I and that at 2θ = 20.1° was corresponding to crystal forms II. The XRD pattern of CS–LA was significantly different from that of chitosan, in which only one broad peak at about 23° could be observed. The amorphous structure of CS–LA was ascribed to grafting of LA to CS, which could hinder the intra macromolecular and inter chain hydrogen bonds to form and greatly destruct the crystallinity in CS.
Fig. 3d presents the 1H NMR spectra of CS before and after modification with LA. The peak between 2.8 and 4.0 ppm was assigned to the protons of Ha, Hb, Hc, Hd, He and He in CS repeating units. While the resonance peak appeared at 1.85 ppm was attributed to the protons of residual acetyl groups. Degree of deacetylation (DD) with the value of 98.1% could be calculated by using the signal from protons Ha, Hb, Hc, Hd, He and He (Ha–e) of both monomers and the peak of acetyl group (HAc) proposed previously.34,35 For LA, the peaks at 1.24 and 4.20 ppm are assigned to the methyl and methine protons, respectively. The 1H NMR spectrum of CS–LA exhibited the characteristic peaks for both PLGA and AP, indicating successful grafting of LA to CS.
The degree of substitution (DS) of LA, defined as the number of LA moieties per 100 glucopyranose rings of chitosan, was determined from the 1H NMR spectra (Fig. 3e) by comparing the integrals of signals at 4.3 (A4.3) and 4.66 ppm (A4.66). DS, which was expressed as [A4.3/(A4.66 + A4.3) − 0.02] × 100%, increased from 8.2 to 27.8% when the LA/NH2 molar ratio was raised from 0.5 to 6 (Table 1).
| Samples | LA/CS molar ratio | DS of CS–LA or DD of CS (%) | PNH2 (%) | Maximum pH value to obtain homogeneous solution |
|---|---|---|---|---|
| CS–LA | 0.5 | 8.2 | 89.8 | 7.4 |
| 1 | 11.3 | 86.7 | 7.7 | |
| 3 | 19.1 | 78.9 | 8.0 | |
| 6 | 27.8 | 70.2 | 7.7 | |
| CS | 0 | 98.1 | 98.1 | — |
The pH dependent solubility of LA was evaluated by dispersing chitosan and its derivatives in the prepared phosphate buffer with different pH values at a concentration of 20 mg ml−1, and the maximum pH to obtain homogeneous solution was defined as the index to evaluate the solubility of the samples. As the result of the formation of intra macromolecular and inter chain hydrogen bonds between the glucosidic bond and hydroxyl or amino groups, native chitosan with a DD of 98.1% was not soluble in phosphate buffer at pH 7.4. As shown in Table 1, all of the modified chitosan samples with the DS ranging from 8.2 to 27.8% were readily soluble at physiological pH. The maximum pHs to obtain homogeneous solution for the samples with the DS of 11.3 and 27.8% were both 7.7. While the derivative with DS of 19.1% showed the best solubility, which was soluble up to pH 8. Therefore, the derivative with DS of 19.1% was chosen for the further research.
The variation viscosity average molecular weights (Mv) of CS before and after modification were also studied, as shown in Fig. 3f. After modification with lactic acid, the molecular weight of CS was obviously decreased. This might be due to the hydrolysis of glycosidic bonds in chitosan backbone under acidic condition. And the degree of decrease in molecular weight caused by hydrolysis was higher than that of increase in molecular weight resulted from introduction of lactic acid molecules. When the amount of lactic acid further increased, the effect of LA introduction seemed to be dominated. The molecular weight of modified CS began to increase at the LA/CS molar ratio of 3![[thin space (1/6-em)]](https://www.rsc.org/images/entities/char_2009.gif) :
:![[thin space (1/6-em)]](https://www.rsc.org/images/entities/char_2009.gif) 1.
1.
3.2. Hydrogel formation and gelation time
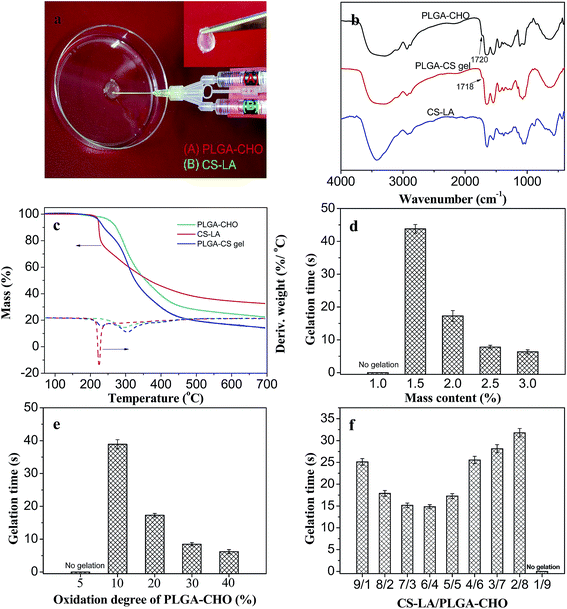
Recently, the injectable hydrogels prepared by intermacromolecular in situ chemical crosslinking, employing the Michael addition reaction between thiol and vinyl groups, the click reaction between bis(yne) molecules and multiarm azides, and the Schiff base reaction have been researched in regenerative medicine.2 In particular, the Schiff base reaction has been proven to be an efficient method to prepare biocompatible injectable hydrogels for tissue engineering because of various advantages, such as easy control of reaction rates under physiological condition, avoiding using toxic photoinitiator or organic solvent for hydrogel formation. The PLGA/CS hydrogel was obtained by the self-crosslinking process based on Schiff base reaction between aldehyde groups in PLGA–CHO and amine groups in CS–LA formation with the formation of hydrazone bonds.Fig. 4a shows an image of the in situ formation of the hydrogels using dual syringes. Syringes tube (A) and (B) were filled with a PBS solution of PLGA–CHO and LA–CS, respectively. During process of the injection of PLGA–CHO and LA–CS solutions at the same speed, the mixing of two kinds of solutions inside the needle resulted in rapid crosslinking in between the two component polymers and occurrence of the sol–gel phase transition.
In the following study, CS–LA with LA substitution of 19.1% and PLGA–CHO with theoretical oxidation degree of 20% were selected as a pair of the component polymers for the hydrogels with the aim to ensure relatively high crosslinking density and strength for the hydrogel. For comparison, PLGA–CHO with other oxidation degrees was also used.
The formation of the crosslinking structure of the hydrogels could be studied by FTIR and TGA. Fig. 4b presents the FTIR spectra of PLGA–CHO, CS–LA and PLGA/CS hydrogels. A peak at 1720 cm−1 (aldehyde symmetric vibration) was detected in the spectrum of PLGA–CHO. It was unconspicuous and was due to the hemiacetal formation of free aldehyde groups.36 In the spectrum of CS–LA, the characteristic peaks appeared at 1544 (Amide II) and 1643 cm−1 (Amide I). For the PLGA/CS hydrogel, the characteristic band of aldehyde group at 1720 cm−1 weakened, while a new peak appeared at 886 cm−1, corresponding the C![[double bond, length as m-dash]](https://www.rsc.org/images/entities/char_e001.gif) N groups. These suggested that the coupling reaction occurred between –CHO of PLGA–CHO and –NH2 of CS–LA.
N groups. These suggested that the coupling reaction occurred between –CHO of PLGA–CHO and –NH2 of CS–LA.
Fig. 4c shows the thermal decomposition behaviors of the PLGA/CS hydrogel and components polymers. For CS–LA, the temperature at the maximum decomposition rate was 222.5 °C. While the thermal decomposition rate of PLGA–CHO reached the maximum value at 296.8 °C. The thermal weight loss curve of PLGA/CS hydrogel could be divided into two stages with two peaks at 229.4 and 302.6 °C in the differential TGA curve, corresponding to the thermal decomposition of CS–LA component and PLGA–CHO components, respectively. The increased temperatures at the maximum decomposition rate indicated the chemical crosslinking between PLGA–CHO and CS–LA, and the formation of a stable network structure.
The gelation time of injectable hydrogel is an important parameter to characterize the injectable properties and fulfill the clinical requirements. Excessively rapid relation will cause the difficulty of injection of the precursor solution, discontinuity and destruction of the hydrogels or even needle clogging. While the prolonged gelation often leads to the unwanted diffusion of gel precursors or bioactive molecules to surrounding areas, and failure in forming the hydrogel with desired shape.37
Fig. 4d shows the effect of solid content on the gelation time of the hydrogels. Stable hydrogels could not be obtained when the concentration of precursor polymers was less than 1.5 wt%. When the concentration increased from 1.5 to 3.0%, the gelation time decreased drastically from 44 to 7 s. The number of reactive groups and crosslinking density increased with the concentration of precursor polymer, resulting in decrease of time required for the phase transition.
The gelation time was also influenced by the oxidation degree of PLGA–CHO, as shown in Fig. 4e. When PLGA–CHO had an oxidation degree of no more than 5%, its mixing with CS–LA did not lead to the formation of the hydrogel. The gelation of the hydrogels became faster at higher oxidation degree of PLGA–CHO, which was due to more introduced aldehyde groups and increased crosslinking density of the hydrogel systems.38
Fig. 4f shows the relationship between the component mass ratio and the gelation time. With the decrease of the CS–LA content in the precursor solution, the gelation time first decreased from 24 s to the minimum value of 14 s and then gradually increased to 32 s. When the mass ratio of CS–LA to PLGA–CHO was 6/4, the gelation was the fastest. The significantly excessive groups of neither –NH2 or –CHO groups resulted in a large number of un-reacted residual groups and slow gelation rate.
3.3. Gel content and water uptake of PLGA/CS hydrogel
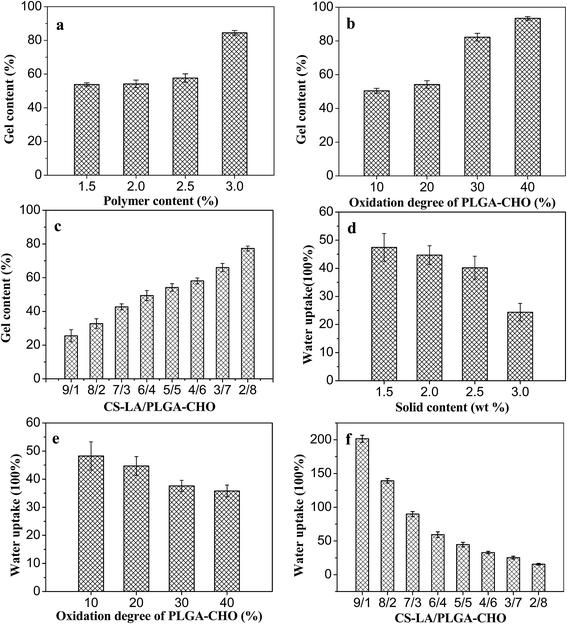
Fig. 5 shows the variation of gel content with polymer concentration, oxidation degree of PLGA–CHO and component mass ratio. As shown in Fig. 5a, the gel content increased from 55 to 84%, as the polymer concentrations increased from 1.5 to 3 wt%. This indicated that the network formation was more efficient and the hydrogels was more stable at higher polymer concentrations.24 Fig. 5b showed that the gel content also increased with oxidation degree of PLGA–CHO, which was ascribed to that more polymer chains were involved in the formation of gel network.In Fig. 5c, the gel content of the hydrogel increased firstly, and then decreased with the decreasing proportion of CS–LA component in the precursor. It reached the highest value of 79% at CS–LA/PLGA–CHO mass ratio of 2/8. With the decrease of CS–LA amount, the number of the two kinds of reactive groups became gradually close to each other, leading to the increase of cross-linking density. In addition, the viscosity of precursor solution decreased with less CS–LA content, which might promote the mixing uniformity of the components and increase of crosslinking density of the three-dimensional network.
The water uptakes of the PLGA/CS hydrogels in PBS buffer were shown in Fig. 5d–f. All the hydrogels showed high swelling ratios, which ranged from 25 to 200 under different conditions. As shown in Fig. 5d, the water uptake of the hydrogel decreased from 47 to 24 with the increase of the polymer concentration from 1.5 to 3%, and the change trend was opposite to that of the gel content. At higher concentration, the number of reactive groups per unit volume and the macromolecular chain entanglement increased, leading to the increase of crosslinking density and the decrease of swelling ratio.
Water uptake is also influenced by the oxidation degree of PLGA–CHO, as shown in Fig. 5e. When the oxidation degree of the precursor was 10%, the swelling ratio of the hydrogels was as high as 62. However, the hydrogel was unstable and disintegrated after 12 h due to its low crosslinking density. As the PLGA–CHO oxidation degree increased, the swelling ratio decreased gradually, which could be ascribed to the increasing amount of aldehyde groups and crosslinking density of the network.
Fig. 5f displays the swelling degree of PLGA/CS hydrogels with different CS–LA/PLGA–CHO mass ratios. In contrast to the trend of gel content, with the decrease of CS–LA content, the swelling ratio of the hydrogel first decreased and then increased, and reached the minimum value of 26, revealing more crosslinking at CS–LA/PLGA–CHO mass ratio of 2/8.
3.4. Rheological properties of PLGA/CS hydrogels
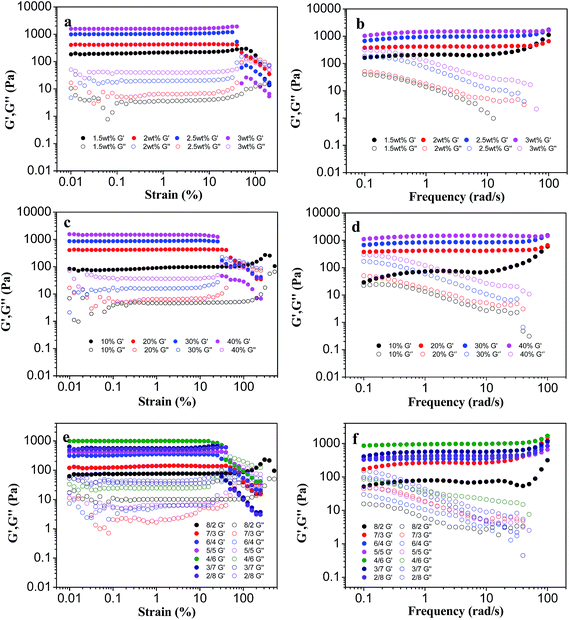
The visco-elastic properties of PLGA/CS hydrogel after gelation were determined at 37 °C, and the changes in storage modulus (G′)/loss modulus (G′′) against oscillation strain or frequency were plotted.39 The linear viscoelastic region (LVER) of each hydrogel was first determined by oscillatory strain sweep in order to ensure that the oscillatory frequency sweep of all hydrogels was examined in this region.Fig. 6a, c and e show oscillation strain sweep curves for the hydrogels with different solid content. For all the hydrogels, G′ was always higher than G′′, owing to flexibility of the cross-linked network. In addition, when the solid content was increased, the yield strain decreased. The yield strain is a critical value for toughness of the material. The material is able to return its original shape if the stain occurred is smaller than the yield strain (elastic deformation). The LVER of each hydrogel was under strain of 20–30%, and the selected strain 0.5% was used as the test parameter of the oscillating frequency sweep.
G′ displayed a plateau at first and then a slight increase in the range of 1–100 rad s−1, confirming that the hydrogels were cross-linked and mechanically robust (Fig. 6b, d and f). G′ increased rapidly with solid content or oxidation degree of PLGA–CHO, as shown in Fig. 6b and d. Hydrogels prepared at a concentration of 3 wt% showed G′ value of about 1000 Pa, which was about 5–6 fold of that of 1.5 wt% hydrogels, whereas G′ increased 10–12 times when the oxidation degree of PLGA–CHO increased from 10% to 20%. The higher G′ value at higher solid content or higher oxidation degree of PLGA–CHO could be ascribed to a large number of reactive groups facilitating the increase of crosslinking degree of the hydrogels and mechanical enhancement.
The G′/G′′ of the hydrogels as a function of CS–LA/PLGA–CHO mass ratio is shown in Fig. 6f. Although the highest gel content and minimum swelling occurred at CS–LA/PLGA–CHO mass ratio of 2/8, the hydrogels exhibited a higher value of G′ at CS–LA/PLGA–CHO mass ratio of 4/6. It has been reported that gel rheological properties also strongly depended on the physicochemical properties of the components.40 As CS showed higher rigidity and mechanical performance because of the chemical structure of a 6-membered ring in the its main chain, a certain degree of excess amount of CS–LA was beneficial to improve the mechanical strength of the PLGA/CS hydrogels. Similar result of the mechanical enhancement by appropriate excess of CS was also found in PLGA/CS porous scaffolds in our previous study.18
3.5. Micromorphology and biodegradability of PLGA/CS hydrogels
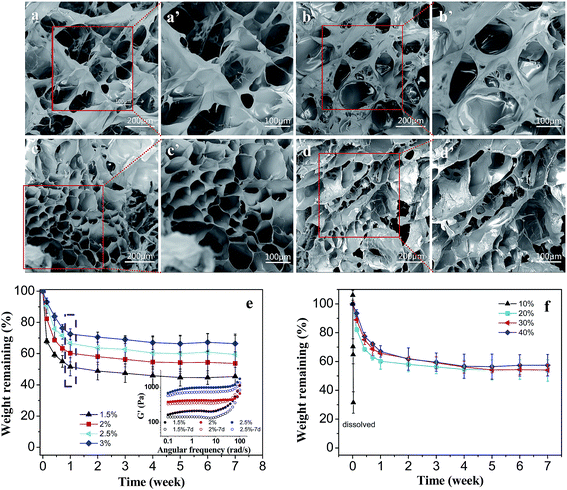
The microstructure of the hydrogel, such as the pore size and pore connectivity, is very important for the application of tissue engineering. The internal porous structure can provide the encapsulated cells with sufficient internal space for growth, as well as good penetration of nutrition and metabolite transport.41In Fig. 7a–d, PLGA/CS hydrogels after freeze drying showed continuous porous structure. With the increase of the solid content, the pore wall thickness and pore size of the hydrogels were gradually reduced. The pore size of the hydrogel decreased rapidly from 25–160 to 10–90 μm, when the solid content increased from 1.5 to 3 wt%. Obviously, the micromorphology and pore size were greatly influenced by the precursor polymer concentration. A higher precursor polymer concentration led to a higher crosslink density and the formation of smaller pore size in the hydrogels. At the solid content of 3%, the uniformity in pore size decreased, probably due to uneven mixture of the two component polymer solution with different viscosity and regionalized differences in crosslink density.
An appropriate degradation rate is necessary for injectable hydrogels in their application as cell delivery system in tissue engineering. Degradability of the hydrogels with different solid contents and PLGA–CHO oxidation degrees was investigated by examining the weight loss in PBS solution, as shown in Fig. 7e and f.
As shown in Fig. 7e, all the hydrogels with different solid contents degraded relatively rapidly within first week, which was presumably due to gel erosion and removal of the noncrosslinked macromolecular chains. After 1 week of immersion, all of the hydrogels maintained the structural integrity, but the storage modulus decreased obviously, as shown in the inset of Fig. 7e. Then, the degradation rate decreased gradually, which was caused by the breakage of the hydrazone bonds in between the macromolecular chains. PLGA/CS hydrogels with solid contents of 1.5, 2, 2.5 and 3 wt% experienced weight loss of 54.6, 46.3, 41.5 and 33.6 wt% after 7 weeks of incubation. With the increase of solid content, the crosslinking density of the gel network increased, reducing water penetration in the hydrogel and delaying the disintegration of crosslinking network.
The degradation performance was also influence by oxidation degrees of PLGA–CHO, as shown in Fig. 7f. The hydrogel containing PLGA–CHO with 10% oxidation degrees disintegrated within one day, corresponding to low crosslinking degree. After 7 weeks, the weight loss reached 46.63, 45.93 and 42.52 wt% for the samples with the PLGA–CHO oxidation degree of 20, 30 and 40%. Although increasing oxidation degree resulted in more aldehyde groups for cross-linking and higher crosslinking density of the network,32 the effect of decreasing in the molecular weight was not negligible, leading to almost equal amount of degradation.
3.6. Environment responsibility of PLGA/CS hydrogels
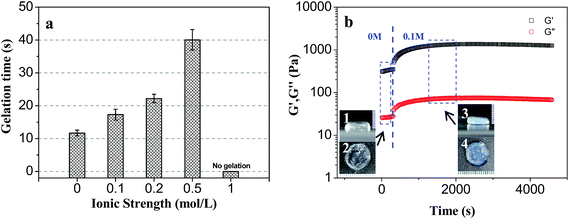
The elastic modulus changes of hydrogel at different ionic strength condition were shown in Fig. 8b. When the environmental ionic strength was suddenly changed from 0 to 0.1 mol l−1, the G′ of the hydrogel obviously changed, increased gradually from the initial 400 Pa to the equilibrium value of 1300 Pa after 1700 s. Salt addition could screen repulsion between the –NH3+ ions hanging on CS molecules and induce lateral shrinkage of the molecular chain and crosslinking network, resulting in the increase of elastic modulus of the hydrogel.
After immersion in 0.1 mol l−1 solution, the volume of the hydrogel was reduced, and the color was changed, which indicated that the shrinkage of the crosslinking network of the hydrogel was accompanied with a certain degree of microphase separation.
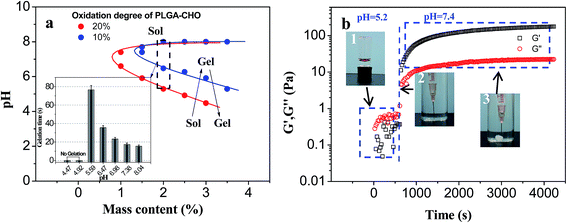
PLGA–CHO with high oxidation degree could provide more reactive aldehyde groups, facilitating the hydrogel formation. Therefore, PLGA–CHO (oxidation degree = 19.20%) system reached the critical phase transition under the condition of lower pH value. Increasing solid content also helped to enhance the cross-linking density and promote the formation of the crosslinking network, so the lower critical phase transition pH gradually decreased with increasing solid content.
The appearance of upper critical phase transition pH in the phase diagram was due to the limited solubility of CS–LA at high pH value, which was similar to the glycol chitosan system.25 CS–LA (DS: 19.12%) chains with high complete deprotonization tended to curl up and precipitate from aqueous phase at a pH above 8. Therefore, mixing the CS–LA component with the PLGA–CHO did not result in a stable gel structure under high-pH condition (pH > 8). In addition, the sol–gel phase transition of PLGA/CS system was not reversible after hydrogel formation because it is difficult to separate the molecular chain entanglement during the formation of the hydrogel based on Schiff base reaction, even when the pH value returned to the previous value of solution.
The effect of pH on the PLGA/CS hydrogel system was also reflected in the rate of hydrogel forming. In the gel forming region, there was a big difference in the gelation time at different pH values. As shown in the inset of Fig. 9a, the gel forming phenomenon was not observed when pH value was less than 5, which was attributed to insufficient Schiff base linkage for stable crosslinked network formation at lower pH value.25 The cross-linking points per unit volume increased with increasing pH value, and the sol–gel transition appeared at pH 5.5. Increased pH value resulted in accelerated gel formation and gradually decreased gelation time.
In order to track the pH-sensitive phase transition process of PLGA/CS injectable hydrogel system, PLGA–CHO/CS–LA precursor mixture with PH 5.2 was injected into the solution of pH 7.4, and a dynamic time sweep rheological experiment was conducted, as shown in Fig. 9b. Within tens of seconds after environmental pH change, G′ gradually exceeded G′′, indicating the transition from liquid state to gel state. The storage modulus of the hydrogel was further increased and reached the steady value of 180 Pa after 4000 s. So, this PLGA/CS system had good injectability in weak acidic environment, while formed a stable hydrogel at a physiological pH of 7.4, indicating the application prospect in the field of drug delivery.44,45
3.7. Distribution and ECM deposition of chondrocytes within PLGA/CS hydrogels
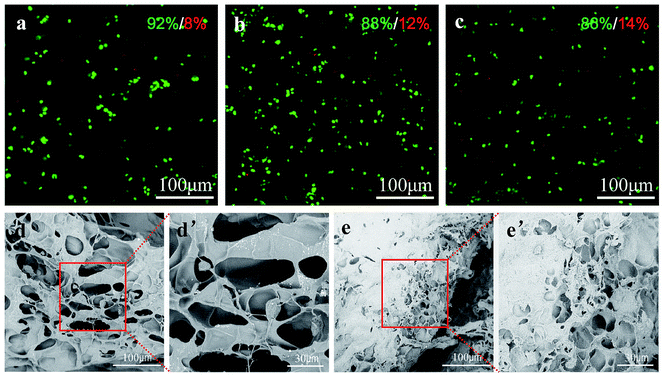
To evaluate whether the PLGA/CS hydrogel was a nice cell carrier, a 3-dimentional cultivation of chondrocytes was performed and the cell–hydrogel complex was subject to fluorescence microscopy and SEM observation. As shown in Fig. 10a–c, fluorescent microscopy images illustrated that chondrocytes could tolerate 3-dimentional encapsulation and the injection of the PLGA/CS hydrogels. Roundly shaped chondrocytes were uniformly distributed in the hydrogels. The majority of these cells were shown to survive after incubating in the hydrogel for 1, 3 and 5 days. Although the ratio of the dead cells increased slightly with the culture time, the percentage of viable cells was still over 85% after 5 days. The morphology of chondrocytes in the hydrogels was further observed by SEM equipped with a cold stage. As shown in Fig. 10d and e, after 1 and 3 days of culture, the chondrocytes were distributed within the hydrogels, and retained a nearly round shape. After 3 days, some amount of extracellular matrix deposition was observed on the surface of the cell–hydrogel complex, confirming that the hydrogel was cytocompatible and provided a suitable environment for the cells to grow.4. Conclusions
The in situ forming poly(L-glutamic acid)/chitosan (PLGA/CS) hydrogels were prepared via Schiff base crosslinking reaction. The aldehyde-modified PLGA (PLGA–CHO) and lactic acid modified chitosan (CS–LA) were prepared using EDC activation and NaIO4 oxidation. The combination of PLGA–CHO and CS–LA solutions led to an intermacromolecular crosslinking reaction and rapid formation of hydrogels at the physiological condition. The gelation time, gel content, water uptake, degradation rate, microscopic morphology, and rheological properties could be easily controlled by oxidation degree of PLGA–CHO and component mass ratio. The PLGA/CS hydrogel displayed an obvious sensitivity to the variation of pH and ion. The PLGA/CS hydrogels was cytocompatible and successfully used for encapsulation of chondrocytes. Taken together, these results indicated that the PLGA/CS injectable hydrogel might have potential uses in tissue engineering and drug delivery applications.Acknowledgements
The study was supported by the National Natural Science Foundation of China (No. 51473090 and 51373094), the Natural Science Foundation of Shanghai City (No. 14ZR1414600), and the Science and Technology Commission of Shanghai Municipality (No. 15JC1490400). Mr Yuliang Chu from Instrumental Analysis Research Centre (Shanghai University) is acknowledged for his help in SEM measurement.References
- K. M. Park, Y. M. Shin, Y. K. Joung, H. Shin and K. D. Park, Biomacromolecules, 2010, 11, 706–712 CrossRef CAS PubMed.
- J. A. Yang, J. Yeom, B. W. Hwang, A. S. Hoffman and S. K. Hahn, Prog. Polym. Sci., 2014, 39, 1973–1986 CrossRef CAS.
- C. K. Kuo and P. X. Ma, Biomaterials, 2001, 22, 511–521 CrossRef CAS PubMed.
- M. E. Davis and M. E. Brewster, Nat. Rev. Drug Discovery, 2004, 3, 1023–1035 CrossRef CAS PubMed.
- T. Abitbol, T. Johnstone, T. M. Quinn and D. G. Gray, Soft Matter, 2011, 7, 2373–2379 RSC.
- G. W. Bos, W. E. Hennink, L. A. Brouwer, W. den Otter, T. F. J. Veldhuis, C. F. van Nostrum and M. J. A. van Luyn, Biomaterials, 2005, 26, 3901–3909 CrossRef CAS PubMed.
- N. M. B. Smeets, M. Patenaude, D. Kinio, F. M. Yavitt, E. Bakaic, F. C. Yang, M. Rheinstädter and T. Hoare, Polym. Chem., 2014, 5, 6811–6823 RSC.
- L. Yu and J. Ding, Chem. Soc. Rev., 2008, 37, 1473–1481 RSC.
- M. Kurisawa, F. Lee, L. S. Wang and J. E. Chung, J. Mater. Chem., 2010, 20, 5371–5375 RSC.
- M. Rafat, F. Li, P. Fagerholm, N. S. Lagali, M. A. Watsky, R. Munger, T. Matsuura and M. Griffith, Biomaterials, 2008, 29, 3960–3972 CrossRef CAS PubMed.
- J. Shi, G. Wang, H. Chen, W. Zhong, X. Qiu and M. M. Q. Xing, Polym. Chem., 2014, 5, 6180–6189 RSC.
- X. Zhao, P. Li, B. Guo and P. X. Ma, Acta Biomater., 2015, 26, 236–248 CrossRef CAS PubMed.
- L. Li, N. Wang, X. Jin, R. Deng, S. Nie, L. Sun, Q. Wu, Y. Wei and C. Gong, Biomaterials, 2014, 35, 3903–3917 CrossRef CAS PubMed.
- M. Fan, Y. Ma, H. Tan, Y. Jia, S. Zou, S. Guo, M. Zhao, H. Huang, Z. Ling, Y. Chen and X. Hu, Mater. Sci. Eng., C, 2017, 71, 67–74 CrossRef CAS PubMed.
- E. Martínez-Sanz, D. A. Ossipov, J. Hilborn, S. Larsson, K. B. Jonsson and O. P. Varghese, J. Controlled Release, 2011, 152, 232–240 CrossRef PubMed.
- S. Hinderer, S. L. Layland and K. Schenke-Layland, Adv. Drug Delivery Rev., 2016, 97, 260–269 CrossRef CAS PubMed.
- C. Li, Poly(L-glutamic acid)–anticancer drug conjugates, Adv. Drug Delivery Rev., 2002, 54, 695–713 CrossRef CAS PubMed.
- S. Yan, K. Zhang, Z. Liu, X. Zhang, L. Gan, B. Cao, X. Chen, L. Cui and J. Yin, J. Mater. Chem. B, 2013, 1, 1541–1551 RSC.
- H. Tan, C. R. Chu, K. A. Payne and K. G. Marra, Biomaterials, 2009, 30, 2499–2506 CrossRef CAS PubMed.
- P. Dubruel, L. Dekie and E. Schacht, Biomacromolecules, 2003, 4, 1168–7116 CrossRef CAS PubMed.
- Z. Song, J. Yin, K. Luo, Y. Zheng, Y. Yang, Q. Li, S. Yan and X. Chen, Macromol. Biosci., 2009, 9, 268–278 CrossRef CAS PubMed.
- T. Ito, Y. Yeo, C. B. Highley, E. Bellas and D. S. Kohane, Biomaterials, 2007, 28, 975–983 CrossRef CAS PubMed.
- F. Ingman and E. Still, Talanta, 1966, 13, 1431–1442 CrossRef CAS PubMed.
- R. Jin, L. S. Moreira Teixeira, P. J. Dijkstra, M. Karperien, C. A. van Blitterswijk, Z. Y. Zhong and J. Feijen, Biomaterials, 2009, 30, 2544–2551 CrossRef CAS PubMed.
- C. Ding, L. Zhao, F. Liu, J. Cheng, J. Gu, S. Dan, C. Liu, X. Qu and Z. Yang, Biomacromolecules, 2010, 11, 1043–1051 CrossRef CAS PubMed.
- D. Ossipov, S. Kootala, Z. Yi, X. Yang and J. Hilborn, Macromolecules, 2013, 46, 4105–4113 CrossRef CAS.
- J. Zheng, X. Tian, Y. Sun, D. Lu and W. Yang, Int. J. Pharm., 2013, 450, 296–303 CrossRef CAS PubMed.
- S. Yang, L. Li, A. L. Cholli, J. Kumar and S. K. Tripathy, Biomacromolecules, 2003, 4, 366–371 CrossRef CAS PubMed.
- Y. Jia, Y. Hu, Y. Zhu, L. Che, Q. Shen, J. Zhang and X. Li, Carbohydr. Polym., 2011, 83, 1153–1161 CrossRef CAS.
- D. A. Wang, S. Varghese, B. Sharma, I. Strehin, S. Fermanian, J. Gorham, H. D. Fairbrother, B. Cascio and J. H. Elisseeff, Nat. Mater., 2007, 6, 385–392 CrossRef CAS PubMed.
- X. Jiang, L. Chen and W. Zhong, Carbohydr. Polym., 2003, 54, 457–463 CrossRef CAS.
- S. Lu, M. Liu and B. Ni, Chem. Eng. J., 2010, 160, 779–787 CrossRef.
- R. J. Samuels, J. Polym. Sci., Polym. Phys. Ed., 1981, 19, 1081 CrossRef CAS.
- A. Hirai, H. Odani and A. Nakajima, Polym. Bull., 1991, 26, 87–94 CrossRef CAS.
- M. Lavertu, Z. Xia, A. N. Serreqi, M. Berrada, A. Rodrigues, D. Wang, M. D. Buschmann and A. Gupta, J. Pharm. Biomed. Anal., 2003, 32, 1149–1158 CrossRef CAS PubMed.
- H. A. Kang, G. J. Jeon, M. Y. Lee and J. W. Yang, J. Chem. Technol. Biotechnol., 2002, 77, 205–210 CrossRef CAS.
- R. Jin, C. Hiemstra, Z. Y. Zhong and J. Feijen, Biomaterials, 2007, 28, 2791–2800 CrossRef CAS PubMed.
- B. Balakrishnan and A. Jayakrishnan, Biomaterials, 2005, 26, 3941–3951 CrossRef CAS PubMed.
- H. H. Winter, P. Morganelli and F. Chambon, Macromolecules, 1988, 21, 532–535 CrossRef CAS.
- A. Izuka, H. H. Winter and T. Hashimoto, Macromolecules, 1992, 25, 2422–2428 CrossRef CAS.
- B. Balakrishnan and R. Banerjee, Chem. Rev., 2011, 111, 4453–4474 CrossRef CAS PubMed.
- Y. J. Wang, A. S. Angelatos, D. E. Dunstan and F. Caruso, Macromolecules, 2007, 40, 7594–7600 CrossRef CAS.
- J. Donoso, F. Munioz, A. Garcia Del Vado, G. Echevarria and F. GarciaBlancot, Biochem. J., 1986, 238, 137–144 CrossRef CAS PubMed.
- N. K. Singh and D. S. Lee, J. Controlled Release, 2014, 193, 214–227 CrossRef CAS PubMed.
- J. Shi, G. Wang, H. Chen, W. Zhong, X. Qiu and M. M. Q. Xing, Polym. Chem., 2014, 5, 6180–6189 RSC.
| This journal is © The Royal Society of Chemistry 2017 |

