 Open Access Article
High performance anion exchange ionomer for anion exchange membrane fuel cells
Xueqiang Gaoab,
Hongmei Yu *a,
Jia Jiaab,
Jinkai Haoab,
Feng Xieab,
Jun Chiab,
Bowen Qinab,
Li Fuab,
Wei Songa and
Zhigang Shao
 a
a
aFuel Cell System and Engineering Laboratory, Dalian Institute of Chemical Physics, Chinese Academy of Sciences, 457 Zhongshan Road, Dalian 116023, China. E-mail: hmyu@dicp.ac.cn; Fax: +86-411-84379185; Tel: +86-411-84379051
bUniversity of Chinese Academy of Sciences, Beijing 100039, China
First published on 30th March 2017
Abstract
The anion exchange ionomer incorporated into the electrodes of an anion exchange membrane fuel cell (AEMFC) enhances anion transport in the catalyst layer of the electrode, and thus improves performance and durability of the AEMFC. In this work, a novel ionomer based on a triblock copolymer with high conductivity and good durability is synthesized successfully. The spectroscopy (such as 1H-NMR, FT-IR) results of the ionomer indicate that the functional group is grafted onto the poly(styrene-ethylene/butylene-styrene) (SEBS) successfully and the OH− conductivity of the ionomer is 30 mS cm−1 at 75 °C. Besides, quaternary ammonium SEBS (QASEBS) is used as the ionomer in a H2/O2 AEMFC and exhibits a significant durability of 500 h at a constant current density of 100 mA cm−2, moreover, the degradation rate of voltage is only 0.22 mV h−1 during the 500 h durability test. In addition, the peak power density of the membrane electrode assembly (MEA) with the QASEBS ionomer reaches 375 mW cm−2 at 50 °C, which is 3 times than that of the MEA using the commercially available Acta I2 ionomer (124 mW cm−2) for comparison.
1. Introduction
Recently, to deal with the energy crisis and environment issues, fuel cell technology has drawn more academic and industrial interest. Among all fuel cell technology, proton exchange membrane fuel cells (PEMFCs) have been recognized as promising energy source systems because of their high power density, high energy conversion efficiency, and low pollutant emission.1–3 Even though PEMFCs still have a strong dependence on platinum group metal catalysts, thus increasing the cost and hindering the large scale commercialization of fuel cells. A promising solution to the problem is to develop anion exchange membrane fuel cells (AEMFCs), which adjust the conditions of electrochemical reaction.4,5 On one hand, nonprecious metal or compounds can be used as stable and efficient catalysts under high pH for electrode reactions.6,7 On the other hand, the electrolyte leakage issue that occurs in the traditional alkaline fuel cells has been mitigated due to the use of a solid alkaline electrolyte membrane.8,9AEMFCs have been a new focus in the field of fuel cell research over the past decades. The tremendous efforts have been put into the development of alkaline anion exchange membrane (AAEM)1,10–12 and the catalyst materials,13–15 and the research on the AAEM have acquired some encouraging results that the conductivity of the AAEM has been more than 100 mS cm−1,16 which is comparable to the commercial Nafion® membrane used in PEMFC. However, the performance of the AEMFC has not yet satisfied the industrial and commercial application, one of the most significant problems for AEMFC is a lack of a soluble ionomer in the catalyst layer to build an efficient three-phase boundary and thus dramatically increase the utilization of the catalyst particles and decrease the internal resistance.
The ionomer severs as the physical binder and ion conductor transporting the OH− ion in the catalyst layer, playing an key role in the development of the fuel cell performance.17 Thus, to the ionomer, the high ion conductivity and alkaline stability are needed. Besides, high solubility in low boiling point water soluble solvents is also one of the most desirable properties for an ionomer applying in the catalyst layer, because these solvents are easy and safe to handle and remove during the electrode preparation. Recently, some ionomers from the industrial and academia have been reported,18–32 however neither the formulation of the ionomers nor their functioning mechanisms were disclosed. The polysulfone (PSf) pendent quaternary ammonium ionomer in recent reports can only dissolve in high boiling point solvent, such as dimethylformamide (DMF) and dimethylacetamide (DMAc),1,5,33 which is considered difficult to remove the solvents in the presence of finely dispersed catalysts. Yan et al. prepared a quaternary phosphonium functionalized PSf ionomer soluble in low boiling point solvents, which exhibited exceptional high hydroxide conductivity and good alkaline stability. And a peak power density of 138 mW cm−2 in a H2/O2 AEMFC was achieved at 50 °C, which was 3.5 times higher for the MEA without ionomers.34 Sun and co-workers chose a novel block copolymer SEBS as the backbone which was a thermoplastic elastomer with good chemical, thermal and mechanical stability and synthesized quaternary ammonium based ionomers with different ion exchange capacity. A peak power output of 210 mW cm−2 in a H2/O2 AEMFC was reached at 50 °C with 2 atm back pressure, which was much higher than that (<50 mW cm−2) of an MEA with PSf-based ionomers.23 Although these ionomers exhibited an acceptable ion conductivity and solubility, the performance of the MEA with these ionomers was not comparable to state-of-the art PEMFCs.24,35,36 Besides, the literatures about the AEMFC performance, especially durability of the AEMFC, are few in the public publications.
Although the SEBS was chosen to prepare the anion exchange membrane and anion exchange ionomer, the performance of AEMFC was still very low due to the bad solubility of the ionomer which lead to bad MEA fabrication. In this work, chloromethyl groups were grated onto the SEBS, and the non-ionic CMSEBS had good solubility in tetrahydrofuran. The home-made AEH9620 (ref. 37) and CMSEBS were chosen as the AAEM and ionomer binder to prepare the electrode, and then the electrode was immersed in trimethylamine solution for amination and soaked in KOH solution for alkalization. Using the post-ammoniated optimized fabrication approach of the MEA, a higher peak power output and longer lifetime are realized in the H2/O2 AEMFC.
2. Experimental
2.1. Preparation of the QASEBS ionomer
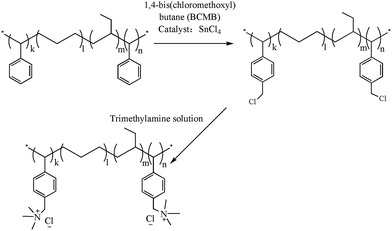
The Tuftec H1031 SEBS with 30 wt% of styrene structural units as the raw material was purchased by AsahiKASE. 1,4-Bis(chloromethoxyl)butane (BCMB) was provided by Xi'an Lanjing LLC. Chloroform, tetrahydrofuran, methanol, ethanol, tin(IV) chloride, phenolphthalein, trimethylamine solution (33 wt%), hydrochloric acid, sodium hydroxide and potassium hydroxide were from Tianjing Damao Chemical Works.Firstly, the SEBS was purified before functionalization using the method mentioned in Sun's report.23 For chloromethylation, 2 g SEBS was dissolved in 60 mL chloroform in a three-neck flask equipped with a mechanical and a condenser agitation in an oil bath at 55 °C, then 4.1 mL tin(IV) chloride and 27.6 mL BCMB were added in the reaction system in turn. The solution was stirred for 12 h at 55 °C. The chloromethylated SEBS (CMSEBS) was purified by precipitation from 5 wt% tetrahydrofuran solution to methanol. Then, the CMSEBS was dissolved in tetrahydrofuran to prepare a 5 wt% polymer solution to use. The synthetic process of the quaternary ammoniated SEBS for the ionomer was shown in Scheme 1.
2.2. NMR characterization
The SEBS, CMSEBS and QASEBS were analysed on a Bruker 400 MHz instrument. Due to the QASEBS poor solubility, an indirect method is employed. The experimental details are as follows. Firstly, the chloromethylated polymer CMSEBS was dissolved in the chloroform-d, then the trimethylamine water solution (33 wt%) was added in the CMSEBS solution. After 2 hours, the mixture and the trimethylamine solution (n-propanol as the solvent) was analysed by a Bruker 400 MHz instrument, respectively. The chloroform-d was used as the solvent and the tetramethylsilane (TMS) was used as the internal reference.2.3. FTIR characterization
TR-FTIR of the SEBS, CMSEBS and QASEBS membranes was obtained on a Bruker Tensor 27 spectrometer with an ATR accessory containing a Ge crystal, and the wavenumber resolution was 4 cm−1 and the range was 4000–400 cm−1.2.4. Ion exchange capacity, water uptake and swelling behaviour
The ionomers solution can't be directly measured some properties, so the ion exchange capacity (IEC), swelling ratio and water uptake of the ionomer were characterized in the form of membrane. During the test, the sample were all in hydroxide form. In order to convert the ionomer to hydroxide form, we immersed the ionomer in the 1 M KOH solution for 24 hours, and replaced the solution with the fresh 1 M KOH every 8 hours. Then, the ionomer was washed by DI water (the conductivity is 0.19 μS cm−1 and the water is saturated by the nitrogen before using) until the pH of the filtrate water was seven. At last, the ionomer was put into the DI water and stored for later use. On the other hand, to weaken the effect of the CO2 during the test of the ionomer in hydroxide form, DI water was saturated by the nitrogen before using. Besides, all the test of the properties (water uptake, swelling, hydroxide conductivity) were all done in a big box full of nitrogen.The IEC of the ionomers were determined using the back titration method.38 The dry ionomer with OH− form was immersed in 30 mL of 0.01 M HCl solution for 48 h at 30 °C, then the solution was titrated against 0.01 M NaOH solution, and the phenolphthalein was used as indicator. The IEC was calculated as follows:
 | (1) |
The dimension of the wet and dry samples were measured, and the swelling ratio SR (%) could be calculated by:
 | (2) |
To measure the water uptake of the ionomer, firstly, the ionomer membrane was immersed into deionized water at 30 °C for 24 h. Then the membranes were taken out, and surface attached water was wiped with a tissue paper, and immediately weighed on a microbalance. The dry membrane was obtained by drying in vacuum at 60 °C until constant weight. The water uptake Wu (wt%) could be calculated by:
 | (3) |
2.5. Hydroxide ion conductivity
The conductivity of ionomer membrane was measured following a standard four-point probe technique by an AC impedance spectroscopy using a Solartron 1260 frequency response analyser coupled to a Solartron 1287 potentiostat. The measurement used the potentiostat mode with the frequency range from 1 MHz to 0.1 Hz and the oscillating voltage of 10 mV. Before the test, specimens were soaked in DI water for at least 24 h. Then ionomer membrane was taken out quickly and clamped between two platinum electrodes, and the measurement was in DI water with relative humidity of 100% at different temperature. The ionomer conductivity (σ, S cm−1) could be calculated by the following equation.
 | (4) |
2.6. MEA fabrication
To characterize the performance of the ionomer in AEMFC, the homemade membrane AEH9620 was chosen as the anion exchange membrane to prepare the MEA in this paper, and its preparation procedure was disclosed in the previous work.37 The key properties of the AEH9620 membrane were listed in Table 1. The commercial ionomer I2 (Acta S.p.A. Co.) and prepared CMSEBS were chosen as the ionomer during the preparing the catalyst ink for both the anode and cathode, respectively. The preparation of catalyst ink as followed: a commercial catalyst Pt/C (70%, JM Co.) was mixed with a certain amount of water, tetrahydrofuran (or propyl alcohol) and CMSEBS solution (or I2 solution), and the ionomer was in an 80![[thin space (1/6-em)]](https://www.rsc.org/images/entities/char_2009.gif) :
:![[thin space (1/6-em)]](https://www.rsc.org/images/entities/char_2009.gif) 20 as catalyst: ionomer weight ratio. The homogenous ink was obtained by sonication, then the ink was brushed onto the two sides of the AEH9620 by thermal spray casting, and the Pt loading in the anode and cathode were both 0.5 mg cm−2. Besides, the MEA using the CMSEBS as the ionomer needed to immerse in trimethylamine solution 24 h for quaternary amination and then to soak in 1 M KOH solution 24 h for alkalization. The MEA was sandwiched between two pieces of gas diffuse layers, and hot-pressed at 60 °C, 1 MPa for 2 min to assemble a single cell with an active electrode area of 5 cm2.
20 as catalyst: ionomer weight ratio. The homogenous ink was obtained by sonication, then the ink was brushed onto the two sides of the AEH9620 by thermal spray casting, and the Pt loading in the anode and cathode were both 0.5 mg cm−2. Besides, the MEA using the CMSEBS as the ionomer needed to immerse in trimethylamine solution 24 h for quaternary amination and then to soak in 1 M KOH solution 24 h for alkalization. The MEA was sandwiched between two pieces of gas diffuse layers, and hot-pressed at 60 °C, 1 MPa for 2 min to assemble a single cell with an active electrode area of 5 cm2.
| Thickness (μm) in dry state | IEC (mmol g−1) | OH− conductivity (S cm−1) | Mechanical strength (MPa) |
|---|---|---|---|
| 22 | 1.35 | 0.035 | 99.7 |
2.7. Fuel cell test
A homemade fuel cell test system was used for controlling humidity, the cell temperature, H2 and O2 flow rate, and backpressures. For operation of AEMFC, the temperature of H2 and O2 was 50 °C and relative humidity was 100%. The flow rate of H2 and O2 was 100, 200 mL min−1 at 0.20 MPa, respectively. An electric load system (KMF2030, Kikusui Electronics Corp.) and Solartron 1260 workstation were used to measure and record the i–V curves and ohmic resistance of the AEMFC. The EIS experiments were carried out at a current density of 100 mA cm−2 and 200 mA cm−2 with a small amplitude alternating voltage of 10 mV and the frequency range was from 10 kHz to 0.1 Hz. In order to further characterize the performance of the ionomer in AEMFC, the operation time of the cell under the constant current density 100 mA cm−2 was tested and recorded by the electric load system.2.8. Characterization of CL microstructure
The surface morphology of the electrodes were investigated using a scanning electron microscope (SEM) (JEOL JSM-6700F) with an acceleration voltage 3.0 kV.2.9. Transmission electron microscopy (TEM) observation
The TEM of the QASEBS (Cl type) was observed. The operation details are as follows. Firstly, the membrane was solidified using the epoxy resin; then the solidified membrane was sliced with the thickness of ca. 100 nm; at last, the slices were placed on a Cu grid, followed by exchanging the anions for PtCl62−, and then subjected to TEM observations.3. Results and discussion
3.1. Characterization of the QASEBS ionomer
The SEBS with 30 wt% styrene units is chosen as the raw material to prepare ionomers. The process of functioning SEBS as follows: firstly, the chloromethylation reaction of the SEBS occurs in a diluted chloroform solution by BCMB under catalysis of tin(IV) chloride at the temperature of 55 °C for 12 h. Then the chloromethylated SEBS is precipitated from a 5 wt% tetrahydrofuran solution to methanol for purification. Lastly, the CMSEBS is dissolved in tetrahydrofuran to prepare a 5 wt% ionomer solution for using in preparation of the MEA.The substance structures are characterized by 1H NMR and FT-IR. The chloromethylation reaction is monitored by 1H NMR, as shown in Fig. 1. Compared with the Fig. 1(a) of the SEBS, a new peak 9 occurs in the Fig. 1(b) (1H NMR (400 MHz, chloroform-d, 25 °C, TMS): δ = 4.5 (s, 2H, CH2)), which indicates that the chloromethyl groups are successfully grafted onto the SEBS. Besides, the 1H NMR of QASEBS was also conducted. Due to the QASEBS bad solubility, an indirect method is employed. The results were shown in Fig. 1(c) and (d). Compared with Fig. 1(b) and (d), the peak 9 of σ = 4.5 disappeared and a new peak 9′ of σ = 4.67 occurred in Fig. 1(c), and the peak 9′ was attributed to the H of –CH2–N+–, which demonstrated the CMSEBS was successfully quaternized.39 Then the solid membranes structure is characterized by FTIR spectra. As shown in the Fig. 2, the peaks at 3025 and 3059 cm−1 in Fig. 2(a) were associated with the stretching vibration of CH![[double bond, length as m-dash]](https://www.rsc.org/images/entities/char_e001.gif) groups of aromatic hydrocarbon,40 but they disappeared in Fig. 2(b) due to reaction of the styrene units. Furthermore, the peaks at 822 cm−1, 1263 cm−1 in the Fig. 2(b) also demonstrated the existence of C–Cl bond, and a characteristic peak at 1118 cm−1 was observed, which represented the stretching vibration of C–N groups in Fig. 2(c).40 The observation suggested the quaternary ammonium groups being successfully introduced into the SEBS, which accorded with the results of the 1H NMR.
groups of aromatic hydrocarbon,40 but they disappeared in Fig. 2(b) due to reaction of the styrene units. Furthermore, the peaks at 822 cm−1, 1263 cm−1 in the Fig. 2(b) also demonstrated the existence of C–Cl bond, and a characteristic peak at 1118 cm−1 was observed, which represented the stretching vibration of C–N groups in Fig. 2(c).40 The observation suggested the quaternary ammonium groups being successfully introduced into the SEBS, which accorded with the results of the 1H NMR.
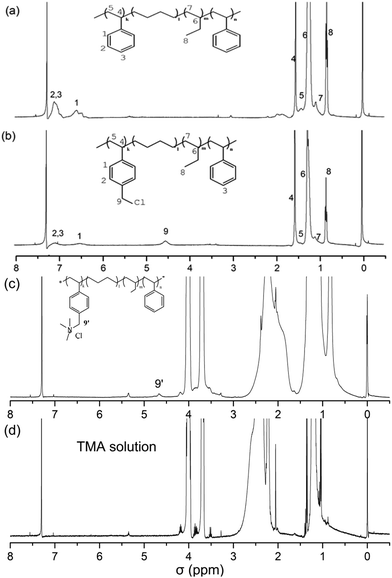 | ||
| Fig. 1 (a) 1H NMR spectra of Asahi KASE Tuftec SEBS H1031, (b) CMSEBS, (c) QASEBS (Cl type) and (d) TMA solution in chloroform-d. | ||
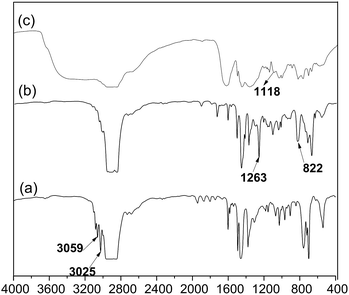 | ||
| Fig. 2 (a) FTIR spectra of Asahi KASE Tuftec SEBS H1031 (b) CMSEBS and (c) QASEBS (Cl type, thin film). | ||
3.2. Physical properties of the QASEBS ionomer
Firstly, the water uptake has an observable effect on the transport behaviour and mechanical properties of a membrane. It is well known that the higher water uptake can offer more opportunity for ions to transfer through the membrane, leading to a higher conductivity, but excessive water uptake will cause serious dimensionality deformation, and even reduce the mechanical stability of the membrane.41 Similarly, it is an important factor for ionomer to use in the catalyst layer. The water uptake, IEC and swelling ratio of the QASEBS ionomer with OH− form are listed in Table 1. The water uptake of the sample is only 57%, and the swelling ratio of the ionomer is 20.4%, 19.1%, 14.5% in the length, width and thickness direction at room temperature, respectively. The results demonstrate that the ionomeric membrane possesses good dimensionality stability.As a key parameter of the membrane, the IEC represents the hydroxide ion concentration in a polymer matrix, which has an important effect on the water uptake and hydroxide ion conductivity of the ionomer. As shown in Table 2, the IEC of the ionomer is only 0.21 mmol g−1 because the content of the styrene units in the raw material SEBS which can be functioned to the quaternary ammonium groups are very low and only 30 wt%.23
| Water uptake [wt%] | Swelling ratio [%] | IEC [mmol g−1] | ||
|---|---|---|---|---|
| Length | Width | Thickness | ||
| 57.0 | 20.4 | 19.1 | 14.5 | 0.21 |
Besides, the hydroxide ion conductivity of the ionomer is also an important parameter, which affects directly the performance of fuel cell.37 The ion conductivity of the ionomer at different temperature is characterized. As shown in Fig. 3(a), the ion conductivities of the QASEBS ionomer are measured in deionized water at a temperature range from 25 to 75 °C, and the ion conductivity of the ionomer increase with the temperature. Assuming the ion conductivity of the ionomer followed the Arrhenius behaviour, the activation energy Ea of the OH− transportation in the ionomer could be derived from Fig. 3(a) and calculated as 17.52 kJ mol−1, by the curve fitting with the equation Ea = −b × R, where b is the slope of the fitting curve of ln![[thin space (1/6-em)]](https://www.rsc.org/images/entities/char_2009.gif) σ vs. 1000/T (Fig. 3(b)), R is the universal gas constant (8.314 J K−1 mol−1), σ is the OH−1 conductivity, and T is absolute temperature (K). The ionomer membrane shows a higher OH− transportation activation energy than that obtained in the A901 (Tokuyamma Co. Japan) membrane (14.10 kJ mol−1), which indicates that the ionomer has a weak effect on the change of temperature.
σ vs. 1000/T (Fig. 3(b)), R is the universal gas constant (8.314 J K−1 mol−1), σ is the OH−1 conductivity, and T is absolute temperature (K). The ionomer membrane shows a higher OH− transportation activation energy than that obtained in the A901 (Tokuyamma Co. Japan) membrane (14.10 kJ mol−1), which indicates that the ionomer has a weak effect on the change of temperature.
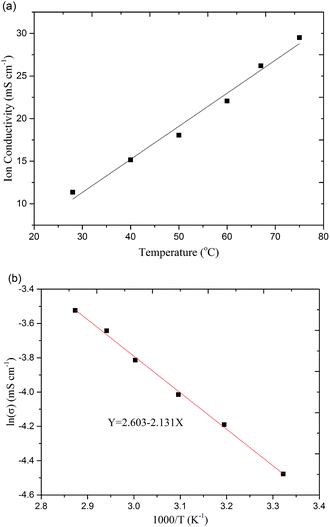 | ||
| Fig. 3 Ionic conductivity (a) and Arrhenius plot (b) of the QASEBS with OH− form at different temperatures. | ||
To further analyse the performance of the membrane with the low IEC, we explored whether the microphase separation existed in the membrane or not, for that some publications has demonstrated the microphase separation in the membrane could promote the improvement of the ion conductivity.16,46 Therefore, in order to demonstrate the existence of the hydrophilic/hydrophobic phase separation micro-structure in QASEBS and the transmission electron microscopy (TEM) of the membrane was conducted on JEM-2100 microscope with an accelerating voltage of 200 kV. The result was shown in Fig. 4. The dark and bright spots in the image represented the hydrophilic and hydrophobic micro-phase, respectively, and the clear hydrophilic/hydrophobic micro-phase separation was observed in the image, which was contributed to form efferent ion transport channels and could promote the OH− conducting.16 The formation of hydrophilic/hydrophobic micro-phase separation were attributed to the change that the poly styrene block of the triblock copolymers SEBS became the hydrophilic block after functionalization, which could form phase separation micro-structure with the hydrophobic alkyl chains.47
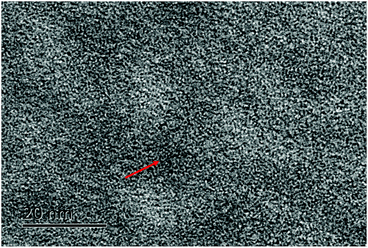 | ||
| Fig. 4 The TEM image of QASEBS. The dark spots represent the hydrophilic domains (as shown in red arrow). | ||
3.3. Fuel cell performance
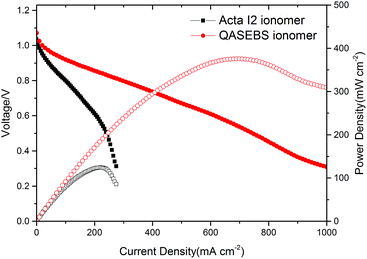
The performance of the ionomer is further studied in AEMFCs, and for the comparison, the performance of AEMFCs assembled with Acta I2 ionomer is also tested. The polarization and power curves of the MEAs are presented in Fig. 5. All the MEAs are assembled with the homemade membrane AEH9620; only the ionomer binders used in the anodes and cathodes are different. Operating at 50 °C and 200 kPa backpressure for H2/O2, the AEMFCs with QSEBS ionomer in both the anode and cathode outperform that with the Acta I2 ionomer under the same test conditions. As shown in Fig. 5, the open circuit voltage of the AEMFCs with Acta I2 and QASEBS ionomer is 1.03 V and 1.07 V, respectively. The peak power density of the MEA with the QASEBS ionomer reaches 375 mW cm−2 when the current density is 688 mA cm−2 and the cell voltage is 0.545 V, which is better than that of MEA with the commercial Acta I2 ionomer (124 mW cm−2). These results indicate that the QASEBS ionomer has lower ionic transport resistance in the electrode than that of the Acta I2 ionomer due to the higher ion conductivity, which is proven by EIS in the later discussion. Although the IEC and the conductivity of the QASEBS ionomer was not very high, the performance of the AEMFC with the QASEBS ionomer was good. The results of the cell performance show that the conductivity of the ionomer in the catalyst layers is not the only role to play, in other words, and the other properties including water uptake, swelling and the comparability of the ionomer with membrane are also critical factors to be considered,48 which is contributed to building an efficient three-phase boundary in the catalyst layers, as mentioned in Yang's report.49Besides, the QASEBS ionomer was compared with the literature reported ionomer with TMA based quaternary ammonium in terms of the properties (IEC and conductivity) and cell performance, and the Table 3 presented the results of these ionomers. Although the ionomer in this work has low IEC, the conductivity of the QASEBS ionomer is comparable with the ionomer reported. Besides, the low IEC could limit the water uptake and swelling of the ionomer, which was benefit to construct and stabilize the ionomer–catalyst interface and develop performance of the AEMFC.50 Furthermore, the most of ionomers reported didn't conduct the durability test of the H2/O2 AEMFC.
| Ionomers | Ionic group | IECb, mmol g−1 | Conductivity, mS cm−1 | Pmaxc, mW cm−2 | Durabilityf, hours | Ref. |
|---|---|---|---|---|---|---|
| a QATMA = TMA based quaternary ammonium.b IEC, the ion exchange capacity.c Pmax, the peak power density of H2/O2 AEMFC.d Not completed.e r. t. = room temperature.f Durability, the operation time of the H2/O2 AEMFC under 100 mA cm−2. | ||||||
| QAPS | QATMAa | 1.18 | 20 (30 °C) | 100 | n.a.d | 42 |
| AS-4 | QATMA | 1.30 | 13 (30 °C) | 338 | 234@100 mA cm−2 | 27 |
| FAA | QATMA | 1.20 | 17 (20 °C) | 200 | 146@100 mA cm−2 | 34 |
| QPMBV | QATMA | 1.35 | 10 (30 °C) | 180 | n.a. | 43 |
| ETFE-g-poly(VBTMAC) | QATMA | 1.24 | n. a. | 1160 | n.a. | 36 |
| QAPVA | QATMA | 1.20 | 23 (r. t.)e | 172.8 | n.a. | 22 |
| PTFE-VBTMAC | QATMA | n. a. | n. a. | 130 | n.a. | 44 |
| S-PFSO2NH-GCI-CI | QATMA | n. a. | n. a. | 138 | n.a. | 45 |
| QASEBS | QATMA | 0.21 | 11 (30 °C) | 375 | 550@100 mA cm−2 | This work |
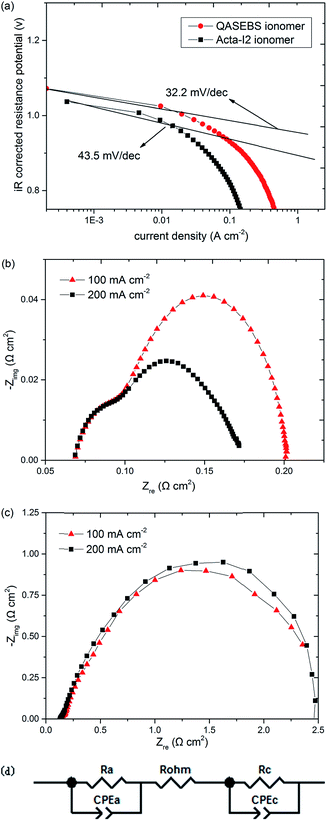
To further investigate the effects of the ionomer on the cell performance, associating with the Tafel plots of the AEMFCs with the QASEBS ionomer and the Acta I2 ionomer after the iR-correction, the electrode kinetic parameters are obtained by fitting the i–V curves at low current density (<50 mA cm−2).49,51 As shown in the Fig. 6(a), the Tafel slopes of the AEMFCs with the QASEBS ionomer and the Acta I2 ionomer are 32.2 mV dec−1 and 43.5 mV dec−1, respectively. The results reveal that the ionomers have effects on the active polarization losses, and furthermore, in the high current density, the AEMFC with the Acta I2 ionomer have more serious voltage degradation than that with the QASEBS ionomer due to the ohmic overpotential and mass diffusion polarization losses.49 Besides, to understand the polarization behaviours of various ionomer in the MEAs, the in situ EIS measurements are carried out by discharging AEMFC at various current density, including 100 and 200 mA cm−2, respectively. Compared with the results of the MEAs with various ionomer, the obvious effects are made on the high frequency and mid-frequency resistance referred to the ohmic polarization and charge-transfer limitations. As shown in the Fig. 6(b) and (c), the ohmic resistance of AEMFC with the QASEBS ionomer is 0.07 Ω cm2, while that of AEMFC with the Acta I2 ionomer reaches 0.14 Ω cm2, twice of the former. Furthermore, when the current density vary from 100 to 200 mA cm−2, the mid-frequency of AEMFC with QASEBS ionomer remarkably decreases due to the current addition leading to the water content of the MEA increasing and further the ohmic resistance decreasing. On the other hand, the EIS data of AEMFC with Acta I2 ionomer was not changing, and it's mainly caused by the high hydrophilicity and is easy to be flooded at high current density.19 In addition, EIS impedance spectra of MEAs under 100 and 200 mA cm−2 were fitted using the equivalent circuit illustrated in Fig. 6(d). Rohm, Ra and Rc represented ohmic resistance, charge transfer resistance of anode and cathode and were shown in Table 4, respectively. It is noteworthy that the Ra and Rc of the MEA with the QASEBS ionomer is lower than that of the MEA with the Acta I2 ionomer. Furthermore, the charge transfer resistance and the mass diffusion resistance will increase because the flooding leads to the deterioration of the TPBs and the mass transportation and further the voltage degradation, which is in accord with the results of the i–V measurements.
| Rohm, Ω cm2 | Ra, Ω cm2 | Rc, Ω cm2 | ||
|---|---|---|---|---|
| QASEBS ionomer | 100 mA cm−2 | 0.07144 | 0.02442 | 0.1065 |
| 200 mA cm−2 | 0.07052 | 0.01073 | 0.09139 | |
| Acta I2 ionomer | 100 mA cm−2 | 0.1407 | 0.2204 | 2.435 |
| 200 mA cm−2 | 0.1372 | 0.2186 | 2.361 | |
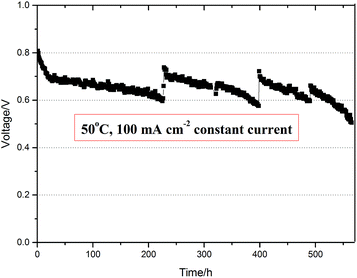
Furthermore, the durability of the electrode with QASEBS ionomer is also investigated. As shown in Fig. 7, the MEA's lifetime has been over 550 h under the constant current density 100 mA cm−2, which is more than that reported in the public literatures.19,43 Moreover, the voltage of the MEA remains above 0.6 V, and the rate of the average voltage degradation is about 0.22 mV h−1. During the test, the voltage quickly dropped from 0.8 V to 0.7 V at first of 50 h, which is ascribed to the polarization loss of AEMFC. At 200 h and 400 h, the operation pressure of AEMFC is unloaded and the voltage increases about 100 mV, while the liquid drops expel from the cell inside. These results demonstrated that the liquid water will accumulate during the process of the AEMFC operation, and the relief pressure is benefit to the evaporation and exhaust of the liquid water and further improves the water management of AEMFC. On the other hand, the flow rate of H2 and O2 increased for that the pressure difference increased, and increased the ratio of reactant gases and promoted the electrochemical reaction, which led to the increase of cell voltage.
Besides, the SEM of the electrode before and after test were performed, as shown in Fig. 8. Comparing the SEM spectrum of before test electrode with that of after test electrode, we found that the SEM images of the catalyst layer before and after test were similar, which also might explain the good durability of the AEMFC with the QASEBS ionomer.
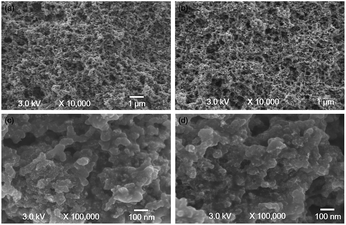 | ||
| Fig. 8 SEM of the electrode with the QASEBS ionomer before (a and c) and after (b and d) of the durability test. | ||
4. Conclusions
For AEMFC, the ionomer is the key material of the catalyst layer, which determines the property of the MEA to a large extent. In this work, the triblock copolymer SEBS with good chemical and thermal stability was chosen raw material, and the CMSEBS ionomer that could dissolve in tetrahydrofuran which benefit MEA fabrication process was synthesized. By 1H-NMR, FT-IR characteristic, it was found that the functional groups was grafted onto the SEBS successfully. Moreover, the physical properties of the QASEBS ionomer, such as water uptake, swelling ratio, conductivity and IEC, were measured, and the OH− conductivity of the ionomer reached 30 mS cm−1 at 75 °C. Besides, the QASEBS was used as the ionomer in the H2/O2 anion exchange membrane fuel cell and showed a peak power density of 375 mW cm−2 at 50 °C, which was about 3 times higher than that of the MEA using the commercially available Acta I2 ionomer (124 mW cm−2). In addition, only 0.22 mV h−1 degradation rate of voltage was seen during durability test at a constant current density 100 mA cm−2 for 550 h.Acknowledgements
This work was financially supported by the National Key Research and Development Program of China (Program No. 2016YFB0101200 (2016YFB0101208)) and the National Natural Science Foundations of China (Grant No. 91434106 and 21473197).Notes and references
- S. F. Lu, J. Pan, A. B. Huang, L. Zhuang and J. T. Lu, Proc. Natl. Acad. Sci. U. S. A., 2008, 105, 20611–20614 CrossRef CAS.
- J. R. Varcoe and R. C. T. Slade, Fuel Cells, 2005, 5, 187–200 CrossRef CAS.
- J. R. Varcoe, P. Atanassov, D. R. Dekel, A. M. Herring, M. A. Hickner, P. A. Kohl, A. R. Kucernak, W. E. Mustain, K. Nijmeijer, K. Scott, T. Xu and L. Zhuang, Energy Environ. Sci., 2014, 7, 3135–3191 CAS.
- G. Merle, M. Wessling and K. Nijmeijer, J. Membr. Sci., 2011, 377, 1–35 CrossRef CAS.
- J.-S. Park, S.-H. Park, S.-D. Yim, Y.-G. Yoon, W.-Y. Lee and C.-S. Kim, J. Power Sources, 2008, 178, 620–626 CrossRef CAS.
- Q. G. He and E. J. Cairns, J. Electrochem. Soc., 2015, 162, F1504–F1539 CrossRef CAS.
- M. R. Tarasevich and O. V. Korchagin, Russ. J. Electrochem., 2013, 49, 600–618 CrossRef CAS.
- J. Cheng, G. H. He and F. X. Zhang, Int. J. Hydrogen Energy, 2015, 40, 7348–7360 CrossRef CAS.
- Y. J. Wang, J. L. Qiao, R. Baker and J. J. Zhang, Chem. Soc. Rev., 2013, 42, 5768–5787 RSC.
- Z. Y. Luo, Y. J. Gong, X. F. Liao, Y. J. Pan and H. W. Zhang, RSC Adv., 2016, 6, 13618–13625 RSC.
- L. Zhu, J. Pan, Y. Wang, J. J. Han, L. Zhuang and M. A. Hickner, Macromolecules, 2016, 49, 815–824 CrossRef CAS.
- Q. Ge, Y. Liu, Z. Yang, B. Wu, M. Hu, X. Liu, J. Hou and T. Xu, Chem. Commun., 2016, 52, 10141–10143 RSC.
- Z. B. Zhuang, S. A. Giles, J. Zheng, G. R. Jenness, S. Caratzoulas, D. G. Vlachos and Y. S. Yan, Nat. Commun., 2016, 7, 8 Search PubMed.
- L. M. Dai, Y. H. Xue, L. T. Qu, H. J. Choi and J. B. Baek, Chem. Rev., 2015, 115, 4823–4892 CrossRef CAS PubMed.
- Q. Li, R. Cao, J. Cho and G. Wu, Adv. Energy Mater., 2014, 4, 19 Search PubMed.
- J. Pan, C. Chen, Y. Li, L. Wang, L. S. Tan, G. W. Li, X. Tang, L. Xiao, J. T. Lu and L. Zhuang, Energy Environ. Sci., 2014, 7, 354–360 CAS.
- J. R. Varcoe, R. C. T. Slade and E. Lam How Yee, Chem. Commun., 2006, 1428–1429, 10.1039/b600838k.
- H. Yanagi and K. Fukuta, ECS Trans., 2008, 16, 257–262 CAS.
- M. Piana, M. Boccia, A. Filpi, E. Flammia, H. A. Miller, M. Orsini, F. Salusti, S. Santiccioli, F. Ciardelli and A. Pucci, J. Power Sources, 2010, 195, 5875–5881 CrossRef CAS.
- M. Tanaka, M. Koike, K. Miyatake and M. Watanabe, Polym. Chem., 2011, 2, 99–106 RSC.
- F. X. Zhang, H. M. Zhang, C. Qu and J. X. Ren, J. Power Sources, 2011, 196, 3099–3103 CrossRef CAS.
- M.-S. Shin, Y.-J. Byun, Y.-W. Choi, M.-S. Kang and J.-S. Park, Int. J. Hydrogen Energy, 2014, 39, 16556–16561 CrossRef CAS.
- L. Sun, J. S. Guo, J. Zhou, Q. M. Xu, D. Chu and R. R. Chen, J. Power Sources, 2012, 202, 70–77 CrossRef CAS.
- E. E. Switzer, T. S. Olson, A. K. Datye, P. Atanassov, M. R. Hibbs, C. Fujimoto and C. J. Cornelius, Electrochim. Acta, 2010, 55, 3404–3408 CrossRef CAS.
- L. Zeng and T. S. Zhao, Electrochem. Commun., 2013, 34, 278–281 CrossRef CAS.
- Y. Zhao, H. M. Yu, D. M. Xing, W. T. Lu, Z. G. Shao and B. L. Yi, J. Membr. Sci., 2012, 421, 311–317 CrossRef.
- Y. Zhao, H. M. Yu, D. L. Yang, J. Li, Z. G. Shao and B. L. Yi, J. Power Sources, 2013, 221, 247–251 CrossRef CAS.
- N. W. Li, Y. J. Leng, M. A. Hickner and C. Y. Wang, J. Am. Chem. Soc., 2013, 135, 10124–10133 CrossRef CAS PubMed.
- L. Zeng, T. S. Zhao, L. An, G. Zhao, X. H. Yan and C. Y. Jung, J. Power Sources, 2015, 275, 506–515 CrossRef CAS.
- J. A. Kerres, J. Membr. Sci., 2001, 185, 3–27 CrossRef CAS.
- Y. Leng, L. Wang, M. A. Hickner and C.-Y. Wang, Electrochim. Acta, 2015, 152, 93–100 CrossRef CAS.
- S. D. Poynton, R. C. T. Slade, T. J. Omasta, W. E. Mustain, R. Escudero-Cid, P. Ocon and J. R. Varcoe, J. Mater. Chem. A, 2014, 2, 5124–5130 CAS.
- J. Pan, S. Lu, Y. Li, A. Huang, L. Zhuang and J. Lu, Adv. Funct. Mater., 2010, 20, 312–319 CrossRef CAS.
- S. Gu, R. Cai, T. Luo, Z. W. Chen, M. W. Sun, Y. Liu, G. H. He and Y. S. Yan, Angew. Chem., Int. Ed., 2009, 48, 6499–6502 CrossRef CAS PubMed.
- J. R. Varcoe, R. C. T. Slade, G. L. Wright and Y. Chen, J. Phys. Chem. B, 2006, 110, 21041–21049 CrossRef CAS PubMed.
- L. Wang, E. Magliocca, E. L. Cunningham, W. E. Mustain, S. D. Poynton, R. Escudero-Cid, M. M. Nasef, J. Ponce-Gonzalez, R. Bance-Souahli, R. C. T. Slade, D. K. Whelligan and J. R. Varcoe, Green Chem., 2017, 19, 831–843 RSC.
- Y. Zhao, H. M. Yu, F. Xie, Y. X. Liu, Z. G. Shao and B. L. Yi, J. Power Sources, 2014, 269, 1–6 CrossRef CAS.
- Y. S. Kim and K. S. Lee, Polym. Rev., 2015, 55, 330–370 CrossRef CAS.
- C. R. Yang, S. L. Wang, W. J. Ma, L. H. Jiang and G. Q. Sun, J. Membr. Sci., 2015, 487, 12–18 CrossRef CAS.
- Q. H. Zeng, Q. L. Liu, I. Broadwell, A. M. Zhu, Y. Xiong and X. P. Tu, J. Membr. Sci., 2010, 349, 237–243 CrossRef CAS.
- Q. J. Duan, S. H. Ge and C. Y. Wang, J. Power Sources, 2013, 243, 773–778 CrossRef CAS.
- J. Pan, S. F. Lu, Y. Li, A. B. Huang, L. Zhuang and J. T. Lu, Adv. Funct. Mater., 2010, 20, 312–319 CrossRef CAS.
- Y. T. Luo, J. C. Guo, C. S. Wang and D. Chu, Electrochem. Commun., 2012, 16, 65–68 CrossRef CAS.
- J. R. Varcoe and R. C. T. Slade, Electrochem. Commun., 2006, 8, 839–843 CrossRef CAS.
- X. D. Liu, H. R. Gao, X. H. Chen, Y. Hu, S. P. Pei, H. Li and Y. M. Zhang, J. Membr. Sci., 2016, 515, 268–276 CrossRef CAS.
- J. Han, Q. Liu, X. Li, J. Pan, L. Wei, Y. Wu, H. Peng, Y. Wang, G. Li, C. Chen, L. Xiao, J. Lu and L. Zhuang, ACS Appl. Mater. Interfaces, 2015, 7, 2809–2816 CAS.
- Q. Li, L. Liu, Q. Q. Miao, B. K. Jin and R. K. Bai, Polym. Chem., 2014, 5, 2208–2213 RSC.
- R. Zeng, J. Handsel, S. D. Poynton, A. J. Roberts, R. C. T. Slade, H. Herman, D. C. Apperley and J. R. Varcoe, Energy Environ. Sci., 2011, 4, 4925–4928 CAS.
- D. L. Yang, H. M. Yu, G. F. Li, Y. Zhao, Y. X. Liu, C. K. Zhang, W. Song and Z. G. Shao, J. Power Sources, 2014, 267, 39–47 CrossRef CAS.
- V. R. Stamenkovic, D. Strmcnik, P. P. Lopes and N. M. Markovic, Nat. Mater., 2017, 16, 57–69 CrossRef CAS PubMed.
- D. S. Kim, C. H. Fujimoto, M. R. Hibbs, A. Labouriau, Y. K. Choe and Y. S. Kim, Macromolecules, 2013, 46, 7826–7833 CrossRef CAS.
| This journal is © The Royal Society of Chemistry 2017 |

