 Open Access Article
Creative Commons Attribution 3.0 Unported Licence
Experimental and ab initio studies of two UV nonlinear optical materials†
Juanjuan Lu‡
ab,
Guoqiang Shi‡ab,
Hongping Wu *a,
Ming Wenc,
Dianwei Houa,
Zhihua Yang
 a,
Fangfang Zhang*a and
Shilie Pan
 *a
*a
aKey Laboratory of Functional Materials and Devices for Special Environments of CAS, Xinjiang Key Laboratory of Electronic Information Materials and Devices, Xinjiang Technical Institute of Physics & Chemistry of CAS, 40-1 South Beijing Road, Urumqi 830011, China. E-mail: slpan@ms.xjb.ac.cn; Fax: +86-991-3838957; Tel: +86-991-3674558
bUniversity of Chinese Academy of Sciences, Beijing 100049, China
cSchool of Chemistry and Chemical Engineering, Harbin Institute of Technology, Harbin, Heilongjiang 150001, China
First published on 7th April 2017
Abstract
Two new acentric polyborates, Ba3(OH)(B9O16)[B(OH)3] and Ba2.16Pb0.84(OH)(B9O16)[B(OH)3] have been synthesized hydrothermally and their structures have been determined by single-crystal X-ray diffraction. Both crystals are isostructural and crystallize in the trigonal space group P31c (no. 159). Their structures feature a three-dimensional (3D) B9O19 framework with 6-membered-ring tunnels, in which the Ba or Pb/Ba cations and [B(OH)3] groups reside. Powder second-harmonic-generation (SHG) measurements reveal that Ba3(OH)(B9O16)[B(OH)3] and Ba2.16Pb0.84(OH)(B9O16)[B(OH)3] are type-I phase-matchable, with SHG responses of 1.1× and 1.2× KH2PO4, respectively. UV-Vis-NIR diffuse reflectance analysis indicates that Ba3(OH)(B9O16)[B(OH)3] and Pb0.29Ba2.71(OH)(B9O16)[B(OH)3] have band gaps of 5.11 and 4.65 eV, respectively. In addition, first-principles calculations were employed to elucidate the origin of the NLO properties and the relationship of structure–properties.
Introduction
Nonlinear optical (NLO) materials have numerous important applications in semiconductor photolithography, laser micromachining, photochemical synthesis, and material processing due to their abilities to expand the frequency range of solid-state lasers from UV to IR.1,2 Over the past decades, extensive efforts have been made to search for new NLO materials with excellent properties, including a large second harmonic generation (SHG) response and wide transparency window,3 etc. To enhance the SHG response of the materials, “distortable” metal cations containing the d0 or d10 transition metals (e.g., Ti4+, V5+, Zn2+, Cd2+, etc.) and stereochemically active lone pair (SCALP) cations (Bi3+, Pb2+, Te4+, etc.) are introduced into the crystal structures.4–7 Unfortunately, the introduction of these cations always causes red shifts of the ultraviolet (UV) absorption edge. Compared with the d0 or d10 transition metal, alkaline-earth metal cations have wide transmittances in UV region. In addition, borate is transparent in UV range as well. And it has a twice probability (in average) to be non-centrosymmetric than that of other inorganic compounds,1a which becomes a good candidate for NLO materials.With this in minds, we combine the alkaline-earth metal cation with the borate system and successfully synthesize a new barium borate, Ba3(OH)(B9O16)[B(OH)3] (I), through the hydrothermal method. It has a large band gap of 5.11 eV and is type-I phase matchable with SHG responses of about 1.1× K2HPO4 (KDP). Through our investigation, barium atoms can be replaced by lead atoms to generate larger SHG response in many non-centrosymmetric structures.8,9 For instance, Pb2Ba3(BO3)3Cl exhibit a large SHG response 6× higher than its isomorphic compound Ba5(BO3)3Cl. Thus, we tried to substitute lead for barium in compound I and obtained another new compound, Ba2.16Pb0.84(OH)(B9O16)[B(OH)3] (II). To systematically study the substitution influence of the Pb cations on optical properties, we synthesize the polycrystalline samples of Pb3(OH)(B9O16)[B(OH)3] (III),10 which is isomorphic with I and II. In this paper, we combine experimental characterization and theoretical calculations to study the optical properties among these three compounds. In addition, the thermal behavior and infrared (IR) spectra on these three compounds are also reported.
Experimental
Synthesis
All reagents were of analytical grade. Three compounds were synthesized under hydrothermal condition. The mixtures were mixed homogeneously and transferred to heat-sealed FEP Teflon pouches. The pouches were placed in 23 mL Teflon-lined stainless steel vessels and each vessel was added with about 8 mL distilled water. Then the vessels were heated to 210 °C for 12 days and cooled to room temperature at a rate of 2 °C h−1. The resulting colorless columnar crystals were obtained, washed with distilled water, and finally dried in air at ambient temperature.Structural determination
Single crystals of compounds I and II were collected at room temperature on a Bruker SMART APEX II CCD diffractometer with graphite monochromatic Mo Kα radiation (λ = 0.71073 Å) at 296(2) K and integrated with the SAINT program.11 The numerical absorption corrections were carried out using the SCALE program for area detector. All calculations were performed with programs from the SHELXTL crystallographic software package,12 and all of the atoms were refined using full-matrix least-squares techniques with anisotropic thermal parameters and finally converged for F02 ≥ 2σ(F02). During the refinement, we found that in the structure of compound I, the Ba(1) atom has a large thermal factor and a large Q peak is around the Ba(1) atom. Refined with the split model, a Ba(1) site with 88.9% occupancy and a Ba(2) site with 11.1% occupancy converge with better R values and reasonable temperature factors. The structures were checked for missing symmetry elements by the program PLATON.13 There was no higher symmetry to be found. Details of crystal parameters, data collection and structure refinements were shown in Table 1. The atomic coordinates, equivalent isotropic displacement coefficients and important bond lengths and angels were listed in Tables S1 and S2 in the ESI,† respectively. For comparison, the structure of compound III was reexamined and the data was also listed in Table 1.| a R1 = ∑||F0| − |Fc||/∑|F0| and wR2 = [∑w(F02 − Fc2)2/∑wF04]1/2 for F02 > 2σ(F02). | |||
|---|---|---|---|
| Empirical formula | I | II | III |
| Formula weight | 844.15 | 902.78 | 1053.70 |
| Crystal system | Trigonal | Trigonal | Trigonal |
| Space group, Z | P31c, 2 | P31c, 2 | P31c, 2 |
| Unit cell dimensions | a = 10.252(9) Å | a = 10.218(8) Å | a = 10.080(9) Å |
| c = 8.623(3) Å | c = 8.587(1) Å | c = 8.533(1) Å | |
| Volume (Å3) | 785.0(3) | 776.3(1) | 751.0(1) |
| Density (calculated) (mg m−3) | 3.571 | 3.910 | 4.642 |
| Theta range for data collection (deg) | 2.29 to 27.41 | 2.30 to 27.26 | 2.33 to 27.66 |
| Limiting indices | −13 ≤ h ≤ 11, −13 ≤k ≤ 11, −9 ≤ l ≤ 11 | −12 ≤h ≤13, 12 ≤k ≤13, −9 ≤ l ≤ 11 | −13 ≤ h ≤ 13, −11 ≤ k ≤ 13, −8 ≤ l ≤ 11 |
| Reflections collected/unique | 4561/1139 [R(int) = 0.0539] | 4331/1109 [R(int) = 0.0787] | 4458/1044 [R(int) = 0.0440] |
| Completeness to theta | 100.0% | 100.0% | 100.0% |
| Goodness-of-fit on F2 | 1.150 | 1.071 | 1.004 |
| Final R indices [F02 > 2σ(F02)]a | R1 = 0.0457, wR2 = 0.0919 | R1 = 0.0527, wR2 = 0.1155 | R1 = 0.0239, wR2 = 0.0403 |
| R indices (all data)a | R1 = 0.0489, wR2 = 0.0931 | R1 = 0.0595, wR2 = 0.1186 | R1 = 0.0264, wR2 = 0.0412 |
| Extinction coefficient | 0.0018(3) | 0.0071(1) | 0.0029(2) |
| Largest diff. peak and hole (e Å−3) | 1.574 and −1.404 | 1.673 and −2.123 | 1.294 and −0.759 |
Thermal analysis
The thermal gravity-differential scanning calorimetric (TG-DSC) analyses were carried out on NETZSCH STA 449 °C instrument at a temperature range of 30–1000 °C with a heating rate of 10 °C min−1 under a constant flow of nitrogen gas.Second-order NLO measurement
Powder SHG measurements were performed on a modified Kurtz-NLO system using a pulsed Nd:YAG laser (1064 nm, 10 kHz, 10 ns). A detailed description of the methodology has been published.14 As the powder SHG efficiency has been shown to strongly depend on particle size. The crystals of three compounds were ground and sieved into distinct particle size ranges: <20, 20–38, 38–55, 55–88, 88–105, 105–150, and 150–200 μm, respectively. The microcrystalline samples of KDP served as the standard and were also sieved into the same particle size ranges.Theoretical calculation details
The band structure of compounds I and III have been calculated by the first principles method. For compound I, we only think that the Ba(1) atoms are 100% occupancy used for the calculation, while for compound II calculations were not performed since the site disorder existed in the structure. The plane-wave pseudopotential method implemented in the CASTEP package15 was used to calculate the electronic structure and NLO properties. We adopted GGA-PBE as the exchange correlation function and norm-conserving pseudopotential to treat electron–core interactions.16,17 The kinetic energy cutoff was set as 800 and 870 eV for compounds I and III, respectively. The outmost electrons of H, B, and O, as well as Ba-5s2 5p6 6s2 and Pb-5s2 5p6 5d10 6s2 6p2, were considered to be valence electrons. The k-point was set as 2 × 2 × 2 for compounds I and III.At a zero frequency, the SHG coefficients were calculated using the length-gauge formalism method derived by Aversa et al. and developed by Lin and Zhang et al.18–20 The static second-order nonlinear coefficients can be ascribed to virtual-electron (VE) and virtual-hole (VH) processes,
| x(2)αβγ = x(2)αβγ(VE) + x(2)αβγ(VH). | (1) |
 | (2) |
 | (3) |
Results and discussion
Crystal structure
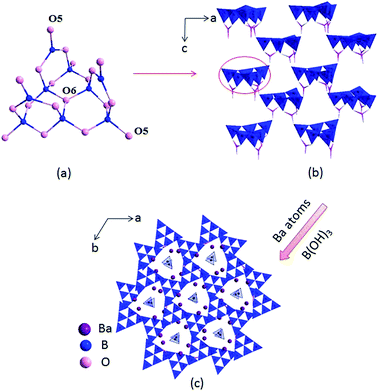
The compounds I, II and III are isostructural, hence, only the structure of compound I is discussed as the representative. Compound I crystallizes in a trigonal crystal system with an acentric space group of P31c (no. 159). In the asymmetric unit, the Ba, B and O atoms occupy one, four and eight crystallographically unique positions, respectively (Table S1 in the ESI†). The B atoms are bonded to three or four O atoms to form two kinds of coordination models BO3 triangles and BO4 tetrahedra. Six BO4 tetrahedra connected with three BO3 triangles to construct B9O19 group (Fig. 1a), which further connected by sharing oxygen atoms to build a 3D framework with tunnels along c axis (Fig. 1b), where the Ba atoms and B(OH)3 reside in (Fig. 1c).In the structure of compound I, the Ba atoms are connected with nine O atoms to form the Ba(1)O9 polyhedra, with the Ba–O bond lengths ranging in 2.496(3)–3.192(1) Å (average = 2.811(0) Å). Three Ba(1)O9 polyhedra connect with each other by sharing edges to form the 3D Ba–O framework (Fig. S2 in the ESI†). The B–O distances vary from 1.347(1)–1.441(1) Å (average = 1.376(5) Å) in the BO3 triangles and 1.442(1)–1.534(1) Å (average = 1.472(3) Å) in the BO4 tetrahedra, respectively, which are also similar to reported values in other borates, such as Ba4B11O20F,5d M2Ca3B16O28 (M = Rb, Cs)21 and Sr4B10O18(OH)2·2H2O.22 In addition, the bond valences of the Ba, Pb, B and O atoms have been calculated according to the Brown parameters for compounds I, II and III and are listed in Table S1 in the ESI,† which are in agreement with their ideal oxidation state (Ba, +2; Pb, +2; B, +3; O, −2).
Compounds I, II and III are isostructural and their fundamental structure units are all B9O19 group, which further connected with each other to build the 3D framework. While the coordination of the cations are not the same. In compound II, one site is occupied by constitutionally disordered Pb and Ba atoms, which is different from the total occupation of atoms on each site for compound III. In addition, in compounds I and II, the Ba atoms and Pb/Ba atoms are both located in nine coordination environments to form the Ba(1)O9 and Ba/PbO9 polyhedra, respectively. While in compound III, the Pb atoms are located in four coordination environments to form the PbO4 tetrahedra. Then three PbO4 tetrahedra are linked by sharing O7 atoms to form isolated Pb3O10 unit (Fig. S1c†).
Thermal analysis
The TG-DSC curves of three compounds are shown (Fig. S3†). Hydroxyl groups exist in three compounds, but at a relatively high temperature, it will be removed in the form of water molecule. Evident weight loss has been observed for compounds I, II and III in the temperature range 400–700, 400–600 and 200–300 °C, respectively. For compound I, the weight loss is 7.3%, which is due to the release of 3.5 molecules H2O per formula unit (calculated value 7.5%). For compound II, the weight loss of 3.9% is due to the releases of the two molecules H2O (calculated 4.0%). While for compound III, the weight loss is 1.8% due to the release of one molecule H2O (calculated 1.7%).IR spectrum
The IR spectra of compounds I, II and III are shown in Fig. S4.† Accordingly the absorption peaks are listed in Table 2. The spectra are similar on these three compounds. We can see that the absorption peaks locate at 3000–3450 cm−1 assigning to the vibrations of the OH groups. The strong absorption peaks between 1259 and 1433 cm−1 can be attributed to the asymmetric stretching of the BO3 groups, whereas the absorption peaks at about 925–950 cm−1 can be attributed to the symmetric stretching of the BO3 groups. The peaks located at ∼1120 and ∼810 cm−1 are the asymmetric and symmetric stretching of the BO4 groups, respectively. The bending vibrations of the BO3 and BO4 groups can be observed in the range 510–756 cm−1. The results show that the BO3 and BO4 groups exist in the three compounds.23,24| Mode description | I (cm−1) | II (cm−1) | III (cm−1) |
|---|---|---|---|
| Characteristic peak of OH | 3007 | 3455 | 3441 |
| Asymmetric stretching of B3–O | 1433, 1284 | 1424, 1318, 1267 | 1432, 1347, 1259 |
| Asymmetric stretching of B4–O | 1130, 1060 | 1122, 1056 | 1120, 1056 |
| Symmetric stretching of B3–O | 925 | 939 | 950 |
| Symmetric stretching of B4–O | 803 | 815 | 810 |
| Out-of-plane bending of B3–O | 756, 658, 614 | 747, 664 | 743, 663, 601 |
| Bending of B4–O and B3–O | 523 | 510 | 518 |
UV-Vis-NIR diffuse reflectance spectroscopy
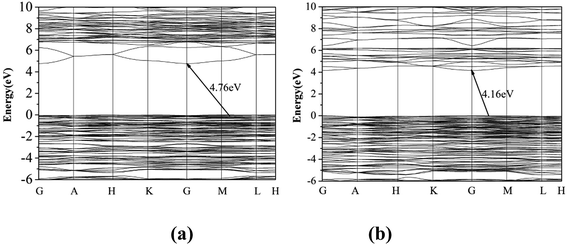
The optical diffuse reflectance spectra of compounds I, II and III in the region 190–2600 nm were measured (Fig. S5†). Reflectance spectra were converted to absorbance using the function, F(R) = (1 − R)2/2R, where R is the reflectance and F(R) is the Kubelka–Munk remission function.25,26 It is obtained that the experimental energy gaps of compounds I, II and III are 5.11, 4.65 and 4.58 eV, respectively (Fig. 2). Obviously, there is a red shift of the absorption edges from compound I to III due to the substitution of Pb for Ba atom.The first principle calculation results show that compounds I and III are indirect band gap compounds with calculated band gap 4.76 eV for compound I and 4.16 eV for compound III (Fig. 3). The calculated band gaps are smaller than the experimental ones, which is mainly caused by the inaccuracy of the exchange correlation energy.27,28
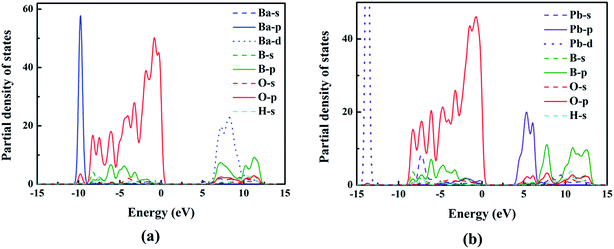
To better understand the relationship between electronic structures and optical properties, the density of states (DOS) of compounds I and III were compared and shown in Fig. 4. At the valence band, the two compounds have similar electronic structures: the inner valence orbitals for the constituent ions (i.e., O-2s orbitals, B-sp mixed orbitals, Ba-4s orbitals, and H-s orbitals), respectively. The valence bands from −10 to 0 eV for both compounds are mainly composed of the O-2p orbitals, B-2p orbitals, Ba-4p orbitals and H-s orbitals, respectively, and the O-2p orbitals have dominant contribution to the maximum of the valence bands. The conduction bands are mainly composed of B-2p orbitals, O-2p orbitals and Ba-5d for compound I, and B-2p orbitals, O-2p orbitals and Pb-6p for compound III. We can see that Pb-6p orbitals of compound III locate nearer to the Fermi level than Ba-5d orbitals of compound I, which cause the small red shift of the band gaps from compound I to compound III.
Second-harmonic generation effects
We have also investigated their SHG responses since the title compounds belong to a NCS space group (P31c). Compounds I, II and III exhibit a SHG response of 1.1, 1.2 and 2.7 times that of KDP, respectively (Fig. 5), which indicates that the Pb substitution can enhance the SHG response in the three compounds. In addition, compounds I, II and III are all type-I phase matchable because the second-harmonic intensities increase with the increase of particle size and go to saturation values.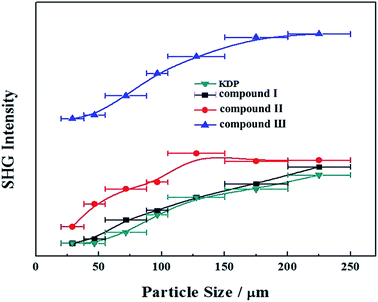 | ||
| Fig. 5 Powder SHG of compounds I, II and III at 1064 nm. Curves are drawn to guide the eye and are not a fit to the data. | ||
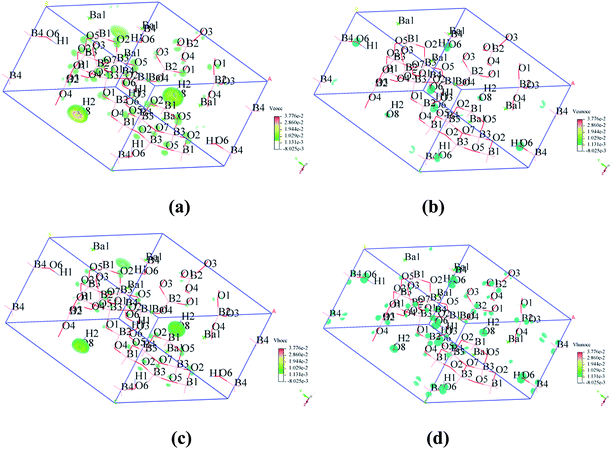
To visualize the SHG response of electronic states of compounds I and III, the SHG-density method29 was used to analyze the relationship between optical properties and electronic states. Since the VE and VH have the important effect on the SHG coefficient, both processes were analyzed. For compounds I and III, it crystallizes 3m point group, there are three non-zero NLO coefficients. For d22 of compound I, the contribution from the VE is 64.1% and VH is 35.9% (Fig. 6). In the occupied states, the O(8)-2p orbitals are dominant in both VE and VH processes. While in unoccupied states, the O(6)-2p and O(8)-2p orbitals are main contributors in the VE process. The B(2)-2p and B(4)-2p orbitals play major roles in the VH process. Thus, the B–O groups have the important contribution on the SHG. For compound III, VE processes are the main contributions to the d22 SHG coefficients (Fig. 7). The analysis shows that the main contributions are BO3 groups and lead cations with stereochemically active lone pair.
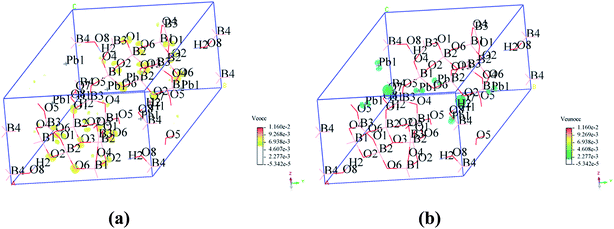 | ||
| Fig. 7 SHG-weighted electron densities of the occupied and unoccupied orbitals in the VE processes of compound III. (a) Occupied orbitals of VE process; (b) unoccupied orbitals of VE process. | ||
Conclusion
Combining alkaline earth metal with borate, new compounds, Ba3(OH)(B9O16)[B(OH)3] and Pb0.29Ba2.71(OH)(B9O16)[B(OH)3] have been synthesized by the hydrothermal method for the first time. Their structures feature a three-dimensional (3D) B9O19 framework with tunnels along c-direction, in which the Ba or Pb/Ba cations and [B(OH)3] groups dwell. Ba3(OH)(B9O16)[B(OH)3], Pb0.29Ba2.71(OH)(B9O16)[B(OH)3] and Pb3(OH)(B9O16)[B(OH)3] are type-I phase-matchable, with SHG responses 1.1, 1.2 and 2.7× KDP, respectively. The band gap of Ba3(OH)(B9O16)[B(OH)3] (5.11 eV) is larger than that of Pb3(OH)(B9O16)[B(OH)3] (4.65 eV). First-principle calculations reveal that the bottom of conduction band of Ba3(OH)(B9O16)[B(OH)3] is dominated by Ba-5d orbital, while, in Pb3(OH)(B9O16)[B(OH)3], the bottom of conduction band is dominated by Pb-6p orbital. The SHG response density shows that the B–O groups have the important contribution to SHG response in Ba3(OH)(B9O16)[B(OH)3]. While the BO3 groups and lead cations with stereochemically active lone pair have main contribution in Pb3(OH)(B9O16)[B(OH)3].Acknowledgements
This work is supported by the Western Light Foundation of CAS (Grant 2016-QNXZ-A-2), 973 Program of China (Grant No. 2014CB648400), the National Natural Science Foundation of China (Grant No. U1303392, 51425206), the Youth Innovation Promotion Association CAS (Grant 2015353).References
- (a) P. Becker, Adv. Mater., 1998, 10, 979 CrossRef CAS; (b) C. T. Chen, B. C. Wu, A. D. Jiang and G. M. You, Sci. Sin., Ser. B, 1985, 28, 235 Search PubMed; (c) M. E. Hagerman and K. R. Poeppelmeier, Chem. Mater., 1995, 7, 602 CrossRef CAS.
- (a) P. G. Schunemann, P. A. Budni and K. L. Schepler, Mater. Res. Bull., 1998, 23, 45 CrossRef CAS; (b) D. F. Eaton, Science, 1991, 253, 281 CAS.
- (a) Y. C. Wu, T. Sasaki, S. Nakai, A. Yokotani, H. Tang and C. T. Chen, Appl. Phys. Lett., 1993, 62, 2614 CrossRef CAS; (b) Y. Mori, I. Kuroda, S. Nakajima, T. Sasaki and S. Nakai, Appl. Phys. Lett., 1995, 67, 1818 CrossRef CAS; (c) L. Cheng, J. Cryst. Growth, 1991, 110, 697 CrossRef CAS; (d) A. O. Okorogu, S. B. Mirov, W. Lee, D. I. Crouthamel, N. Jenkins, A. Y. Dergachev, K. L. Vodopyanov and V. V. Badikov, Opt. Commun., 1998, 155, 307 CrossRef CAS; (e) G. D. Boyd, T. J. Bridges and C. K. N. Patel, Appl. Phys. Lett., 1972, 21, 553 CrossRef CAS; (f) H. S. Ra, K. M. Ok and P. S. Halasyamani, J. Am. Chem. Soc., 2003, 125, 7764 CrossRef CAS PubMed.
- (a) G. H. Zhou, Z. J. Ma, K. C. Wu and N. Ye, J. Mater. Chem., 2012, 22, 19911 RSC; (b) G. H. Zou, G. Nam, H. G. Kim, H. Jo, T. S. You and K. M. Ok, RSC Adv., 2015, 5, 84754 RSC; (c) H. W. Huang, J. Y. Yao, Z. S. Lin, X. Y. Wang, R. He, W. J. Yao, N. X. Zhai and C. T. Chen, Angew. Chem., 2011, 123, 10456 CrossRef; (d) Y. Z. Huang, L. M. Wu, X. T. Wu, L. H. Li, L. Chen and Y. F. Zhang, J. Am. Chem. Soc., 2010, 132, 12788 CrossRef CAS PubMed; (e) S. C. Wang, N. Ye, W. Li and D. Zhao, J. Am. Chem. Soc., 2010, 132, 8779 CrossRef CAS PubMed.
- (a) G. H. Zou, C. S. Lin, H. Jo, G. Nam, T. S. You and K. M. Ok, Angew. Chem., Int. Ed., 2016, 128, 12257 CrossRef; (b) K. Wu, Z. H. Yang and S. L. Pan, Angew. Chem., Int. Ed., 2016, 55, 6713 CrossRef CAS PubMed; (c) J. L. Song, C. L. Hu, X. Xu, F. Kong and J. G. Mao, Angew. Chem., Int. Ed., 2015, 54, 3679 CrossRef CAS PubMed; (d) Y. Wang and S. L. Pan, Coord. Chem. Rev., 2016, 323, 15 CrossRef CAS; (e) H. P. Wu, H. W. Yu, Z. H. Yang, X. L. Hou, S. L. Pan, X. Su, K. R. Poeppelmeier and J. M. Rondinelli, J. Am. Chem. Soc., 2013, 135, 4215 CrossRef CAS PubMed.
- (a) W. L. Zhang, W. D. Cheng, H. Zhang, L. Geng, C. S. Lin and Z. Z. He, J. Am. Chem. Soc., 2010, 132, 1508 CrossRef CAS PubMed; (b) H. W. Yu, S. L. Pan, H. P. Wu, W. W. Zhao, F. F. Zhang, H. Y. Li and Z. H. Yang, J. Mater. Chem., 2012, 22, 2105 RSC; (c) L. Wang, S. L. Pan, L. Chang, J. Hu and H. Yu, Inorg. Chem., 2012, 51, 1852 CrossRef CAS PubMed.
- (a) M. Wen, X. Su, H. P. Wu, J. J. Lu, Z. H. Yang and S. L. Pan, J. Phys. Chem. C, 2016, 120, 6190 CrossRef CAS; (b) F. F. Zhang, F. Y. Zhang, B. H. Lei, Z. H. Yang and S. L. Pan, J. Phys. Chem. C, 2016, 120, 12757 CrossRef CAS; (c) M. Wen, Z. P. Lian, H. P. Wu, X. Su, Q. F. Yan, J. J. Lu, Z. H. Yang and S. L. Pan, RSC Adv., 2015, 5, 53448 RSC.
- (a) X. Y. Dong, Q. Jing, Y. J. Shi, Z. H. Yang, S. L. Pan, K. R. Poeppelmeier, J. Young and J. M. Rondinelli, J. Am. Chem. Soc., 2015, 137, 9417 CrossRef CAS PubMed; (b) H. Y. Li, H. P. Wu, X. Su, H. W. Yu, S. L. Pan, Z. H. Yang, Y. Lu, J. Han and K. R. Poeppelmeier, J. Mater. Chem. C, 2014, 2, 1704 RSC.
- Z. H. Chen, S. L. Pan, Z. H. Yang, X. Y. Dong, X. Su and Y. Yang, J. Mater. Sci., 2013, 48, 2590 CrossRef CAS.
- E. L. Belokoneva, S. Y. Stefanovich, T. A. Borisova and O. V. Dimitrova, Russ. J. Inorg. Chem., 2001, 46, 1621 Search PubMed.
- SAINT, Version 7.60A, Bruker Analytical X-ray instruments, Inc., Madison, WI, 2008 Search PubMed.
- G. M. Sheldrick, SHELXTL-97 Sheldrick: Program for Crystal Structure Refinement, University of Gottingen, Germany, 1997 Search PubMed.
- A. L. Spek, J. Appl. Crystallogr., 2003, 36, 7 CrossRef CAS.
- L. Bohaty, Z. Kristallogr. Cryst. Mater., 1983, 164, 279 CAS.
- S. J. Clark, M. D. Segall, C. J. Pickard, P. J. Hasnip, M. J. Probert, K. Rrfson and M. C. Payne, Z. Kristallogr., 2005, 220, 567 CAS.
- J. P. Perdew, K. Burke and M. Ernzerhof, Phys. Rev. Lett., 1996, 77, 3865 CrossRef CAS PubMed.
- I. Varga, J. Pipek and B. Vasvári, Phys. Rev. B: Condens. Matter Mater. Phys., 1992, 46, 4978 CrossRef CAS.
- C. Aversa and J. E. Sipe, Phys. Rev. B: Condens. Matter Mater. Phys., 1995, 52, 14636 CrossRef CAS.
- J. Lin, M. H. Lee, Z. P. Liu, C. Chen and C. J. Pickard, Phys. Rev. B: Condens. Matter Mater. Phys., 1999, 60, 13380 CrossRef CAS.
- B. B. Zhang, Z. H. Yang, Y. Yang, M.-H. Lee, S. L. Pan, Q. Jing and X. Su, J. Mater. Chem. C, 2014, 2, 4133 RSC.
- X. Y. Zhang, D. N. Li, H. P. Wu, Z. H. Yang and S. L. Pan, RSC Adv., 2016, 6, 14205 RSC.
- F. Y. Zhang, Q. Jing, F. F. Zhang, S. L. Pan, Z. H. Yang, J. Han, M. Zhang and S. J. Han, J. Mater. Chem. C, 2014, 2, 667 RSC.
- (a) X. F. Wang, F. F. Zhang, B. H. Lei, Z. H. Yang and S. L. Pan, RSC Adv., 2016, 6, 100849 RSC; (b) G. Q. Shi, F. F. Zhang, B. B. Zhang, D. W. Hou, X. L. Chen, Z. H. Yang and S. L. Pan, Inorg. Chem., 2017, 56, 344 CrossRef CAS PubMed; (c) H. P. Wu, X. Su, S. J. Han, Z. H. Yang and S. L. Pan, Inorg. Chem., 2016, 55, 4806 CrossRef CAS PubMed.
- (a) Y. Yang, X. Su, S. L. Pan, M. Zhang, Y. Wang, J. Han and Z. H. Yang, CrystEngComm, 2014, 16, 1978 RSC; (b) E. L. Belokoneva, E. A. Ruchkina and O. V. Dimitrova, Russ. J. Inorg. Chem., 2001, 46, 20 Search PubMed.
- P. Kubelka and F. Munk, Z. Tech. Phys., 1931, 12, 593 Search PubMed.
- J. Tauc, Mater. Res. Bull., 1970, 5, 721 CrossRef CAS.
- M. K. Y. Chan and G. Ceder, Phys. Rev. Lett., 2010, 105, 196403 CrossRef CAS PubMed.
- J. P. Perdew and M. Levy, Phys. Rev. Lett., 1983, 51, 188 CrossRef.
- C. H. Lo, Master Degree Thesis, Tamkang University, 2005.
Footnotes |
| † Electronic supplementary information (ESI) available. CCDC 1540435–1540437. For ESI and crystallographic data in CIF or other electronic format see DOI: 10.1039/c7ra02027a |
| ‡ JJ and GQ contributed equally. |
| This journal is © The Royal Society of Chemistry 2017 |

