 Open Access Article
Improved lithium-ion and electrically conductive sulfur cathode for all-solid-state lithium–sulfur batteries
Cheng Zhang,
Yue Lin,
Yuewu Zhu,
Zhi Zhang and
Jin Liu *
*
School of Metallurgy and Environment, Central South University, Changsha, 410083, China. E-mail: jinliu@csu.edu.cn
First published on 31st March 2017
Abstract
The development of all-solid-state lithium–sulfur (Li–S) batteries is a promising way to solve the problems of sulfur dissolution and shuttling. Herein, a carbon matrix (GO–PEG) consisting of a lithium ion conductor (PEG) is synthesized by grafting PEG onto the surface of graphene oxide (GO) via an esterification reaction. Sulfur is in situ precipitated onto the surface of GO–PEG to form GO–PEG@C/S cathode materials in a one-pot reaction. The GO–PEG@C/S cathode materials show uniform distribution of sulfur nanoparticles on ionically and electrically conductive nanosheets. When the cathode is fabricated into an all-solid-state lithium–sulfur battery with a solid polymer electrolyte, the battery exhibits a high initial discharge capacity of 1225 mA h g−1 at 0.2C (80 °C) and good cycling stability with a capacity retention of 86.6% after 100 discharge–charge cycles at 2C and 80 °C. These results demonstrate that the introduction of a lithium ion conductor into the matrix skeleton of the sulfur cathode can enhance the comprehensive electrochemical properties of all-solid-state Li–S batteries.
1. Introduction
With the development of electrical vehicles and portable electronics, the demand for high energy density batteries is becoming more and more urgent. Lithium–sulfur (Li–S) batteries, with a high energy density of 2600 W h kg−1, are considered to be promising candidates to replace current lithium-ion batteries to meet this requirement.1,2 In addition, the abundance and environmental benignity of sulfur make Li–S batteries superior.However, the practical performances of Li–S batteries, such as coulombic efficiency and cycling stability, are limited due to the poor electrical conductivity of elemental sulfur and the high solubility of intermediate polysulfide products in the electrolyte, leading to the shuttle effect between the cathode and anode.3,4 To address these issues, various strategies have been employed, including modifying the cathode structure, optimizing the electrolyte using additives or applying a solid electrolyte.5–7 Graphene, carbon nanotubes, carbon fibers and various carbon materials with good electrical conductivity and outstanding frame structures have been especially suggested as matrix skeletons to improve the electrochemical performance of sulfur cathodes.8,9 Zhang et al. reported that nitrogen-doped graphene oxide–wrapped sulfur nanocomposite cathode materials and the corresponding Li–S batteries showed an ultra-long cycle life of up to 2000 cycles at 2C with a decay rate of 0.028% per cycle, in which the N functional groups played an important role in immobilizing polysulfides.10 Jayaprakash et al. reported porous hollow carbon–sulfur composites and the Li–S batteries with these cathodes showed a high capacity retention of 91% after 100 cycles.11
Although the use of carbon materials can improve the electrochemical performance of sulfur cathodes, the shuttle effect still exists. According to former research, basing Li–S batteries on a solid electrolyte (SE) instead of a liquid electrolyte can not only improve safety but also hamper the shuttling of polysulfides.12–18 In particular, all-solid-state Li–S batteries with solid polymer electrolytes (SPEs) possess high capacity and great flexibility, enabling the design and manufacture of practical energy storage devices and electric vehicles.14,19 In our previous work, sulfur was strongly locked into the cathode region by applying a macro-structural cathode and a SPE; consequently a stable capacity of 325 mA h g−1 after 1000 cycles at 4C and 80 °C was obtained.15 Nevertheless, one common vital drawback that exists for all-solid-state Li–S batteries is the poor electrode wettability of the SPE membrane due to the solid/solid interface, which easily leads to the incomplete reaction of the internal sulfur, causing severe polarization. Recently, Wang et al. reported a homogeneous nanocomposite electrode consisting of a Li2S active material and a Li6PS5Cl solid electrolyte in a nanoscale carbon matrix, which showed a large reversible capacity of 830 mA h g−1 (71% utilization of Li2S) at 50 mA g−1 for 60 cycles at a high loading of Li2S (∼3.6 mg cm−2).20
In this work, we develop a composite sulfur cathode that conducts electrons and lithium ions simultaneously for all-solid-state Li–S batteries. Graphene oxide (GO) is grafted with an electrolyte composition of polyethylene glycol (PEG) via an esterification reaction and acts as the structural framework. Sulfur and conductive carbon (super P) are then in situ precipitated onto the substrate surface. GO, with numerous highly reactive functional groups on the surface, can trap polysulfides during the discharge–charge process.21 The introduction of PEG with a good lithium ion conducting capability is beneficial for enhancing lithium ion diffusion in the cathode, and inhibiting the diffusion of polysulfides outside of the cathode. It can also effectively accommodate the volume change during the cycling process.22,23 Moreover, the uniform distribution of super P improves the electronic conductivity of the sulfur cathode. In addition, a metal–organic framework (MIL-53(Al))-modified SPE is used to prevent polysulfide dissolution and shuttling. The all-solid-state Li–S batteries based on the GO–PEG@C/S cathode exhibit excellent rate capability and cycling stability, and are superior to GO@C/S cathode materials due to the contribution of PEG.
2. Experimental section
2.1 Materials
Graphite flakes, phosphoric acid (H3PO4), potassium permanganate (KMnO4), concentrated sulfuric acid (H2SO4, 98%), methoxy polyethylene glycol (mPEG, Mw = 350), sodium thiosulfate (Na2S2O3, 98.5%), polyvinylpyrrolidone (PVP), sublimed sulfur (S, 99.95%), super P, hydrochloric acid (HCl, AR grade), polyethylene oxide (PEO, Mw = 4![[thin space (1/6-em)]](https://www.rsc.org/images/entities/char_2009.gif) 000
000![[thin space (1/6-em)]](https://www.rsc.org/images/entities/char_2009.gif) 000, 99.9%), and acetonitrile (CH3CN, AR grade) were obtained from Aladdin. Lithium bis(trifluoromethanesulfonyl)imide (LiTFSI, >99.5%) was purchased from Sigma-Aldrich and stored in a glove box filled with argon. N-Methyl-2-pyrrolidone (NMP, 99.5%) was purchased from Heowns.
000, 99.9%), and acetonitrile (CH3CN, AR grade) were obtained from Aladdin. Lithium bis(trifluoromethanesulfonyl)imide (LiTFSI, >99.5%) was purchased from Sigma-Aldrich and stored in a glove box filled with argon. N-Methyl-2-pyrrolidone (NMP, 99.5%) was purchased from Heowns.
2.2 Preparation of GO–PEG@C/S
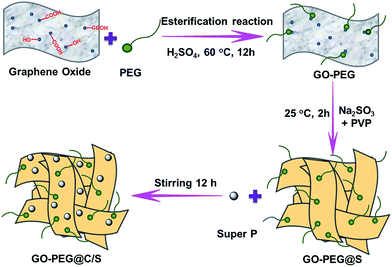
GO was prepared by oxidation of graphite flakes according to a modified Hummers' method.24 The GO–PEG was synthesized via an esterification reaction of carboxyl groups from GO and hydroxyl groups from mPEG. Typically, 0.1 g of GO was dispersed in 100 mL of deionized water to form a homogeneous GO suspension. Then, 0.5 mL of mPEG was added to the suspension under magnetic stirring. The temperature of the suspension was adjusted to 60 °C, and then 2 mL of concentrated sulfuric acid was added. The whole reaction was performed in an argon atmosphere and stirring was continued for 12 h. Subsequently, GO–PEG@S was synthesized via a facile one-pot reaction using sodium thiosulfate and hydrochloric acid. 2.38 g of Na2S2O3 and 0.1 g of PVP were added to the above-mentioned suspension and the mixture was stirred for 10 min. After that, 0.3 mL of concentrated HCl was added dropwise to the solution and stirred for 2 h. Finally, 0.1 g of super P was added and the solution was stirred for 12 h. The composite material, named GO–PEG@C/S, was collected by vacuum filtration and washed with water repeatedly. The final product was obtained by drying at 60 °C overnight. A schematic diagram of the preparation process is illustrated in Scheme 1. A GO@C/S composite was also prepared using the same method except for the absence of PEG.2.3 Preparation of the solid polymer electrolyte membrane
The preparation of the SPE thin film was carried out according to our previous report.25 PEO was thoroughly dried at 50 °C for 12 h, and LiTFSI was dried at 100 °C under vacuum for 24 h before use. LiTFSI, CH3CN, 0.0300 g of MIL-53(Al) and 0.3000 g of PEO were added to a beaker and stirred for 36 h. A homogenized colloidal solution of PEO–LiTFSI–MIL-53(Al)–CH3CN was formed. The solution was cast and dried at 80 °C for 24 h in an argon-filled gloved box to remove the solvent. Finally, a PEO–MIL-53(Al)–LiTFSI thin film electrolyte was formed with a thickness of about 60 μm.2.4 Material characterization
The morphology of the cathode material was observed by field-emission scanning electron microscopy (SEM, Nova SEM 230) and transmission electron microscopy (TEM, Tecnai G2 20ST). The elements on the surface of the sample were identified by scanning transmission electron microscopy (STEM, Tecnai G2 F20). Structural information on the reactants and products was obtained by Fourier transform infrared spectroscopy (FTIR, Bruker Tensor II). The thermal behaviour of the samples was characterized by thermogravimetric analysis (TGA, SDTQ600) under an argon atmosphere at a heating rate of 10 °C min−1 from 20 °C to 800 °C.2.5 Electrochemical measurements
The cathode was prepared by mixing the cathode materials (GO–PEG@C/S and GO@C/S), carbon black (super P) and binder (PAA) (70![[thin space (1/6-em)]](https://www.rsc.org/images/entities/char_2009.gif) :
:![[thin space (1/6-em)]](https://www.rsc.org/images/entities/char_2009.gif) 20
20![[thin space (1/6-em)]](https://www.rsc.org/images/entities/char_2009.gif) :
:![[thin space (1/6-em)]](https://www.rsc.org/images/entities/char_2009.gif) 10 by weight) in NMP to form a slurry, which was then coated onto aluminium foil using a doctor blade and dried at 50 °C for 24 h to remove the solvent. Cathode disks were then punched out to form 10 mm diameter (0.7854 cm2) electrodes with a 0.8 mg cm−2 average sulfur loading area. All-solid-state Li–S batteries were assembled by stacking the obtained cathode disks, an electrolyte membrane, lithium metal, and a nickel foam current collector in sequence in CR2025 coin-type cells. Galvanostatic discharge/charge tests were performed in the potential range of 1.7–2.8 V (versus Li+/Li) by using a LAND battery-testing instrument (Wuhan Land Electronic Co., Ltd. China). Cyclic voltammetry (CV) and electrochemical impedance spectroscopy (EIS) measurements were conducted using a PARSTAT 4000 electrochemical measurement system. CV tests were performed at a scan rate of 0.2 mV s−1 in the voltage range of 1.7–2.8 V. EIS measurements were carried out at open-circuit potential (OCP) in the frequency range between 100 kHz and 100 mHz with a perturbation amplitude of 5 mV. All measurements were performed in a temperature controlled oven with a standard deviation of 1 °C.
10 by weight) in NMP to form a slurry, which was then coated onto aluminium foil using a doctor blade and dried at 50 °C for 24 h to remove the solvent. Cathode disks were then punched out to form 10 mm diameter (0.7854 cm2) electrodes with a 0.8 mg cm−2 average sulfur loading area. All-solid-state Li–S batteries were assembled by stacking the obtained cathode disks, an electrolyte membrane, lithium metal, and a nickel foam current collector in sequence in CR2025 coin-type cells. Galvanostatic discharge/charge tests were performed in the potential range of 1.7–2.8 V (versus Li+/Li) by using a LAND battery-testing instrument (Wuhan Land Electronic Co., Ltd. China). Cyclic voltammetry (CV) and electrochemical impedance spectroscopy (EIS) measurements were conducted using a PARSTAT 4000 electrochemical measurement system. CV tests were performed at a scan rate of 0.2 mV s−1 in the voltage range of 1.7–2.8 V. EIS measurements were carried out at open-circuit potential (OCP) in the frequency range between 100 kHz and 100 mHz with a perturbation amplitude of 5 mV. All measurements were performed in a temperature controlled oven with a standard deviation of 1 °C.
3. Results and discussion
The SEM images of GO, GO–PEG and GO–PEG@C/S in Fig. 1 were used to observe the morphology evolution of the cathode materials during the reaction. It is found in Fig. 1a and b that the GO consists of homogeneous interconnected nanosheet units, proving the success of GO synthesis. The GO nanosheet framework also has some unblocked macropores. The open structure can provide a high specific surface area, which is beneficial for loading more sulfur and accommodating the volume changes of the electrode during cycling. After introducing PEG into GO, a transparent thin film appeared on the surface of GO, as shown in Fig. 1c and d. The PEG is well grafted onto the surface of GO.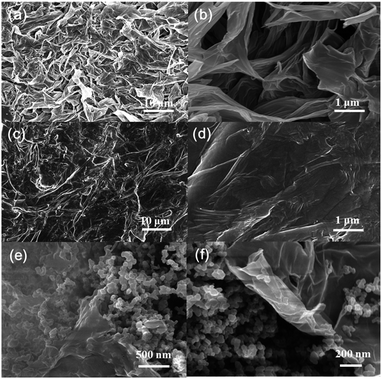 | ||
| Fig. 1 SEM images of GO with a scale bar of (a) 10 μm and (b) 1 μm, GO–PEG with a scale bar of (c) 10 μm and (d) 1 μm, and GO–PEG@C/S with a scale bar of (e) 500 nm and (f) 200 nm. | ||
Fig. 1e and f show the SEM images of GO–PEG@C/S at different scales. Particles with a diameter of 50–100 nm are distributed uniformly in the materials. This means that the sulfur and conductive carbon are well precipitated and dispersed in GO–PEG@C/S after the reaction. The uniform distribution of conductive carbon and sulfur ensures good contact between the active materials and the conductive agent, thus providing unblocked electronic and ionic transport channels in the electrode.
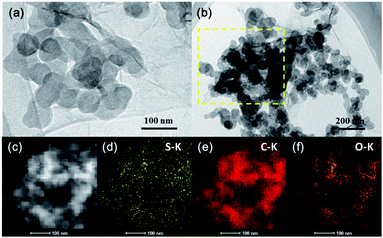
In addition, TEM images and elemental mapping of the GO–PEG@C/S cathode material are displayed in Fig. 2. As shown in Fig. 2a, the material appears as a stack of nanospheres with diameters of less than 100 nm on the nanosheets. The nanospheres are carbon and sulfur, and the nanosheets are GO and PEG. In order to measure the elemental distribution in GO–PEG@C/S, the square area in the yellow dotted frame in Fig. 2b (the HAADF-STEM image of this area is shown in Fig. 2c) was investigated and the results are present in Fig. 2d–f. It is shown that sulfur, carbon and oxygen elements are uniformly distributed in the material.
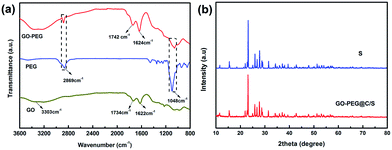
FTIR spectra of GO, PEG and GO–PEG are presented in Fig. 3a. The wide absorption peaks at 3303 cm−1 and 1734 cm−1 represent –OH and –C![[double bond, length as m-dash]](https://www.rsc.org/images/entities/char_e001.gif) O (–COOH) bond stretching vibrations of GO.24 The shift of the –C
O (–COOH) bond stretching vibrations of GO.24 The shift of the –C![[double bond, length as m-dash]](https://www.rsc.org/images/entities/char_e001.gif) O bond of GO from 1734 cm−1 to 1717 cm−1 after introducing PEG demonstrates that the –COOH bond probably changes to a –COOR bond. In addition, the –CH2 and C–O–C bond from PEG are detected in the FTIR spectra of GO–PEG at 2869 cm−1 and 1048 cm−1, respectively.26,27 These results confirm that PEG is indeed grafted onto GO. This indicates that the esterification reaction of the carboxyl groups in GO and the hydroxyl groups in PEG took place.
O bond of GO from 1734 cm−1 to 1717 cm−1 after introducing PEG demonstrates that the –COOH bond probably changes to a –COOR bond. In addition, the –CH2 and C–O–C bond from PEG are detected in the FTIR spectra of GO–PEG at 2869 cm−1 and 1048 cm−1, respectively.26,27 These results confirm that PEG is indeed grafted onto GO. This indicates that the esterification reaction of the carboxyl groups in GO and the hydroxyl groups in PEG took place.
Fig. 3b presents the XRD patterns of sublimed S and the GO–PEG@C/S composite. For the sulfur, the characteristic peaks at 23.5° and 28.0° match well with the (222) and (040) reflections of the Fddd orthorhombic structure (JCPSD no. 08-0247).28 GO–PEG@C/S displays a similar pattern to S, indicating that the sulfur products synthesized via a facile one-pot solution process belong to the Fddd orthorhombic crystal system and the process of loading sulfur onto the GO–PEG composite does not cause any structural changes.29
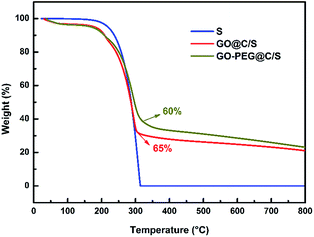
Thermogravimetric analysis (TGA) was performed to investigate the thermal behaviour of the pristine sulfur, GO@C/S and GO–PEG@C/S samples in an argon atmosphere at a heating rate of 10 °C min−1 from 20 to 800 °C, and the results are shown in Fig. 4. GO@C/S and GO–PEG@C/S experience a small amount of weight loss (about 3%) below 100 °C, which corresponds to the loss of absorbed water during the sample transfer process. From 200 to 320 °C, all of the samples exhibit rapid weight loss, which is caused by the loss of sulfur in the materials. From 320 to 800 °C, the weight loss of GO–PEG@C/S mainly comes from the decomposition of PEG. The sulfur content can be determined to be about 65 and 58 wt%, respectively, in the GO@C/S and GO–PEG@C/S materials.
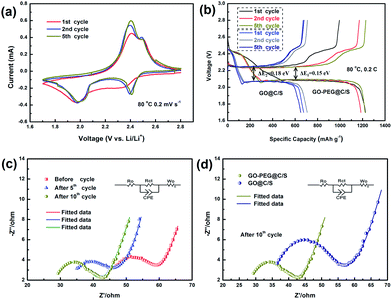
To identify the redox reaction properties of GO–PEG@C/S material-based all-solid-state Li–S batteries, cyclic voltammetry (CV) measurements were carried out in the voltage range of 1.7–2.8 V at a scan rate of 0.2 mV s−1 and the results are presented in Fig. 5a. During the first cathodic scan, two neat broad peaks are observed, indicating that the electrochemical reduction of sulfur occurs in two stages.30 The first peak at ∼2.35 V is assigned to a fast kinetic process, involving the open ring reduction of cyclic S8 to a long-chain lithium polysulfide (Li2Sn) (4 ≤ n ≤ 8), and the second peak at ∼2.05 V corresponds to the conversion of lithium polysulfides to low-order Li2S2 and eventually to Li2S.31 In the anodic scan, two oxidation peaks at ∼2.42 V and ∼2.5 V can be observed that are attributed to the conversion of Li2S to polysulfides then to elemental S.31 In the second and fifth cycles, both the reduction and oxidation peaks become well-defined and sharp, indicating the accelerated kinetics of the electrochemical reactions and the reduced polarization of the batteries.32
Fig. 5b presents the discharge–charge profiles of the GO–PEG@C/S and GO@C/S material-based all-solid-state Li–S batteries at 80 °C and 0.2C in the 1st, 2nd and 5th cycles. Compared to GO@C/S, the battery configured with the GO–PEG@C/S cathode shows a reduction in the voltage difference between the charge and discharge plateaus and a decrease in the polarization (ΔE) from 0.18 to 0.15 V due to the faster lithium ion transport in GO–PEG@C/S compared to GO@C/S. The near overlap of the discharge/charge plateaus implies a stable electrochemical performance. The discharge capacities of the GO–PEG@C/S-based Li–S battery in the 1st, 2nd and 5th cycles are 1215, 1184 and 1229 mA h g−1, respectively. These values are significantly higher than the capacities of 677, 707 and 650 mA h g−1 for the GO@C/S-based Li–S battery. These results illustrate that the introduction of PEG can improve the efficiency of lithium ion diffusion in the electrode and ensure efficient utilization of the active material.
In addition, Fig. 5c presents the EIS spectra for the GO–PEG@C/S cathode-based all-solid-state Li–S battery before cycling, and after 5 and 10 cycles. The EIS spectra consist of a semi-circle in the high frequency region, the diameter of which represents the charge-transfer resistance (Rct), and an inclined line in the low frequency region attributed to the mass-transfer process.33 The high-frequency intercept on the real axis is related to the bulk resistance (Rb) of the battery, including the electrolyte and electrode resistances.34,35 The EIS measurements demonstrate that both the bulk resistance and charge-transfer resistance decreased with an increasing number of cycles, which is mainly attributed to the interconnected penetration between the cathode and polymer electrolyte arising from the segmental mobility of the PEG from the cathode and the flexibility of PEO in the polymer electrolyte at 80 °C.13 Hence, PEG plays an important role in improving interfacial compatibility and lithium ion transport efficiency.
To further demonstrate the effects of PEG, the EIS spectra of the GO–PEG@C/S and GO@C/S material-based all-solid-state Li–S batteries after 10 cycles at 80 °C and 0.2C were compared, as shown in Fig. 5d. The Rb is 25.8 Ω and the Rct is 13.5 Ω for the GO–PEG@C/S-based all-solid-state Li–S battery, and these values are obviously lower than the Rb (32.2 Ω) and Rct (21.2 Ω) for the GO@C/S-based Li–S battery. It is evident that both the bulk resistance and charge-transfer resistance decreased when grafting PEG onto the surface of GO. The improved electrical and ionic conductivity mainly result from GO providing continuous electronic channels and PEG providing additional lithium ion pathways in the sulfur cathode.
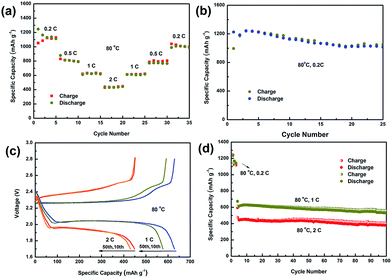
Fig. 6a displays the rate capability of the GO–PEG@C/S-based all-solid-state Li–S battery at different current densities from 0.2C to 2C. The battery delivered a reversible discharge capacity of 1247, 879, 611 and 441 mA h g−1 at 0.2, 0.5, 1, and 2C, respectively. When the rate returns to 0.2C, a reversible capacity of 990 mA h g−1 is achieved, indicating the good rate performance and high stability of the GO–PEG@C/S material.
Fig. 6b shows the cycling performance of the GO–PEG@C/S-based all-solid-state Li–S battery at 80 °C and at 0.2C. The initial discharge and charge capacities are 1225 mA h g−1 and 994 mA h g−1 respectively, and reversible maximum discharge and charge capacities of 1243 mA h g−1 and 1238 mA h g−1 are obtained after two activation cycles. After 25 cycles, the battery still retains a high discharge capacity of 1015 mA h g−1 and a high coulombic efficiency of 97%. The capacity at 0.2C is much higher than that of similar cathode materials based on graphene–sulfur with PEG, which have shown capacities of about 600–800 mA h g−1 at a current rate of 0.1–0.2C.22,36 In addition, the quick capacity drop in the first few cycles for the reported similar cathodes disappears for GO–PEG@C/S, which may be a reason for the enhanced cycling performance.
The fast discharge–charge ability of the GO–PEG@C/S material-based all-solid-state Li–S battery was also investigated. Fig. 6c shows the discharge–charge curves at 80 °C and at 1C or 2C. Two typical discharge plateaus appear at 1 and 2C, corresponding to the two-step reaction of sulfur with lithium. The similarity of the discharge–charge profiles in the 10th and 50th cycles at a current density of 1C and 2C indicates the excellent electrochemical stability of the batteries. The high-rate cycle performances of the GO–PEG@C/S material-based all-solid-state Li–S batteries at 1 and 2C and at 80 °C were measured, as shown in Fig. 6d. Both of the batteries were tested after a three-cycle activation process at a low rate of 0.2C and at 80 °C. Reversible discharge capacities of 613 mA h g−1 and 444 mA h g−1 are obtained at 1 and 2C after 5 cycles. After 100 cycles, GO–PEG@C/S still maintains high discharge capacities of 531 mA h g−1 at 1C and 380 mA h g−1 at 2C with a capacity retention of 86.6% and 85.6%, respectively. The good rate capability and cycling stability reveal that GO–PEG@C/S plays an important role in improving the electrode activity and assisting the solid electrolyte in blocking polysulfide dissolution.
4. Conclusions
Highly stable GO–PEG@C/S materials have been developed by employing a GO–PEG structural matrix and an esterification reaction. PEG, which is capable of conducting lithium ions, is introduced into the sulfur composite cathode materials to ensure complete electrochemical reaction. In addition, GO with numerous highly reactive functional groups and a three-dimensional network can hold sulfur and trap polysulfides during the discharge–charge process. With the synthesized cathode, the all-solid-state Li–S batteries deliver an initial discharge capacity of 1225 mA h g−1 at 80 °C and 0.2C. After 100 cycles at 80 °C and 1C or 2C, discharge capacities of 531 and 380 mA h g−1 are retained, respectively. The results demonstrate that introducing both lithium ion and electronic conducting agents into sulfur cathode materials is an effective strategy to enhance the electrochemical properties of all-solid-state Li–S batteries.Acknowledgements
This work was supported by the National Natural Science Foundation of China (No. 51274239), the Chinese Academy of Engineering (2016-XY-18), grants from the Project of Innovation-driven Plan in Central South University and the Fundamental Research Funds from the Central Universities for Central South University (No. 2015zzts190).Notes and references
- A. Manthiram, Y. Fu and Y.-S. Su, Acc. Chem. Res., 2013, 46, 1125–1134 CrossRef CAS PubMed.
- A. Manthiram, Y. Fu, S. H. Chung, C. Zu and Y. S. Su, Chem. Rev., 2014, 114, 11751–11787 CrossRef CAS PubMed.
- D. Bresser, S. Passerini and B. Scrosati, Chem. Commun., 2013, 49, 10545–10562 RSC.
- M. Wild, L. O'Neill, T. Zhang, R. Purkayastha, G. Minton, M. Marinescu and G. J. Offer, Energy Environ. Sci., 2015, 8, 3477–3494 CAS.
- X. Fang and H. Peng, Small, 2015, 11, 1488–1511 CrossRef CAS PubMed.
- Q. Pang, X. Liang, C. Y. Kwok and L. F. Nazar, Nat. Energy, 2016, 1, 16132 CrossRef CAS.
- Y.-L. Ding, P. Kopold, K. Hahn, P. A. van Aken, J. Maier and Y. Yu, Adv. Funct. Mater., 2016, 26, 1112–1119 CrossRef CAS.
- Y. Ma, H. Zhang, B. Wu, M. Wang, X. Li and H. Zhang, Sci. Rep., 2015, 5, 14949 CrossRef CAS PubMed.
- D.-W. Wang, Q. Zeng, G. Zhou, L. Yin, F. Li, H.-M. Cheng, I. R. Gentle and G. Q. M. Lu, J. Mater. Chem. A, 2013, 1, 9382 CAS.
- Y. Qiu, W. Li, W. Zhao, G. Li, Y. Hou, M. Liu, L. Zhou, F. Ye, H. Li, Z. Wei, S. Yang, W. Duan, Y. Ye, J. Guo and Y. Zhang, Nano Lett., 2014, 14, 4821–4827 CrossRef CAS PubMed.
- N. Jayaprakash, J. Shen, S. S. Moganty, A. Corona and L. A. Archer, Angew. Chem., Int. Ed., 2011, 50, 5904–5908 CrossRef CAS PubMed.
- Z. Lin and C. Liang, J. Mater. Chem. A, 2015, 3, 936–958 CAS.
- X. Liang, Z. Wen, Y. Liu, H. Zhang, L. Huang and J. Jin, J. Power Sources, 2011, 196, 3655–3658 CrossRef CAS.
- J. Hassoun and B. Scrosati, Adv. Mater., 2010, 22, 5198–5201 CrossRef CAS PubMed.
- C. Zhang, Y. Lin and J. Liu, J. Mater. Chem. A, 2015, 3, 10760–10766 CAS.
- Y. Li, B. Xu, H. Xu, H. Duan, X. Lu, S. Xin, W. Zhou, L. Xue, G. Fu, A. Manthiram and J. B. Goodenough, Angew. Chem., Int. Ed., 2017, 56, 753–756 CrossRef CAS PubMed.
- H. Nagata and Y. Chikusa, J. Power Sources, 2016, 329, 268–272 CrossRef CAS.
- S. Das, P. Ngene, P. Norby, T. Vegge, P. E. de Jongh and D. Blanchard, J. Electrochem. Soc., 2016, 163, A2029–A2034 CrossRef CAS.
- G. Zhou, F. Li and H.-M. Cheng, Energy Environ. Sci., 2014, 7, 1307–1338 CAS.
- F. Han, J. Yue, X. Fan, T. Gao, C. Luo, Z. Ma, L. Suo and C. Wang, Nano Lett., 2016, 16, 4521–4527 CrossRef CAS PubMed.
- J.-Q. Huang, T.-Z. Zhuang, Q. Zhang, H.-J. Peng, C.-M. Chen and F. Wei, ACS Nano, 2015, 9, 3002–3011 CrossRef CAS PubMed.
- H. Wang, Y. Yang, Y. Liang, J. T. Robinson, Y. Li, A. Jackson, Y. Cui and H. Dai, Nano Lett., 2011, 11, 2644–2647 CrossRef CAS PubMed.
- L.-X. Miao, W.-K. Wang, A.-B. Wang, K.-G. Yuan and Y.-S. Yang, J. Mater. Chem. A, 2013, 1, 11659 CAS.
- D. C. Marcano, D. V. Kosynkin, J. M. Berlin, A. Sinitskii, Z. Sun, A. Slesarev, L. B. Alemany, W. Lu and J. M. Tour, ACS Nano, 2010, 4, 4806–4814 CrossRef CAS PubMed.
- K. Zhu, Y. Liu and J. Liu, RSC Adv., 2014, 4, 42278–42284 RSC.
- S. Ünügür Çelik and A. Bozkurt, Curr. Appl. Phys., 2013, 13, 1668–1673 CrossRef.
- P. Y. Pennarun, P. Jannasch, S. Papaefthimiou, N. Skarpentzos and P. Yianoulis, Thin Solid Films, 2006, 514, 258–266 CrossRef CAS.
- J.-W. Choi, J.-K. Kim, G. Cheruvally, J.-H. Ahn, H.-J. Ahn and K.-W. Kim, Electrochim. Acta, 2007, 52, 2075–2082 CrossRef CAS.
- X. Liang, Z. Wen, Y. Liu, H. Zhang, J. Jin, M. Wu and X. Wu, J. Power Sources, 2012, 206, 409–413 CrossRef CAS.
- L. F. Nazar, M. Cuisinier and Q. Pang, MRS Bull., 2014, 39, 436–442 CrossRef CAS.
- Y. X. Yin, S. Xin, Y. G. Guo and L. J. Wan, Angew. Chem., Int. Ed., 2013, 52, 13186–13200 CrossRef CAS PubMed.
- M. Liu, D. Zhou, Y.-B. He, Y. Fu, X. Qin, C. Miao, H. Du, B. Li, Q.-H. Yang, Z. Lin, T. S. Zhao and F. Kang, Nano Energy, 2016, 22, 278–289 CrossRef CAS.
- Y.-J. Choi, Y.-D. Chung, C.-Y. Baek, K.-W. Kim, H.-J. Ahn and J.-H. Ahn, J. Power Sources, 2008, 184, 548–552 CrossRef CAS.
- X. Gao, J. Li, D. Guan and C. Yuan, ACS Appl. Mater. Interfaces, 2014, 6, 4154–4159 CAS.
- Z. Zhang, Q. Li, Y. Lai and J. Li, J. Phys. Chem. C, 2014, 118, 13369–13376 CAS.
- L. Lu, L. Lu and Y. Wang, J. Mater. Chem. A, 2013, 1, 9173–9181 CAS.
| This journal is © The Royal Society of Chemistry 2017 |

