 Open Access Article
Gold–tin co-sensitized ZnO layered porous nanocrystals: enhanced responses and anti-humidity
Ming-Shui Yaoab,
Lin-An Caob,
Guo-Lin Houa,
Min-Lan Caib,
Jing-Wei Xiub,
Chen-Hao Fangb,
Fang-Li Yuan *a and
Yun-Fa Chena
aState Key Laboratory of Multi-Phase Complex Systems, Institute of Process Engineering, Chinese Academy of Sciences, Zhongguancun Beiertiao 1 Hao, Beijing, 100190, P. R. China. E-mail: flyuan@ipe.ac.cn
bState Key Laboratory of Structural Chemistry, Fujian Institute of Research on the Structure of Matter, Chinese Academy of Sciences, Fuzhou, 350002, P. R.China
First published on 7th April 2017
Abstract
High responses and good selectivity are key sensing properties of metal oxide (MOX) gas sensors. However, it is still a major challenge for a single MOX gas sensor to achieve both of them. Specially, the research in the field of high performance gas sensors has been hindered by negative effects of the typical interference, relative humidity (RH). In this paper, we report the successful preparation of gold–tin co-sensitized ZnO layered porous nanocrystals (Au–5Sn–ZLPCs) via a sequential solvothermal reaction and deposition-reduction method. Based on Sn dopants sensitized ZLPCs, the introduction of Au decoration can act as a secondary sensitized element on the crystal surfaces of ZnO. The special synergy between noble metals and oxides can introduce additional catalytic effects to further improve sensing properties. As a result of Au–Sn co-sensitization, sensing properties of sensors towards reducing VOC gas were significantly enhanced, while those towards oxidizing ozone gas were different to each other. Besides the typical sensing properties including responses, operating temperature, response & recovery properties, etc., Au–Sn co-sensitized samples significantly reduced negative effects of RH on responses to both reducing and oxidizing gases (good anti-humidity).
1. Introduction
Metal oxide (MOX) semiconductors, such as ZnO, SnO2, In2O3, TiO2 and WO3, are the primary materials for chemiresistor gas sensors due to their low cost, portability, real-time operability and ease of use.1–4 Together with nanotechnology, they help people to see invisible things via nano-structured/modified MOX sensors acting as the nose to detect analytic gases including toxic volatile organic compounds (VOCs) and ozone gas.5 Since good repeatability, long-term stability and fast response & recovery are easy targets for chemiresistor MOX sensors to achieve; high responses and good selectivity have been deeply studied as the key sensing properties. However, it is still a major challenge for a single MOX gas sensor to achieve both of them. Specially, the research in the field of high performance gas sensors has been hindered by negative effects of the typical interference, relative humidity (RH).6–12To find a suitable solution, numerous hierarchical structures with enhanced gas diffusion properties (utility factor13) have been introduced to MOX sensors in the past few years, including nanowires assembled polyhedrons or films,14,15 single/multi-shell hollow porous spheres,16–18 complicated structures based on precursors (e.g. layered salts, metal organic frameworks (MOFs)),19–21 nanotube arrays,22 etc. MOX nanocrystals with controlled crystal surfaces were also synthesized to improve the surface reaction between target gas molecules and surface absorbed oxygen ions.23–25 To further improve sensing properties (e.g. responses, selectivity, operating temperature, response & recovery), the crystal surfaces of MOX sensing materials were modified (receptor function13). Among those excellent works, heterostructural nanostructures (p–p, n–n, or p–n junctions),3,6,26–29 lattice substituting doping,30–33 and noble metal decoration8,10,33–35 were proved to be ideal methods.
In our previous work, Sn doped ZnO layered porous nanocrystals (Sn–ZLPC) with enhanced gas diffusion and modified crystal surfaces were found to significantly improve sensing properties to VOCs gases compared with bare ZnO gas sensors.36 However, sensing properties of Sn–ZLPCs for benzene gas are still out of the reach of an ideal gas sensor with high responses and low energy consumption. Moreover, effects of the typical interference of MOX gas sensor, relative humidity (RH), should be taken into account for practical application including reliable breath analysis, indoor detection, wearable devices, etc.6–11 Based on Sn dopants sensitized ZLPCs, the introduction of noble metal decoration can act as a secondary sensitized element on the crystal surfaces of ZnO. The special synergy between noble metals and oxides can introduce additional catalytic effects to further improve sensing properties, which might be the ideal candidate to address issues mentioned above.
In this paper, we demonstrate the synthesis and applications of Au–Sn co-sensitized ZnO layered porous nanocrystals (Au–Sn–ZLPCs). The synthesized Au–Sn–ZLPCs performed excellent sensing properties to VOCs and ozone due to the combination of catalytic effects of Au–Sn, modified crystal surfaces and the mesoporous hierarchical structure. Specially, high responses, low operating temperature, and good anti-humidity (free of the RH interference) can be realized.
2. Materials and methods
2.1 Synthesis of Sn doped ZnO layered porous nanocrystal (Sn–ZLPC)
The synthesis of 5.0 at% Sn–ZLPC can be found in our previous work.36 Briefly, 1.000 g ZnAc2·2H2O and 0.052 g SnCl2·2H2O were added to 10 mL de-ionized water under stirring. Then 60 mL glycerol was added slowly to the mixture under vigorous stirring. 30 min later, the resulting solution was transferred to a Teflon-lined 100 mL stainless steel autoclave and maintained at 200 °C for 8 h before cooling down to room temperature. After that, the particles were collected from the bottom of the reactor and washed three times with de-ionized water and twice with ethanol by re-dispersion and centrifugation (4500 rpm for 10 min each time). The solid materials were then dried in air at 60 °C for 12 h.2.2 Synthesis of Au decorated Sn–ZLPC
Before Au decoration, Sn–ZLPC was heated at 500 °C for 2 h and then 400 °C for 20 h. After calcination, 0.1 g 5.0 at% Sn–ZLPC was added to 40 mL aqueous solution containing equal-molar HAuCl4 and sodium citrate (0.25 mM for Au–5Sn–ZLPC-1, and 2.5 mM for Au–5Sn–ZLPC-2) under stirring. Then 0.63 mL 0.50 M NaBH4 aqueous solution was added to it under stirring. After 30 min, the particles were collected from the bottom of the reactor and washed three times with de-ionized water and twice with ethanol by re-dispersion and centrifugation. The solid materials were then dried in air at 60 °C for 12 h.2.3 Materials characterization
The phase and crystal structure of the product were determined by X-ray diffraction (XRD) patterns, which were recorded with a Philips X'Pert PRO MPD X-ray diffractometer using Cu Kα radiation (λ = 1.54178 Å). The morphology and structure of the product were then observed by scanning electron microscope (SEM, JEOL JSM-6700F) and transmission electron microscope (TEM, JEOL JEM-2100). The thermal behavior of Sn–ZLPC was examined by thermogravimetry-differential thermal analysis (TG-DTA) with a NETZSCH STA 449C analyzer using a heating rate of 5 °C min−1 in flowing air ambient (60 sccm). The surface chemical analysis was investigated by X-ray photoelectron spectroscopy (XPS) on a Thermo Scientific ESCALAB 250 Xi XPS system, where the analysis chamber was 1.5 × 10⁻⁹ mbar and the size of X-ray spot was 500 μm.2.4 Fabrication of gas sensor prototype and sensor characterization
The fabrication of gas sensor prototypes and the sensor characterization were reported in our previous works.19,25 Bare 5Sn–ZLPC was heated at 500 °C for 2 h and then 400 °C for 20 h before sensor fabrication. The solution containing sensing material and ethanol was drop-coated onto the Al2O3 substrate with two electrodes wires on both ends. Preheating at 550 °C for 60 min before the achievement of stable process (400 °C for 20 h) was needed to ensure good ohmic contact. VOC gas was introduced into the quartz tube by mixing the certified gas “mixtures” and dry air in the proper ratio controlled by the mass flow controllers.37 Ozone gas was generated by a home-made instrument irradiated by an UV-light as showed in Fig. 1 and the corresponding description. The constant flow was 600 mL min−1. The bias on the sensor was 10 V, and the current was recorded using Keithley 2601 Sourcemeter. The response to VOCs was defined as the ratio of sensor resistance in air and in detected gas (Rair/Rgas − 1). The response to ozone was defined as the ratio of sensor resistance in air and in detected gas (Rgas/Rair − 1). The response/recovery time is defined as the time required for the resistance of the sensor to change to 90%/10% of the saturation value after exposure to the test gas/air.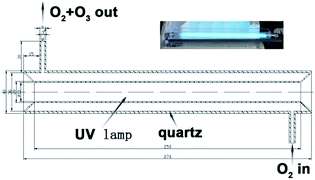 | ||
| Fig. 1 Schematic diagram (the cross-sectional view) of the experimental set-up used to produce ozone gas (the inset is a digital photograph of the experimental set-up). | ||
High purity oxygen was irradiated by an 8 W UV light (186 nm) to obtain a mixture of O2 and O3. By mixing it with high purity oxygen and high purity nitrogen, synthetic air (79% N2 and 21% O2) with different concentrations of ozone can be obtained (0.09 to 1.07 ppm for UV light coated by layer of Teflon film with a thickness of 0.1 mm, and 2 to 16 ppm for bare UV light).
3. Results and discussion
3.1 Materials preparation and characterization
XRD patterns of 5 at% Sn-doped ZnO powders are presented in Fig. 2(a). These patterns correspond to three main diffraction peaks of hexagonal wurtzite ZnO (JCPDS 01-089-0510), namely (100), (002) and (101).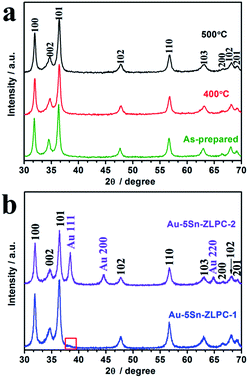 | ||
| Fig. 2 XRD patterns of 5 at% Sn–ZLPC (a) treated at different temperature and (b) decorated with different amounts of Au nanocrystals. | ||
The intensities of diffraction peaks in the PXRD of 5Sn–ZLPC are rarely affected at high temperature, indicating that the crystalline nature of the material retains at high temperature. In addition, no new peaks of a secondary phase were observed on all of the samples. As discussed in our previous work,36 5 at% of Sn doping slightly shifts the position of (002) peaks from 36.311° (pure ZnO) to higher diffraction angles (36.361°), which due to its smaller radius. It is also an evidence for the successful substitution of Sn into the ZnO lattice.
Fig. 2(b) shows typical mixed patterns of ZnO and Au (JCPDS 00-004-0784) for samples decorated with different amounts of Au nanocrystals. The diffraction peaks located at 38.4° and 64.8° were indexed to be Au (111) and Au (220), respectively.
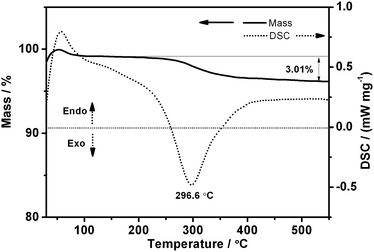
For better understanding of the effects of heating, as-prepared 5Sn–ZLPC was examined by TG-DTA (Fig. 3). The small and wide endothermic peak with gradual mass loss from 70 to 100 °C were ascribed to the release of water molecules adsorbed in the pores and on the surface of 5Sn–ZLPC. A further mass loss in the temperature range 245–360 °C corresponded to release of residual organics. The mass loss was nearly complete at 360 °C, and we assigned the exothermic peak (296.6 °C) near this temperature to the combustion of residual organics (the total mass loss, 3.01%). Together with combustion of residual organics based on the TG-DTA results, slightly broader peaks than as-prepared sample observed for calcinated samples might be attributed to collapse of some large nanocrystals in the layered structure. Therefore, the heating procedure used for 5Sn–ZLPC can both remove residual organics and keep good crystallinity, which is beneficial for the uniform loading of Au nanocrystals.
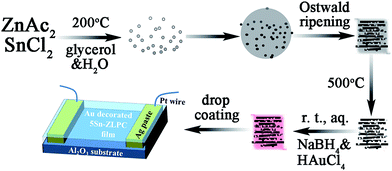
As discussed in our previous work,36 Sn4+ doped ZnO layered nanocrystals with mesoporous hierarchical structure were formed under the effects of Ostwald ripening, together with the etching effects of halogen ions (Fig. 4). The previous structural analysis based on SEM, TEM and BET results showed that each particle was constructed by multi-layers of ZnO nanosheet (thickness, 10–20 nm), and each of such nano-sheets are constructed by and nanocrystals and nanopores (mainly of less than 10 nm).
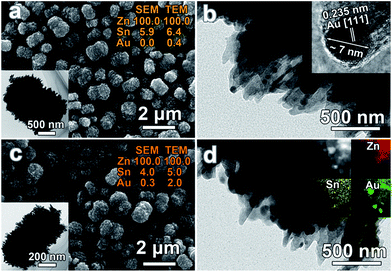
After the removal of residual organics via calcination, Au nanocrystals were deposited onto the surface of 5Sn–ZLPC via the reduction of HAuCl4 in aqueous solution. SEM and TEM images of samples loaded with different amounts of Au nanocrystals can be seen in Fig. 5. It can be seen that the morphology of 5Sn–ZLPC is maintained after Au decoration because of the mild reaction conditions and uniformly dispersed Au nanocrystals. Au elements can be observed via EDS results. The existence of Au nanocrystals can be confirmed by its light red color, TEM EDS results (Au/Sn/Zn 0.4/6.4/100), and HRTEM images (Fig. 5(a) and (b)). Au/Sn/Zn of Au–5Sn–ZLPC-2 was calculated to be 0.3/4.0/100 and 2.0/5.0/100 for SEM and TEM EDS results (Fig. 5(c)), respectively. HRTEM image and EDS mapping images of Au–5Sn–ZLPC-2 clearly show the successfully deposition of Au nanocrystals on Sn–ZLPC (Fig. 5(d)).
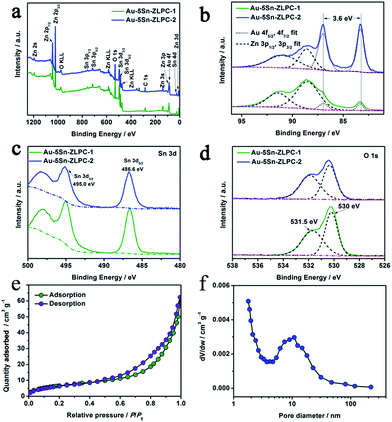
The surface/near-surface chemical composition of Au–5Sn–ZLPC was examined by X-ray photoelectron spectroscopy (XPS). The full-range XPS spectra (Fig. 6(a)) reveals that it is mainly composed of Zn, Au, Sn, O and C elements, of which C contamination can be mainly attributed to the residual solvents.
More detailed information on the chemical state of these elements can be obtained from the high resolution XPS spectra of the Au 4f, Sn 3d and O 1s. Fitting the Au 4f spectrum (Fig. 6(b)) shows gold nanoparticles to be in a single metallic state.38,39
The peaks of Sn 3d3/2 and Sn 3d5/2 at 495.0 and 486.6 eV (Fig. 6(c)) can be assigned to the lattice tin (Sn(IV) oxidation state) in tin oxide,40–42 which is consistent with bare 5Sn–ZLPC.36 The O 1s peaks are much asymmetric. The strong peaks of non-lattice oxygen at high BE (531.5 eV) in Fig. 6(d) indicate that there are large amounts of absorbed oxygen ions on the surface of the crystal, which facilitates the gas sensing reactions. Calculated from the quantified peak area, the atomic ratio of Au/Sn/Zn was estimated to be 0/25.2/100, 7.8/19.6/100, and 22.5/20.1/100 for bare 5Sn–ZLPC, Au–5Sn–ZLPC-1 and Au–5Sn–ZLPC-2, which is much higher than that estimated by EDS. High amount of Sn on the surface is mainly due to Sn tends to demix from the ZnO lattice because of its tendency for octahedral coordination.36 High amount of Au can be attributed to Au nanocrystals dispersed on the surface of 5Sn–ZLPC.
The nitrogen adsorption–desorption isotherm in Fig. 6(e) exhibits type IV isotherms with type H3 hysteresis loops. According to the BJH pore size distribution curve calculated from the adsorption isotherm (Fig. 6(f)), pore diameter of Au–5Sn–ZLPC-2 mainly centered at 10 nm. The BET surface area was calculated to be 25.42 m2 g−1. The meso-pore and the BET surface area can be attributed to co-effects of the mesoporous structure of 5Sn–ZLPC and deposition of Au nanocrystals. The mesoporous hierarchical structure might be beneficial to the diffusion of acetone molecules.
It should be noted that Au nanoparticles formed on the surfaces of 5Sn–ZLPC and in solution can be effectively separated by setting the centrifugation speed to 4500 rpm for 10 min each time. After 3–5 circles, Au decorated 5Sn–ZLPC can be obtained at the bottom of the tube.
3.2 Sensing properties
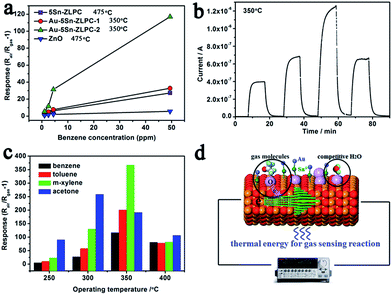
Gas sensing processes can be divided into three units, namely, gas diffusion/molecule capture (utility factor and some case of receptor function), surface reaction (receptor function), and electron transport (transducer function).13,19 Surface reaction unit is important for high sensing properties due to its contribution in utility factor. Noble metal decoration (Pt, Pd, Au, etc.) is an effective way to modify the sensing surface by enhancing the surface reaction due to its catalytic effect (high response) and the additional depletion layer (high resistance).34,43–45The typical response–recovery current line to VOCs with different concentration can be found in Fig. 7(b), which shows good response–recovery properties of the sample. Table 1 shows that response and recovery properties are significantly improved by the catalytic effects of Au loading on the gas sensing reaction. Co-sensitization of gold and tin can reduced the operating temperature, enhanced the responses and improved the response–recovery properties. Sn doping contributes to low activation energy, effective surface reaction based on adsorbed oxygen ions, and the mesoporous hierarchical structure. Au decoration further enhance the effective surface reaction via catalytic effect and the additional depletion layer, which is fully discussed by many works34,43–45 and confirmed by results mentioned above.
| Sample | Response time/min | Recovery time/min |
|---|---|---|
| 5Sn–ZLPC | 3.12 | 9.08 |
| Au–5Sn–ZLPC-1 | 3.10 | 4.48 |
| Au–5Sn–ZLPC-2 | 2.49 | 2.61 |
The temperature-dependent responses to four types of VOCs are shown in Fig. 7(c) to illustrate the relationships of the stability of target gas, operating temperature and the decoration of Au. As different thermal energies are needed to stimulate the oxidation/reduction of target gases, VOCs shows different optimal operating temperatures. As the stability of target gas increases (the ability of a gas molecule to be decomposed by adsorbed oxygen in gas sensing reactions, more difficult, more stable), the optimal operating temperature shifts from 300 °C (acetone) to 350 °C (benzene, toluene and m-xylene, Fig. 7(c)). For bare 5Sn–ZLPC, the gas with higher stability needs a higher thermal energy to reach its maximum response (e.g. benzene, 475 °C). It is known that the desorption of oxygen ions from the surface of the MOX at higher operating temperatures resulted in the reduced response.46 The metal catalyst contributed to tune the binding energies of different adsorbates,47,48 and thus shift the maximum response temperature and improve the response. Therefore, lower operating temperature (the adsorption rather than desorption of oxygen ions), together with the catalytic effects and additional depletion layer contribute to high response of Au–Sn co-sensitized ZLPCs (Fig. 7(d)). In addition, the responses of Au–5Sn–ZLPC-2 are comparable to other benzene sensors reported and significantly higher than the sample without noble metal decoration (Table 2).
| Materials | Size/nm | Benzene/ppm | R − 1 | Topta/°C | Ref. |
|---|---|---|---|---|---|
| a Topt means optimal operating temperature.b Hier. means hierarchical structure. | |||||
| SnO2 nanowire | 80 ± 5 | 50 | 0.6 | 290 | 50 |
| ZnO nanorod array | ∼8 | 50 | 9 | 370 | 51 |
| ZnO nanosheets | Hier.b | 100 | 1 | 420 | 52 |
| 5.0 at% Sn–ZLPC | Hier. | 49.4 | 27.4 | 475 | 36 |
| Au–In2O3 nanorod | 15–50 | 10 | 11.5 | 300 | 29 |
| Pt–WO3 nanoparticle | 150 | 100 | 9.5 | 250 | 53 |
| Au–Cr–WO3 octahedra | 100 | 49.8 | ∼70 | 375 | 31 |
| Pt–SnO2 | 20–40 | 0.1 | ∼5 | 400 | 54 |
| Pt–ZnO flower | Hier. | 44.1 | ∼75 | 350 | 55 |
| Au–5Sn–ZLPC | Hier. | 49.4 | 117.1 | 350 | This work |
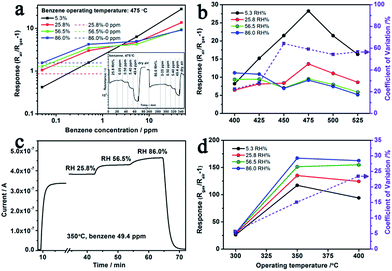
As a typical interference of MOX gas sensor for VOC detecting, the competitive adsorption of water vapour significantly affects the sensing results (Fig. 7(d)).8,49 More specifically, when n-type ZnO based sensing materials are exposed to VOC gas under humid atmosphere, both the water vapor and the VOC gas react with the negatively charged adsorbed oxygen and release electrons back to the semiconductor. We chose Au–5Sn–ZLPC-2 for detailed anti-humidity gas sensing measurements due to its overall good responses to benzene (high toxicity, extensive application and harmfulness even at ppb level), which is the most stable and thus the most difficult gas to be detected in this work. Due to low responses of pure ZnO, the anti-humidity property was not studied in this work. Firstly, anti-humidity properties of 5Sn–ZLPC were studied. As shown in Fig. 8(a), humidity significantly affected the responses to benzene because of the competitive adsorption of water and benzene gas molecules on the crystal surfaces. The adsorption of water molecules reduced the amounts of oxygen ions,6–8 and thus released electrons back to ZnO, which can be confirmed by significant responses (dash line in Fig. 8(a)) and resistance decrease to pure humidity. Affected by the competitive adsorption of water molecules, higher responses at lower concentration (sub-ppm level) and lower responses at higher concentration (ppm level) can be observed, which will induce unreliable results. RH induced unreliable results exist in a wide range from 400 to 525 °C, which can be indicated by comparison of temperature-dependent responses to 49.4 ppm benzene with different RH (Fig. 8(b)).
The coefficient of variation (CV) is used to represent the effect of humidity on responses,9 which is defined as
| CV = RSD/Raverage × 100% | (1) |
After the decoration of Au, the effects of RH on responses can be reduced (CV decreased from 20–60% to 7–25%), while the fast response and recovery properties are maintained (Fig. 8(c)). Since the bind energy of adsorbed gas molecules can be affected by MOX, metal catalyst and operating temperature, it is not surprising to observe such variations as shown in Fig. 8(d). The essential goal is to find the balance point between them and obtain the operating temperature region with accetaple variation for praticle application. Comparison of temperature-dependent responses of 49.4 ppm benzene with different RH indicate that 300 °C is a suitable operating temperature for precise detection of benzene gas with different RH (CV only 5.70%, Fig. 8(d)).
The reaction of target molecules with adsorbed oxygen ions on the surface of MOX is a key unit for gas sensing, especially in a RH environments. The loading of Au nanoparticles contributes to good anti-humidity properties via the following two ways.8,34,35 One is the widely accepted theory of increased surface adsorbed oxygen ions; the other is the catalytic effects on the gas sensing reaction. Both of them significantly enhanced the responses to benzene, while the resistance decrease caused by RH changes slightly. Thus the RH induced unreliable results can be reduced by decreasing its relative contribution to the total resistance change in the gas sensing reaction.
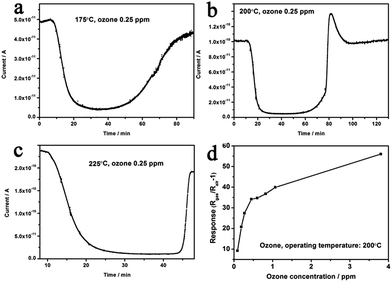
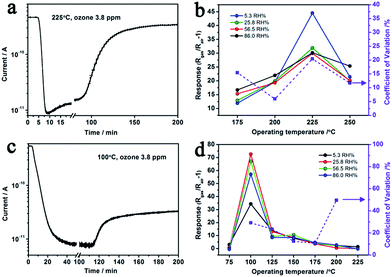
After the decoration of Au nanocrystals, response properties can be significantly improved (Fig. 10(a)). At 200 °C, the response time was reduced to ∼2.60 min for Au–5Sn–ZLPC-1, while it was ∼8.73 min for Au–5Sn–ZLPC-2 (Fig. 10(c)). It should be noted that catalytic effects of Au nanocrystals can decompose ozone to oxygen, which results in decreased concentration and reduced responses. As discussed above for pure 5Sn–ZLPC, low concentration of ozone will result in long response time. Thus, it might be the reason why the sample with high Au decoration showed slower response property than other samples.
The optimal operating temperature of Au–5Sn–ZLPC-2 for ozone detection could be reduced from 200 °C to 100 °C, while that of the sample with low amounts of Au nanocrystals is unchanged (225 °C, Fig. 10(b) and (d)). RH induced unreliable results (CV > 20%) were observed at some operating temperatures for two Au decorated samples. However, results at other operating temperatures show little effects by RH, of which the possible mechanism is similar to benzene gas mentioned above. It indicates that Au decorated samples can be used as stable ozone gas sensors at low temperature and under different RH.
4. Conclusions
In summary, the syntheses of gold–tin co-sensitized ZnO layered porous nanocrystals have been demonstrated. Sn doping contributes to low activation energy, effective surface reaction based on adsorbed oxygen ions, and the mesoporous hierarchical structure. Au decoration further enhances the effective surface reaction via catalytic effect and the additional depletion layer brought by the special synergy between noble metals and oxides. Co-sensitization of Au and Sn significantly enhanced sensing properties of sensors to reducing VOC gas were, while those of sensors to oxidizing ozone gas were complicated. Lower operating temperature (the adsorption rather than desorption of oxygen ions), together with the catalytic effects and additional depletion layer, contributed to enhanced sensing properties of Au–Sn co-sensitized ZnO to reducing gases. In contrast, although the response time and operating temperature were reduced, catalytic effects of Au nanocrystals can decompose ozone to oxygen, which resulted in decreased concentration and reduced responses. Apart from these typical sensing properties, (responses, operating temperature, response & recovery properties, etc.), Au decorated samples significantly reduced negative effects of RH on responses to both reducing and oxidizing gases (good anti-humidity). This work indicates that Au–Sn–ZLPCs can be used as stable gas sensors for both reducing and oxidizing gases at low temperature and under different RH. These interesting particles might be used for a wide range of innovative applications such as photo catalysis, the template for complex structure, electronic noses, MOX–MOFs nanocomposites, and so on.Acknowledgements
This work was supported by the National Natural Science Foundation of China (51402293, 21401193 and 21550110194), the Natural Science Foundation of Fujian Province (2015J01230).Notes and references
- Z. Zhao, J. Tian, Y. Sang, A. Cabot and H. Liu, Adv. Mater., 2015, 27, 2557–2582 CrossRef CAS PubMed.
- T. Wagner, S. Haffer, C. Weinberger, D. Klaus and M. Tiemann, Chem. Soc. Rev., 2013, 42, 4036–4053 RSC.
- T. Li, W. Zeng and Z. Wang, Sens. Actuators, B, 2015, 221, 1570–1585 CrossRef CAS.
- Y. Wang, Y. Zhou, C. Meng, Z. Gao, X. Cao, X. Li, L. Xu, W. Zhu, X. Peng, B. Zhang, Y. Lin and L. Liu, Nanotechnology, 2016, 27, 425503 CrossRef PubMed.
- J. T. Fourkas, J. Phys. Chem. Lett., 2011, 2, 2945 CrossRef CAS.
- H.-J. Kim, H.-M. Jeong, T.-H. Kim, J.-H. Chung, Y. C. Kang and J.-H. Lee, ACS Appl. Mater. Interfaces, 2014, 6, 18197–18204 CAS.
- C. Wang, L. Yin, L. Zhang, D. Xiang and R. Gao, Sensors, 2010, 10, 2088 CrossRef CAS PubMed.
- N. Ma, K. Suematsu, M. Yuasa, T. Kida and K. Shimanoe, ACS Appl. Mater. Interfaces, 2015, 7, 5863–5869 CAS.
- M. S. Yao, W. X. Tang, G. E. Wang, B. Nath and G. Xu, Adv. Mater., 2016, 28, 5229–5234 CrossRef CAS PubMed.
- S.-J. C. Won-Tae Koo, S.-J. Kim, J.-S. Jang, H. L. Tuller and I.-D. Kim, J. Am. Chem. Soc., 2016, 138, 13431–13437 CrossRef PubMed.
- A. T. Güntner, V. Koren, K. Chikkadi, M. Righettoni and S. E. Pratsinis, ACS Sens., 2016, 1, 528–535 CrossRef.
- F. C. Chung, R. J. Wu and F. C. Cheng, Sensors and Actuators, B: Chemical, 2014, 190, 1–7 CrossRef CAS.
- N. Yamazoe and K. Shimanoe, Sens. Actuators, B, 2009, 138, 100–107 CrossRef CAS.
- M. R. Alenezi, S. J. Henley, N. G. Emerson and S. R. P. Silva, Nanoscale, 2014, 6, 235–247 RSC.
- T. Stoycheva, F. E. Annanouch, I. Gràcia, E. Llobet, C. Blackman, X. Correig and S. Vallejos, Sens. Actuators, B, 2014, 198, 210–218 CrossRef CAS.
- S. Dilger, C. Lizandara-Pueyo, M. Krumm and S. Polarz, Adv. Mater., 2012, 24, 543–548 CrossRef CAS PubMed.
- P. Sun, X. Zhou, C. Wang, K. Shimanoe, G. Lu and N. Yamazoe, J. Mater. Chem. A, 2014, 2, 1302–1308 CAS.
- X. Zhou, W. Feng, C. Wang, X. Hu, X. Li, P. Sun, K. Shimanoe, N. Yamazoe and G. Lu, J. Mater. Chem. A, 2014, 2, 17683–17690 CAS.
- M. Yao, P. Hu, Y. Cao, W. Xiang, X. Zhang, F. Yuan and Y. Chen, Sens. Actuators, B, 2013, 117, 562–569 CrossRef.
- Y. Lu, W. Zhan, Y. He, Y. Wang, X. Kong, Q. Kuang, Z. Xie and L. Zheng, ACS Appl. Mater. Interfaces, 2014, 6, 4186–4195 CAS.
- W. Li, X. Wu, N. Han, J. Chen, X. Qian, Y. Deng, W. Tang and Y. Chen, Sens. Actuators, B, 2016, 225, 158–166 CrossRef CAS.
- D. H. Kim, Y.-S. Shim, J.-M. Jeon, H. Y. Jeong, S. S. Park, Y.-W. Kim, J.-S. Kim, J.-H. Lee and H. W. Jang, ACS Appl. Mater. Interfaces, 2014, 6, 14779–14784 CAS.
- Y. V. Kaneti, J. Yue, X. Jiang and A. Yu, J. Phys. Chem. C, 2013, 117, 13153–13162 CAS.
- X. Han, X. Han, L. Li and C. Wang, New J. Chem., 2012, 36, 2205–2208 RSC.
- H. Zhang, M. Yao, L. Bai, W. Xiang, H. Jin, J. Li and F. Yuan, CrystEngComm, 2013, 15, 1432–1438 RSC.
- L. Li, C. Zhang and W. Chen, Nanoscale, 2015, 7, 12133–12142 RSC.
- A. Kumar, S. Samanta, A. Singh, M. Roy, S. Singh, S. Basu, M. M. Chehimi, K. Roy, N. Ramgir, M. Navaneethan, Y. Hayakawa, A. K. Debnath, D. K. Aswal and S. K. Gupta, ACS Appl. Mater. Interfaces, 2015, 7, 17713–17724 CAS.
- S. Park, S. Kim, H. Kheel and C. Lee, Sens. Actuators, B, 2016, 222, 1193–1200 CrossRef CAS.
- J. H. Kim, A. Katoch, S. H. Kim and S. K. Sang, ACS Appl. Mater. Interfaces, 2015, 7, 15351–15358 CAS.
- C. Wang, S. Ma, A. Sun, R. Qin, F. Yang, X. Li, F. Li and X. Yang, Sens. Actuators, B, 2014, 193, 326–333 CrossRef CAS.
- M. Yao, Q. Li, G. Hou, C. Lu, B. Cheng, K. Wu, G. Xu, F. Yuan, F. Ding and Y. Chen, ACS Appl. Mater. Interfaces, 2015, 7, 2856–2866 CAS.
- C. Wang, X. Cui, J. Liu, X. Zhou, X. Cheng, P. Sun, X. Hu, X. Li, J. Zheng and G. Lu, ACS Sens., 2016, 1, 131–136 CrossRef CAS.
- K. Suematsu, M. Sasaki, N. Ma, M. Yuasa and K. Shimanoe, ACS Sens., 2016, 1, 913–920 CrossRef CAS.
- A. Kolmakov, D. O. Klenov, Y. Lilach, S. Stemmer and M. Moskovits, Nano Lett., 2005, 5, 667–673 CrossRef CAS PubMed.
- L. Wang, Z. Lou, T. Fei and T. Zhang, J. Mater. Chem., 2012, 22, 4767–4771 RSC.
- M. Yao, F. Ding, Y. Cao, P. Hu, J. Fan, C. Lu, F. Yuan, C. Shi and Y. Chen, Sens. Actuators, B, 2014, 201, 255–265 CrossRef CAS.
- D. Calestani, R. Mosca, M. Zanichelli, M. Villani and A. Zappettini, J. Mater. Chem., 2011, 21, 15532–15536 RSC.
- N. Kruse and S. Chenakin, Applied Catalysis, A: General, 2011, 391, 367–376 CrossRef CAS.
- M. C. Patterson, X. Nie, F. Wang, R. L. Kurtz, S. B. Sinnott, A. Asthagiri and P. T. Sprunger, J. Phys. Chem. C, 2013, 117, 18386–18397 CAS.
- M. D'Arienzo, L. Armelao, A. Cacciamani, C. M. Mari, S. Polizzi, R. Ruffo, R. Scotti, A. Testino, L. Wahba and F. Morazzoni, Chem. Mater., 2010, 22, 4083–4089 CrossRef.
- Y.-d. Wang, C.-l. Ma, X.-d. Sun and H.-d. Li, Nanotechnology, 2002, 13, 565–569 CrossRef CAS.
- F. Song, H. Su, J. Han, W. M. Lau, W.-J. Moon and D. Zhang, J. Phys. Chem. C, 2012, 116, 10274–10281 CAS.
- M. D'Arienzo, L. Armelao, C. M. Mari, S. Polizzi, R. Ruffo, R. Scotti and F. Morazzoni, J. Am. Chem. Soc., 2011, 133, 5296–5304 CrossRef PubMed.
- X. Xue, Z. Chen, C. Ma, L. Xing, Y. Chen, Y. Wang and T. Wang, J. Phys. Chem. C, 2010, 114, 3968–3972 CAS.
- R. Dolbec and M. A. El Khakani, Appl. Phys. Lett., 2007, 90, 173114–173116 CrossRef.
- H. Windischmann and P. Mark, J. Electrochem. Soc., 1979, 126, 627–633 CrossRef CAS.
- S. Kattel, W. Yu, X. Yang, B. Yan, Y. Huang, W. Wan, P. Liu and J. G. Chen, Angew. Chem., Int. Ed., 2016, 128, 8100–8105 CrossRef.
- F. Calle-Vallejo, J. Tymoczko, V. Colic, Q. H. Vu, M. D. Pohl, K. Morgenstern, D. Loffreda, P. Sautet, W. Schuhmann and A. S. Bandarenka, Science, 2015, 350, 185–189 CrossRef CAS PubMed.
- J.-W. Yoon, J.-S. Kim, T.-H. Kim, Y. J. Hong, Y. C. Kang and J.-H. Lee, Small, 2016, 12(31), 4229–4240 CrossRef CAS PubMed.
- Q. Lipeng, X. Jiaqiang, D. Xiaowen, P. Qingyi, C. Zhixuan, X. Qun and L. Feng, Nanotechnology, 2008, 19, 185705 CrossRef PubMed.
- S. Tian, F. Yang, D. Zeng and C. Xie, J. Phys. Chem. C, 2012, 116, 10586–10591 CAS.
- Y. Xiao, L. Lu, A. Zhang, Y. Zhang, L. Sun, L. Huo and F. Li, ACS Appl. Mater. Interfaces, 2012, 4, 3797–3804 CAS.
- A. Katoch, S. W. Choi, G. J. Sun and S. S. Kim, J. Nanosci. Nanotechnol., 2015, 15, 438–445 Search PubMed.
- I. Elmi, S. Zampolli, E. Cozzani, F. Mancarella and G. Cardinali, Sens. Actuators, B, 2008, 135, 342–351 CrossRef CAS.
- M. Yao, P. Hu, N. Han, F. Ding, C. Yin, F. Yuan, J. Yang and Y. Chen, Sens. Actuators, B, 2013, 186, 614–621 CrossRef CAS.
| This journal is © The Royal Society of Chemistry 2017 |

