 Open Access Article
Creative Commons Attribution 3.0 Unported Licence
Synthesis and characterization of flower-like MoO3/In2O3 microstructures for highly sensitive ethanol detection†
Jie Hu *a,
Xiu Wanga,
Meng Zhanga,
Yongjiao Suna,
Pengwei Li
 a,
Wendong Zhanga,
Kun Liana,
Lin Chen*b and
Yong Chenc
aMicro and Nano System Research Center, Key Lab of Advanced Transducers and Intelligent Control System (Ministry of Education), College of Information Engineering, Taiyuan University of Technology, Taiyuan 030024, Shanxi, China. E-mail: hujie@tyut.edu.cn
bResearch Center on Advanced Materials Science and Technology, Taiyuan University of Technology, Taiyuan 030024, Shanxi, China. E-mail: chenlin01@tyut.edu.cn
cEcole Normale Supérieure, CNRS-ENS-UPMC UMR 8640, Paris 75005, France
First published on 28th April 2017
Abstract
Flower-like pure and Mo-loaded In2O3 hierarchical microstructures were synthesized by a facile hydrothermal method. The morphology, crystal structures, and compositions of the samples were characterized by SEM, XRD, TEM, showing nanosheets with dimensions of 4 μm diameter and 25 nm thickness. Gas sensing experiments were conducted on the as-prepared MoO3/In2O3 gas sensors, and the results prove that Mo-loaded In2O3 gas sensors exhibit enhanced gas sensing properties at 185 °C. In particular, the 3 mol% Mo-loaded In2O3 provided a high response (7 to 100 ppm ethanol), fast response and recovery time (11 s and 94 s), low detection limit (50 ppb), good selectivity and stability for ethanol detection, which is promising for low concentration ethanol detection in practical applications.
1. Introduction
In the past decades, metal oxide semiconductor (MOS) gas sensors, such as ZnO,1 SnO2,2 In2O3,3 WO3,4 Cr2O3,5 CuO,6 etc., have attracted tremendous attention owing to their domestic and industrial applications for detection of explosive gases, toxic gases, and volatile organic compounds (VOCs). Among them, indium oxide (In2O3), an important n-type semiconductor with a direct band gap of 3.55–3.75 eV, has been reported as the best potential gas sensing material due to its good conductivity and high stability.7–10 Furthermore, In2O3 has been produced in different forms of nanostructures, such as nanowires, nanospheres, nanorods, nanoporous and nanofibers, showing interesting gas sensing capabilities for various gases including nitric oxide,11 methane,12 ammonia,13 acetone14 and ethanol.15More recently, numerous studies have demonstrated that the gas sensing properties of MOS materials are not only highly dependent on the morphology, surface to volume ratio, crystalline size, exposed surface, etc.16–18 but also related to the further functionalization with other metals, graphene and so on.19–21 In particular, many researchers have reported that the introducing of dopant element into In2O3 sensing materials may causes the change of crystalline structure and grain size as well as impurity levels and surface defects, which can significantly improve the gas sensing performances of In2O3 gas sensors.22–24 For example, Han et al. reported that Ce-doped In2O3 gas sensors exhibited a response of 35.2 towards 100 ppm methanol, which is about 2.2 times as high as the pure In2O3 gas sensor.25 Zheng et al. have demonstrated that the response of Pt nanoparticles decorated In2O3 nanofibers can reach to 1490 under 600 ppm H2S atmospheres, which is about 10 times higher than that of the pure one.26 By electrospinning and subsequent calcination, Chi et al. have fabricated Fe2O3–In2O3 nanotubes with a response of 33 to 100 ppm formaldehyde, and the obtained response is about double of the pure In2O3 nanotubes.27 Up to now, although considerable efforts have been focused on the study of the influence of doping unique elements to the sensing performances, to the best of our knowledge, studies of MoO3/In2O3 hierarchical microstructures optimized the doping content have rarely been reported.
Herein, we report a facile method for the preparation of MoO3/In2O3 flower-like hierarchical microstructures by a simple hydrothermal method. The morphology, crystalline structures, and compositions of the samples were characterized using different techniques. The gas sensing performances of pure and Mo-loaded In2O3 microstructures to ethanol were investigated under different working temperatures. The results indicate that the introducing of Mo element can significantly improve the gas sensing properties of In2O3-based sensors, which can be explained by considering the change of the band structures of the samples.
2. Materials and methods
2.1 Materials
Indium chloride tetrahydrate (InCl3·4H2O, ≥97%) and ammonium molybdate tetrahydrate ((NH4)6Mo7O24·4H2O, ≥99.98%) were obtained from Sigma-Aldrich (Shanghai, China). Sodium dodecyl sulfate (C12H25SO4Na, SDS, ≥99%) and urea (CO(NH2)2, ≥99%) were purchased from Sinopharm Chemical Reagent Co. Ltd., China. The other chemical reagents were used analytical grade without any further purification.2.2 Preparation of flower-like Mo-loaded In2O3 microstructure
In a typical process, 1.2 mmol of InCl3·4H2O, 3.6 mmol of SDS and 6 mmol of urea were dissolved into 72 mL of deionized (DI) water. After that, different amounts of (NH4)6Mo7O24·4H2O (0, 1, 3 and 5 mol%) were added into the mixed solution with vigorous stirring for 30 min at room temperature. Then, the obtained solution was transferred into a 72 ml Teflon-lined stainless steel autoclave, sealed tightly, maintained at 120 °C for 12 h. After cooled to room temperature naturally, the precipitates were collected by centrifugation and then washed with DI water and ethanol for several times. The fine powders were obtained after dried at 80 °C for 24 h in oven. Finally, the samples were calcined in a muffle furnace at 600 °C for 3 h, and the calcined products were then collected for further analyses. For convenience, the molar ratio of Mo/In (0, 1, 3 and 5 mol%) were defined as Mo0In, Mo1In, Mo3In and Mo5In, respectively.2.3 Characterization
The crystal phase and crystallinity of as-synthesized products were analyzed by X-ray diffraction (XRD, Haoyuan, China) with Cu Kα1 radiation (λ = 1.5406 Å) in the range of 20–80°. The morphology and structure of Mo-loaded In2O3 were observed by using scanning electron microscope (SEM, JSM-7001F, Japan) and transmission electron microscopic (TEM, JEOL-2010F, Japan) at an accelerating voltage of 10 kV and 200 kV, respectively. The element compositions of the samples were characterized by the energy dispersive X-ray spectroscopy (EDS, Bruker) and the chemical state was investigated by X-ray photoelectron spectroscopy (XPS, Thermo Electron, U.K.) with monochromatic Al Kα (1486.6 eV) irradiation.2.4 Fabrication and measurement of gas sensor
The fabrication process of Mo-loaded In2O3 gas sensors can be described as follows. The obtained powders were firstly mixed with terpineol and ethyl cellulose (weight ratio 2![[thin space (1/6-em)]](https://www.rsc.org/images/entities/char_2009.gif) :
:![[thin space (1/6-em)]](https://www.rsc.org/images/entities/char_2009.gif) 8
8![[thin space (1/6-em)]](https://www.rsc.org/images/entities/char_2009.gif) :
:![[thin space (1/6-em)]](https://www.rsc.org/images/entities/char_2009.gif) 1) to form symmetrical slurry. Then, the slurry was carefully coated on the surface of alumina ceramic tube as sensing film with a pair of Au electrodes and Pt wires (Fig. 1(a)). Subsequently, the sensing element was dried at 80 °C for 10 h in air and annealed at 600 °C for 2 h to improve the mechanical strength. After that, a small Ni–Cr wire (∼45 Ω) was inserted into the alumina tube as heater to control the operating temperature of the sensor. After soldered on the pedestal (Fig. 1(b)), the gas sensor was aged at 5 V for 3 days in air to improve the long-term stability and repeatability.
1) to form symmetrical slurry. Then, the slurry was carefully coated on the surface of alumina ceramic tube as sensing film with a pair of Au electrodes and Pt wires (Fig. 1(a)). Subsequently, the sensing element was dried at 80 °C for 10 h in air and annealed at 600 °C for 2 h to improve the mechanical strength. After that, a small Ni–Cr wire (∼45 Ω) was inserted into the alumina tube as heater to control the operating temperature of the sensor. After soldered on the pedestal (Fig. 1(b)), the gas sensor was aged at 5 V for 3 days in air to improve the long-term stability and repeatability.
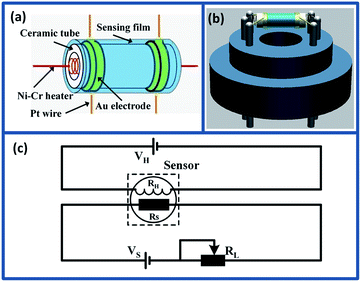 | ||
| Fig. 1 (a) Schematic illustration of gas sensing element. (b) The 3D schematic diagram of gas sensor. (c) The working principle of the electrical circuit for measuring the as-prepared gas sensors. | ||
The gas sensing properties of as-prepared sensors were measured using CGS-1TP intelligent analysis system (Elite, Beijing, China), and all the measures were performed under the controlled relative humidity (RH) 30% ± 5%. Fig. 1(c) shows the schematic diagram of the electrical circuit for measuring the pure and Mo-loaded In2O3 gas sensors. In the measuring electric circuit of gas sensor, the heating voltage (VH) is used to control the working temperature by heating the Ni–Cr wire. The load resistor (RL) is connected in series with the as-fabricated gas sensor. The circuit voltage VS is 5 V, and the output voltage (Vout) is the terminal voltage of the load resistor RL. During the gas sensing experiments, the gas sensors were placed into the testing chamber (18 L), and the target gas was injected into the chamber using microsyringe. The response was defined as the ratio of the resistance in air to the resistance in target gas (Ra/Rg). The response and recovery time was expressed as the time taken for the sensor to reach 90% of the total resistance change in the case of adsorption and desorption, respectively.
3. Results and discussion
3.1 Morphology and structure analysis
Fig. 2(a) depicts the XRD pattern of Mo-loaded In2O3 microstructures with different concentrations of Mo after calcination. The measured results show that all the diffraction peaks are matched well with In2O3 (JCPDS File no. 06-0416), and no other characteristic peaks can be found in the spectrum of samples, which indicates the high purity of the final products. Meanwhile, there is also no apparent peak of Mo can be detected, which is possibly due to the low concentration of Mo in the sample. Fig. 2(b) exhibits the magnified image of the peak (440) for as-synthesized In2O3 microstructures. It can be found that all the diffraction peaks are slightly shift to a higher angle, which might be due to lattice strain by the formation of Mo6+ ions (the ionic radius of Mo6+ (0.59 Å) is smaller than that of In3+ (0.8 Å) in the loaded In2O3 microstructures).28 The similar results have been reported in previous works.29–31 In addition, Fig. S1 (ESI S1†) illustrates the XRD patterns of as-synthesized samples before calculation, and the results indicate that the pure and Mo-loaded In2O3 samples can be obtained after calcination in a muffle furnace at 600 °C in air atmosphere.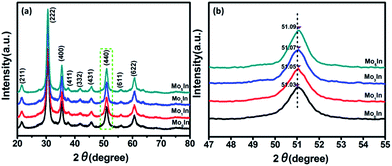 | ||
| Fig. 2 (a) X-ray diffraction patterns of as-synthesized microstructures. (b) High magnification of the (440) peaks. | ||
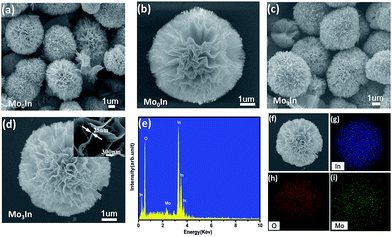
The morphological characteristics of the as-synthesized hierarchical flower-like samples were observed by SEM. Fig. 3(a) shows the SEM image of flower-like In2O3 microstructures, and the average diameter of microspheres is about 4 μm assembled with numerous nanosheets. Fig. 3(c) and (d) exhibits the SEM image of 3 mol% Mo-doped In2O3 samples, and the thickness of the nanosheet is only 25 nm from the inset image (Fig. 3(d)). It seems that the introduction of Mo element has no obvious influence on the morphology of samples, as shown in Fig. S2 (ESI S2†). Meanwhile, in order to investigate the composition, the EDS was performed on the sample of Mo3In, and the measured peaks of In, O and Mo are all corresponding well with the standard spectrum diagram, which confirms the existence of Mo element in sample. Moreover, the 3 mol% Mo-loaded In2O3 sample was further confirmed using the elemental mapping. From the Fig. 3(f)–(i), we can found that the spatial distribution of the In, O and Mo elements exhibits spherical microstructure, which indicates the uniform distributions of Mo element on the sample.
To further investigate the structural features of Mo-loaded In2O3 microstructures, TEM and HRTEM combined with the selected area electron diffraction (SAED) techniques were conducted on the sample of Mo3In. Fig. 4(a) shows the low magnification image of nanosheet, and the lattice fringes can be clearly observed in the high magnification image as Fig. 4(b). The lattice plane spacing was calculated with a periodic value of 0.253 nm and 0.292 nm corresponding to the (400) and (222) plane of In2O3 (Fig. 4(c) and (d)), respectively. Fig. 4(e) illustrates the corresponding SAED pattern of sample. The diffraction circles can be indexed to the (211), (400), (422), (440) and (622) planes of the flower-like In2O3 microstructure, which indicates the as-synthesized In2O3 microstructures is polycrystalline. However, it seems that there is no diffraction circle of Mo element, which is possibly due to the low concentration of Mo element in the sample.
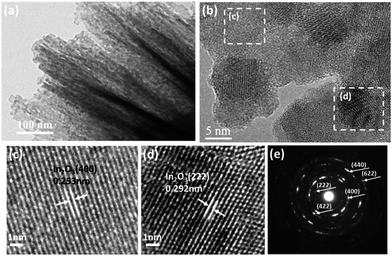 | ||
| Fig. 4 (a) TEM image of Mo3In nanosheets. (b) HRTEM image of Mo3In. (c and d) The enlarged HRTEM images of the marked areas, and (e) the corresponding SAED pattern. | ||
In order to determine the surface elements and chemical states of Mo-loaded In2O3 sample, the XPS measurements were performed on the Mo3In microstructures. The XPS spectra were calibrated with respect to the binding energy of the C 1s peak at 284.6 eV and deconvolution with the Casa XPS software. Fig. 5(a) illustrates XPS survey spectra of Mo3In microstructures, the elements of In, N, O and Mo can be clearly detected in the sample. Fig. 5(b) exhibits the high resolution XPS spectrum of In 3d state, which indicates the peaks located at 443.78 eV and 451.38 eV correspond to the In 3d5/2 and In 3d3/2, respectively. The peak separation between In 3d5/2 and In 3d3/2 is 7.6 eV, which suggests that In element exists principally in the form of In3+ in sample. From the XPS spectra of O 1s in Fig. 5(c), two peaks centered at 529.28 eV and 530.98 eV can be observed in the sample. The peak located at 529.28 eV can be assigned to the lattice oxygen in the as-synthesized product structure embraced by indium and molybdenum, and the peak at 530.98 eV can be ascribed to the oxygen defects in the metal oxide regions.32,33 The Mo 3d pectra (Fig. 5(d)) shows two peaks of the binding energy at 232.63 eV and 235.78 eV, which is associated with the Mo 3d5/2 and Mo 3d3/2 on the surface of sample, separately.34,35 Meanwhile, the crystal phase of MoO3 can be further confirmed on account of the two peaks separation of 3.2 eV, and it indicates the successful introduction of MoO3 in the sample, which consists well with the results of XRD and the elemental mapping of EDS.
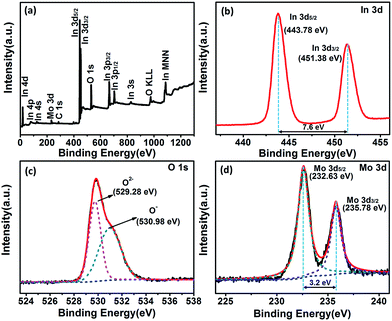 | ||
| Fig. 5 XPS spectra of the as-synthesized Mo3In. (a) Full survey scan spectrum, (b) In 3d, (c) O 1s and (d) Mo 3d, respectively. | ||
3.2 Gas sensing performance
As we all know, the operating temperature is most important parameter for a metal oxide semiconductor gas sensor, and the gas response is highly influenced by the working temperature. In order to determine the optimum operating temperature of as-prepared gas sensors, the responses of gas sensors were measured under different operating temperatures varying from 110 °C to 285 °C. As shown in Fig. 6, it can be clearly observed that the responses of all the gas sensors initially increase with temperature rising and reaching the maximum at 185 °C, and then decrease with further increasing of the operating temperature. Therefore, the optimum working temperature is chosen as 185 °C, which is applied in all the following investigation of gas sensing performance. For the ‘increase–maximum–decrease’ tendency of gas response, which could be attributed to the reason as following: when the operating temperature is too low, the absorbed ethanol molecules can't be activated enough to overcome the activation energy barrier to react with the absorbed oxygen species. However, when the operating temperature enhances too much, some absorbed oxygen species maybe escape away before the reaction.36,37 Meanwhile, the measured results also demonstrate that Mo-loaded In2O3 gas sensors exhibit significant enhanced gas response than pure one, which could be ascribed to the introduction of Mo element. Moreover, the Mo3In gas sensor shows the highest gas response, which is about two times higher than that of pure one. The measured results prove that appropriate MoO3 loading can significantly improve the gas sensing performances of In2O3 gas sensors, which was demonstrated in our experimental results. However, excessive amount of MoO3 in the samples will reduce the amount of oxygen adsorption and reactive sites, which will suppress the gas sensing properties of gas sensors.38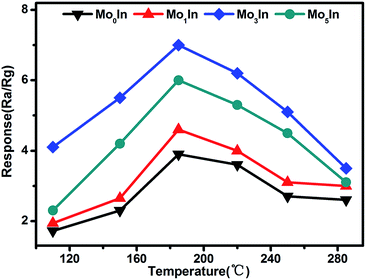 | ||
| Fig. 6 Response of as-prepared gas sensors upon exposure to 100 ppm ethanol at different working temperatures. | ||
At the same time, the reversibility of Mo-loaded In2O3 gas sensors were also investigated under different operating temperatures, Fig. 7 shows the corresponding resistance curves of sensors to 100 ppm ethanol under different operating temperatures. The results show that the resistance values of all the as-prepared gas sensors decrease sharply after exposure to ethanol gas, and recovery to the initial value when exposed in fresh air, which exhibit excellent reversibility. Fig. S3 (ESI S3†) presents the detailed initial resistance of as-prepared gas sensors under different operating temperature. It is worth noting that the resistance of gas sensors decreased with the increasing of the operating temperature, and the Mo1In gas sensor exhibits the highest resistance than other sensors under different operating temperature.
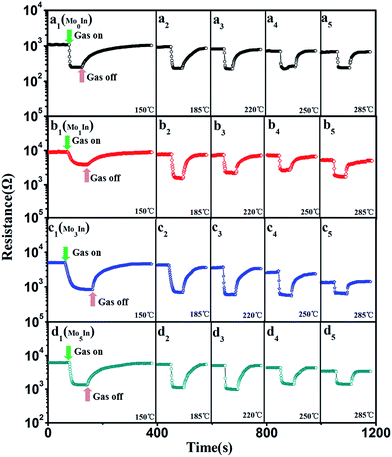 | ||
| Fig. 7 Resistance of as-prepared In2O3 gas sensors to 100 ppm ethanol under different operating temperatures, (a) Mo0In, (b) Mo1In, (c) Mo3In, (d) Mo5In. | ||
The response and recovery time are also important sensing characteristics of a gas sensor. Fig. 8(a) illustrates the response/recovery curves of as-prepared In2O3 gas sensors to 100 ppm ethanol vapor at 185 °C. It can be clearly observed that the response of gas sensor increases fast and reach to the stable value when exposed to ethanol. However, after the pumping ethanol gas away, the sensor response slowly returned to its initial value. At optimized operating temperature (185 °C), the measured response and recovery time for Mo3In sensor is about 11 s and 94 s, respectively. Fig. 8(b) displays the detailed information of response and recovery times for the as-prepared In2O3 gas sensors. From the measured curves, it can be clearly observed that the response time is ranged from 9 s to 12 s for 100 ppm ethanol vapor, whereas the recovery time varied from 68 s to 94 s. The results demonstrate that the response time is much shorter than the recovery time for all the gas sensors. Meanwhile, the response and recovery values as a function of operating temperature to 100 ppm ethanol for all the gas sensors are shown in Fig. S4 (ESI S4†). Compared with the lower temperature, we can find that all the as-fabricated In2O3 gas sensors exhibit faster response and recovery times at higher temperature.
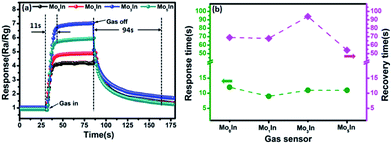 | ||
| Fig. 8 (a) Dynamic response–recovery behavior of In2O3 gas sensors toward 100 ppm ethanol at 185 °C, (b) response/recovery time of In2O3 gas sensors to 100 ppm ethanol at 185 °C. | ||
To further evaluate the gas sensing properties of as-prepared sensors, the dynamic response transient characteristics were conducted on In2O3 gas sensors under different concentrations of ethanol (1–800 ppm) at 185 °C, as shown in Fig. 9(a). When exposed to ethanol, the responses of all the gas sensors increase fast with the increasing concentration of ethanol. Meanwhile, it is noteworthy that the Mo3In gas sensor exhibits the highest response compared with others gas sensors, which indicates the enhanced gas sensing properties. Fig. 9(b) illustrates the response plots of In2O3 gas sensors versus ethanol concentration in the range of 1–800 ppm at optimum working temperature. It is obvious that the response values of gas sensors grow with the increasing concentration of ethanol (1–200 ppm). However, the responses of gas sensors exhibit the tendency of plateau as further increase the concentration of ethanol vapour. This phenomenon can be explained as follows: with the increasing concentration of ethanol, the response of gas sensor was determined by the surface reaction rate. Because there are insufficient adsorption sites, the response easily presents the status of saturation, and the similar results have been reported in previous literatures.22,38 Fig. S5 (ESI S5†) displays the real time resistance curves of as-prepared sensors toward different concentrations of ethanol vapour (1–800 ppm). It can be clearly observed that the resistance of the pure and Mo-loaded In2O3 gas sensors drastically decreased upon exposure to ethanol vapour and rapidly increased when the gas was removed. Furthermore, the resistance of Mo3In gas sensor can return to its original value after a response and recovery cycle comparing with Mo0In sensor, which indicates the good stability of Mo3In sensor.
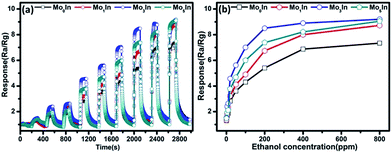 | ||
| Fig. 9 (a) Dynamic response transient of the gas sensor to different concentrations of ethanol at 185 °C. (b) Responses versus ethanol concentration for In2O3 gas sensors at 185 °C. | ||
In order to assess the detection limit, the gas sensing experiments were conducted on the as-fabricated gas sensors to low concentrations (50–500 ppb) of ethanol vapour under the optimum operating temperature. Fig. 10 depicts the transient response of gas sensors sequentially exposed to 50 ppb, 100 ppb, 200 ppb, 300 ppb, 400 ppb and 500 ppb ethanol at 185 °C, respectively. The measured responses of all the gas sensors show an obvious increase with the increasing concentration of ethanol. Meanwhile, Fig. S6 (ESI S6†) illustrates the response curves of gas sensors to low concentrations of ethanol, and the measured results demonstrate that the introduction of Mo element can significantly improve the gas sensing performance. Especially, the Mo3In sensor exhibits the highest gas response, and the measured response can reach to 1.5 even for 500 ppb ethanol. In addition, the obtained detection limit of Mo3In sensor can down to 50 ppb, which indicates that the as-prepared Mo3In gas sensor has a potential for lower concentration of ethanol detection.
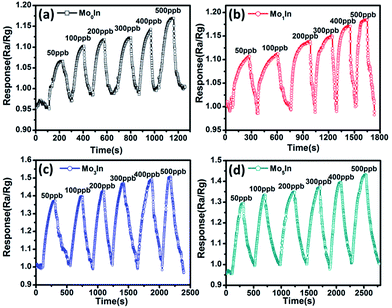 | ||
| Fig. 10 Dynamic response curves of as-prepared gas sensors to low concentrations of ethanol (50–500 ppb) at 185 °C, (a) Mo0In, (b) Mo1In, (c) Mo3In, (d) Mo5In. | ||
The selectivity is another key parameter for gas sensor, which is also crucial for practical application. Fig. 11(a) displays the responses of pure and Mo-loaded In2O3 gas sensors to various gases under the concentration of 100 ppm at 185 °C including ethanol, methanol, methane, carbon monoxide and hydrogen. It is noted that the as-prepared In2O3 gas sensors exhibit higher responses to ethanol compared with other testing gases. Meanwhile, the measured response of Mo-loaded In2O3 gas sensors to ethanol are significantly larger than that of pure In2O3 gas sensor, which prove the gas sensing performances of In2O3 has been effectively enhanced by Mo loading.
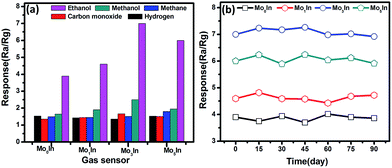 | ||
| Fig. 11 (a) Response of as-prepared In2O3 gas sensors to 100 ppm various gases at 185 °C. (b) The long term stability of In2O3 gas sensors to 100 ppm ethanol. | ||
For practical applications, gas sensors not only need to present high response and good selectivity to the target gases, but also ensure excellent their long-term reliability. Therefore, the long-term stability experiments were conducted on the as-fabricated In2O3 gas sensors toward 100 ppm of ethanol over a total period of 90 days, as shown in Fig. 11(b). It is clearly shown that the maximal deviations of the responses for all the In2O3 gas sensors are less than 10% toward ethanol, which exhibit the excellent stability of sensors.
3.3 Gas-sensing mechanism
It is well known that In2O3 is an n-type semiconducting chemiresistive oxide sensor material. The gas sensing mechanism for the In2O3 gas sensor was explained on the basis of an interaction mechanism for the adsorption of ethanol onto In2O3 microstructures. As an electron donor, In2O3 can provide electrons because of the existence of oxygen vacancy (Vo) in the gas sensing material.39–41 When In2O3 gas sensor exposed to fresh air, the oxygen molecules in air will be adsorbed on the surface of In2O3 through capturing free electrons from conduction band and form reactive oxygen species such as O2−, O2− and O−, leading to the creation of a depletion region and the increase of the resistance.21,22,26 When exposed to reducing gas like ethanol in this work, the ethanol gas molecules react with the reactive oxygen ions as the following reactions:15,42| CH3CH2OH(gas) ⇌ CH3CH2OH(ads) | (1) |
| 6O(ads)− + CH3CH2OH(ads) = 2CO2(gas) + 3H2O(gas) + 6e− | (2) |
As shown in the reactions (1) and (2), the trapped electrons are released back to the conduction band of the In2O3. This reaction causes the resistance of the In2O3 gas sensor decrease and induces the gas sensing.
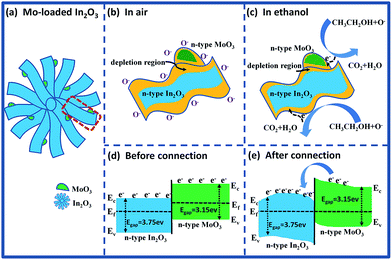
For the Mo-loaded In2O3 microstructures (Fig. 12(a)), the enhancement of gas response can be attributed to the reasons as follows: on the one hand, there is a synergetic effect on gas target due to that both In2O3 and MoO3 are n-type semiconducting metal oxide materials, and this effect has also been found in other composites.43,44 Fig. 12(b) and (c) illustrates the partial enlarged section of the MoO3–In2O3 junction after exposure to fresh air and ethanol, respectively. It is clearly seen that the reactions happened at the section of MoO3 are the same as what on the surface of In2O3, which have a positive effect for the response of gas sensor. On the other hand, the improvement of gas response can be ascribed to the formation of n–n homotype heterojunction structure between In2O3 and MoO3.45–47 As show in Fig. 12(d) and (e), the band gap of In2O3 (Eg = 3.75 eV) is higher than that of MoO3 (Eg = 3.15 eV), and electrons are transported from MoO3 to In2O3, leading to the formation of an accumulation layer and a depletion layer at the interface of In2O3 and MoO3, respectively. The subsequent oxygen adsorption makes the accumulation layer depleted in air, resulting in a further increase of resistance. Compared with pure In2O3 gas sensor, the larger change of resistance for MoO3/In2O3 composite material can be measured upon exposure to fresh air and ethanol, which results in the improvement of the sensing properties.
Furthermore, the high selectivity of gas sensor to ethanol could be explained in the following reasons: for one thing, the stability of compound is greatly affected by the bond energy. The higher the bond energy, the harder the bond breaks. It is well known that the bond strengths of C–H, C–C, C![[double bond, length as m-dash]](https://www.rsc.org/images/entities/char_e001.gif) O, H–H and O–H are 411, 345, 748.2, 436, 462 kJ mol−1, respectively,48 which indicates that the ethanol is relatively unstable due to the lowest bond energy of C–C in ethanol. Compared with these detected gases (methanol, methane, carbon monoxide, hydrogen), the higher reducing ability of ethanol results in the significant response. For another thing, many previous works have been reported that the gas sensing response of basic oxides was improved in terms of the reactive functional group or the complex molecular structure such as ethanol.49,50 An electron-liberate theory was used to elucidate the experimental results (for instance, methanol, hydrogen and carbon monoxide). The reactions can be expressed as follows:51,52
O, H–H and O–H are 411, 345, 748.2, 436, 462 kJ mol−1, respectively,48 which indicates that the ethanol is relatively unstable due to the lowest bond energy of C–C in ethanol. Compared with these detected gases (methanol, methane, carbon monoxide, hydrogen), the higher reducing ability of ethanol results in the significant response. For another thing, many previous works have been reported that the gas sensing response of basic oxides was improved in terms of the reactive functional group or the complex molecular structure such as ethanol.49,50 An electron-liberate theory was used to elucidate the experimental results (for instance, methanol, hydrogen and carbon monoxide). The reactions can be expressed as follows:51,52
| 3O(ads)− + CH3OH(ads) = CO2(gas) + 2H2O(gas) + 3e− | (3) |
| O(ads)− + CO(ads) = CO2(gas) + e− | (4) |
| O(ads)− + H2(ads) = H2O(gas) + e− | (5) |
Form the reactions (2)–(5), it is clearly seen that the ethanol gas can release more electrons under the same concentration comparing with other gases, which could be the other way to explain the better selectivity to ethanol.
4. Conclusions
Flower-like MoO3/In2O3 microstructures with different contents of Mo element were synthesized by hydrothermal method. Characterization results showed that the obtained flower-like microstructure were about 4 μm in size and composed of numerous nanosheets. Comparing with pure In2O3 gas sensor, the Mo-loaded In2O3 gas sensors exhibits better gas sensing performance for ethanol detection, including high response, fast response and recovery time, low detection limit, good selectivity and stability. This improvement could be attributed to synergetic effect as well as the n–n homotype heterojunction structure between In2O3 and MoO3, which provide sufficient active surfaces. However, excessive amount of MoO3 in the samples will suppress the detection sensibility of In2O3. In particular, optimization of the Mo content in the In2O3 hierarchical microstructures has proved that the optimum Mo load should be about 3 mol% ensuring the best gas sensing properties of the ethanol sensor.Acknowledgements
This work was financially supported by the National Natural Science Foundation of China (51205274), Higher school science and technology innovation project of Shanxi (2016137), Natural Science of Shanxi Province (2016011039), Talent project of Shanxi Province (201605D211036), Science and Technology Major Project of the Shan Xi Science and Technology Department (20121101004), Key Disciplines Construction in Colleges and Universities of Shanxi ([2012]45).Notes and references
- H. J. Zhang, R. F. Wu, Z. W. Chen, G. Liu, Z. N. Zhang and Z. Jiao, CrystEngComm, 2012, 14, 1775–1782 RSC.
- F. Song, H. L. Su, J. J. Chen, W. J. Moon, W. M. Lau and D. Zhang, J. Mater. Chem., 2012, 22, 1121–1126 RSC.
- L. L. Liu, S. C. Li, X. Guo, L. Y. Wang, L. Liu and X. S. Wang, J. Mater. Sci.: Mater. Electron., 2016, 27, 5153–5157 CrossRef CAS.
- X. Q. An, J. C. Yu, Y. Wang, Y. M. Hu, X. L. Yu and G. J. Zhang, J. Mater. Chem., 2012, 22, 8525–8531 RSC.
- H. Liu, X. W. Du, X. R. Xing, G. X. Wang and S. Z. Qiao, Chem. Commun., 2012, 48, 865–867 RSC.
- A. Aslani and V. Oroojpour, Phys. B, 2011, 406, 144–149 CrossRef CAS.
- C. H. Feng, W. Li, C. Li, L. H. Zhu, H. F. Zhang, Y. Zhang, S. P. Ruan, W. Y. Chen and L. X. Yu, Sens. Actuators, B, 2012, 166, 83–88 CrossRef.
- X. M. Zou, J. L. Wang, X. Q. Liu, C. L. Wang, Y. Jiang, Y. Wang, X. H. Xiao, J. C. Ho, J. C. Li, C. Z. Jiang, Y. Fang, W. Liu and L. Liao, Nano Lett., 2013, 13, 3287–3292 CrossRef CAS PubMed.
- H. X. Yang, L. Liu, H. Liang, J. J. Wei and Y. Z. Yang, CrystEngComm, 2011, 13, 5011–5016 RSC.
- H. Zhao, H. X. Dong, L. N. Zhang, X. W. Wang and H. Q. Yang, Mater. Chem. Phys., 2011, 130, 921–931 CrossRef CAS.
- C. S. Rout, K. Ganesh, A. Govindaraj and C. N. R. Rao, Appl. Phys. A, 2006, 85, 241–246 CrossRef CAS.
- Y. Cao, J. Zhao, X. X. Zou, P. P. Jin, H. Chen, R. Q. Gao, L. J. Zhou, Y. C. Zou and G. D. Li, RSC Adv., 2015, 5, 5424–5431 RSC.
- S. Elouali, L. G. Bloor, R. Binions, I. P. Parkin, C. J. Carmalt and J. A. Darr, Langmuir, 2012, 28, 1879–1885 CrossRef CAS PubMed.
- X. H. Sun, H. M. Ji, X. L. Li, S. Cai and C. M. Zheng, Mater. Lett., 2014, 120, 287–291 CrossRef CAS.
- S. An, S. Park, H. Ko, C. Jin, W. I. Lee and C. Lee, J. Phys. Chem. Solids, 2013, 74, 979–984 CrossRef CAS.
- M. Hashimoto, S. Ujiie and A. Mori, Adv. Mater., 2003, 15, 797–800 CrossRef CAS.
- Y. F. Hao, G. W. Meng, C. H. Ye and L. D. Zhang, Cryst. Growth Des., 2005, 5, 1617–1621 CAS.
- T. Gao and T. H. Wang, J. Cryst. Growth, 2006, 290, 660–664 CrossRef CAS.
- Y. J. Sun, Z. T. Zhao, P. W. Li, G. Li, Y. Chen, W. D. Zhang and J. Hu, Appl. Surf. Sci., 2015, 356, 73–80 CrossRef CAS.
- W. Yang, P. Wan, X. D. Zhou, J. M. Hu, Y. F. Guan and L. Feng, ACS Appl. Mater. Interfaces, 2014, 6, 21093–21100 CAS.
- X. W. Li, J. Y. Liu, H. Guo, X. Zhou, C. Wang, P. Sun, X. L. Hu and G. Y. Lu, RSC Adv., 2015, 5, 545–551 RSC.
- X. P. Shen, L. J. Guo, G. X. Zhu, C. Y. Xi, Z. Y. Ji and H. Zhou, RSC Adv., 2015, 5, 64228–64234 RSC.
- X. Y. Lai, P. Li, T. L. Yang, J. C. Tu and P. Xue, Scr. Mater., 2012, 67, 293–296 CrossRef CAS.
- W. W. Chen, Y. K. Liu, Z. J. Qin, Y. M. Wu, S. H. Li and P. Ai, Sensors, 2015, 15, 29950–29957 CrossRef CAS PubMed.
- D. Han, P. Song, S. Zhang, H. H. Zhang, Q. Xu and Q. Wang, Sens. Actuators, B, 2015, 216, 488–496 CrossRef CAS.
- W. Zheng, X. F. Lu, W. Wang, Z. Y. Li, H. N. Zhang, Z. J. Wang, X. R. Xu, S. Y. Li and C. Wang, J. Colloid Interface Sci., 2009, 338, 366–370 CrossRef CAS PubMed.
- X. Chi, C. B. Liu, L. Liu, S. C. Li, H. Y. Li, X. B. Zhang, X. Q. Bo and H. Shan, Mater. Sci. Semicond. Process., 2014, 18, 160–164 CrossRef CAS.
- S. S. Farvid, M. Hegde and P. V. Radovanovic, Chem. Mater., 2013, 25, 233–244 CrossRef CAS.
- J. Hu, F. Q. Gao, Z. T. Zhao, S. B. Sang, P. W. Li, W. D. Zhang, X. T. Zhou and Y. Chen, Appl. Surf. Sci., 2016, 363, 181–188 CrossRef CAS.
- S. S. Yi, J. B. Cui, S. Li, L. J. Zhang, D. J. Wang and Y. H. Lin, Appl. Surf. Sci., 2014, 319, 230–236 CrossRef CAS.
- N. R. Yogamalar and A. C. Bose, J. Alloys Compd., 2011, 509, 8493–8500 CrossRef CAS.
- A. Gurlo, N. Barsan, U. Weimar, M. Ivanovskaya, A. Taurino and P. Siciliano, Chem. Mater., 2003, 23, 4377–4383 CrossRef.
- Q. Liu, W. Zhang, R. Liu and G. B. Mao, Eur. J. Inorg. Chem., 2015, 5, 845–851 CrossRef.
- C. Tao, S. P. Ruan, X. D. Zhang, G. H. Xie, L. Shen, X. Z. Kong, W. Dong, C. X. Liu and W. Y. Chen, Appl. Phys. Lett., 2008, 93, 193307 CrossRef.
- J. Swiatowska-Mrowiecka, S. de Diesbach, V. Maurice, S. Zanna, L. Klein, E. Briand, I. Vickridge and P. Marcus, J. Phys. Chem. C, 2008, 112, 11050–11058 CAS.
- Y. D. Zhang, Z. Zheng and F. L. Yang, Ind. Eng. Chem. Res., 2010, 49, 3539–3543 CrossRef CAS.
- F. Li, S. J. Guo, J. L. Shen, L. Shen, D. M. Sun, B. Wang, Y. Chen and S. P. Ruan, Sens. Actuators, B, 2017, 238, 364–373 CrossRef CAS.
- C. Q. Ge, C. S. Xie and S. Z. Cai, Mater. Sci. Eng., B, 2007, 137, 53–58 CrossRef CAS.
- C. S. Rout, K. Ganesh, A. Govindaraj and C. N. R. Rao, Appl. Phys. A, 2006, 85, 241–246 CrossRef CAS.
- L. Liao, H. B. Lu, J. C. Li, H. He, D. F. Wang, D. J. Fu and C. Liu, J. Phys. Chem. C, 2007, 111, 1900–1903 CAS.
- S. Xu, J. Gao, L. L. Wang, K. Kan, Y. Xie, P. K. Shen, L. Li and K. Y. Shi, Nanoscale, 2015, 7, 14643–14651 RSC.
- T. T. Wang, S. Y. Ma, L. Cheng, J. Luo, X. H. Jiang and W. X. Jin, Sens. Actuators, B, 2015, 216, 212–220 CrossRef CAS.
- P. Sun, Y. X. Cai, S. S. Du, X. M. Xu, L. You, J. Ma, F. M. Liu, X. S. Liang, Y. F. Sun and G. Y. Lu, Sens. Actuators, B, 2013, 182, 336–343 CrossRef CAS.
- B. P. J. de Lacy Costello, R. J. Ewen, N. M. Ratcliffe and P. S. Sivanand, Sens. Actuators, B, 2003, 92, 159–166 CrossRef CAS.
- P. Li, H. Q. Fan and Y. Cai, Sens. Actuators, B, 2013, 185, 110–116 CrossRef CAS.
- W. L. Zang, Y. X. Nie, D. Zhu, P. Deng, L. L. Xing and X. Y. Xue, J. Phys. Chem. C, 2014, 118, 9209–9216 CAS.
- W. Zeng, T. M. Liu and Z. C. Wang, Phys. E, 2010, 43, 633–638 CrossRef CAS.
- X. F. Chu, S. M. Liang, W. Q. Sun, W. B. Zhang, T. Y. Chen and Q. F. Zhang, Sens. Actuators, B, 2010, 148, 399–403 CrossRef CAS.
- J. Q. Xu, J. J. Han, Y. Zhang, Y. A. Sun and B. Xie, Sens. Actuators, B, 2008, 132, 334–339 CrossRef CAS.
- H. Men, P. Gao, B. B. Zhou, Y. J. Chen, C. L. Zhu, G. Xiao, L. Q. Wang and M. L. Zhang, Chem. Commun., 2010, 46, 7581–7583 RSC.
- P. Song, Q. Wang and Z. X. Yang, Sens. Actuators, B, 2011, 156, 983–989 CrossRef CAS.
- P. Song, H. H. Zhang, D. Han, J. Li, Z. X. Yang and Q. Wang, Sens. Actuators, B, 2014, 196, 140–146 CrossRef CAS.
Footnote |
| † Electronic supplementary information (ESI) available. See DOI: 10.1039/c7ra02593a |
| This journal is © The Royal Society of Chemistry 2017 |

