 Open Access Article
Creative Commons Attribution 3.0 Unported Licence
Voltage-stabilised elastomers with increased relative permittivity and high electrical breakdown strength by means of phase separating binary copolymer blends of silicone elastomers†
Aliff Hisyam A Razakab,
Liyun Yua and
Anne Ladegaard Skov *a
*a
aDanish Polymer Center, Department of Chemical and Biochemical Engineering, Technical University of Denmark, Building 227, 2800 Kgs. Lyngby, Denmark. E-mail: al@kt.dtu.dk; Web: http://www.dpc.kt.dtu.dk/ Fax: +45 45882258; Tel: +45 45252825
bFaculty of Engineering Technology, University of Tun Hussein Onn Malaysia, 86400 Parit Raja, Batu Pahat, Johor, Malaysia
First published on 23rd March 2017
Abstract
Increased electrical breakdown strength and increased dielectric permittivity of silicone-based dielectric elastomers are achieved by means of the addition of so-called voltage-stabilisers prepared from PDMS–PPMS copolymers as well as PDMS–PEG copolymers in order to compensate for the negative effect of softness on electrical stability of silicone elastomers. The voltage-stabilised elastomer, incorporating a high-permittivity PDMS–PEG copolymer, possesses increased relative permittivity, high electrical breakdown strength, excellent network integrity and low dielectric loss and paves the way towards specialised silicone elastomers for dielectric elastomer transducer products with inherent softness and electrical stability, and thus increased actuation at a given voltage.
1 Introduction
Silicone-based dielectric elastomers (DEs) possess a low Young's modulus, i.e. they are inherently soft and excellent for utilisation as dielectric actuators.1,2 In order to achieve larger actuation strains at any given voltage, silicone DEs must possess increased relative permittivity combined with increased softness. However, the combination of softness and increased permittivity is not always simple.3 For instance, a silicone elastomer incorporating metal oxide fillers has increased dielectric permittivity, but this results in a stiff elastomer due to strong particle–particle interactions.4 Thus the electro-mechanical response is not improved. Furthermore the electrical breakdown strength depends on the Young's modulus, such that increased softness will decrease the electrical breakdown strength as well as the electromechanical stability being negatively influenced.1,5Increased relative permittivity is often sought as the primary source for improved actuation, with approaches including integrating highly polarisable fillers,4,6–9 covalent grafting of dipoles to the silicone backbone10–13 and phase-separating systems containing high-permittivity liquids or copolymers.14–16 Besides enhancing relative permittivity, the optimisation of silicone DEs with respect to largest achievable actuation strains can be done by enhancing electrical breakdown strength. For an improvement in this regard, approaches include elastomers incorporating either metal oxide fillers17 or additives with a voltage-stabilising effect.18–20 Furthermore, silicone elastomers containing phenyl groups have been shown to possess increased electrical breakdown strength via voltage stabilisation due to an electron trapping effect.21 The voltage-stabilised silicone elastomer is prepared from a polydimethylsiloxane–polyphenylmethylsiloxane (PDMS–PPMS) copolymer, which is subsequently cross-linked. The cross-linked PDMS–PPMS copolymer phase separates microscopically, due to immiscibility between PPMS and PDMS. This microscopic phase separation in cross-linked PDMS–PPMS copolymers has been proven favourable with respect to electrical properties.21
Phase separation is commonly known to occur in polymer blends and block copolymers. Polymer blends phase separate due to the immiscibility of the polymers as a result of minimising free energy when the polymers separate.22,23 Thermoplastic polymer blends possess different types of well-defined structures, such as bi-continuous structures,23–25 islands23 and holes,23 and these phase-separated structures depend strongly on the volume fraction of the constituents in the polymer blends. A silicone elastomer prepared from a binary polymer blend consisting of a conducting PDMS–PEG copolymer and non-conducting PDMS was shown to result in the creation of a continuous phase of PDMS and a discontinuous phase of PEG.16 Favourable phase morphologies in cross-linked blends can be achieved via proper blending and preparation methods.
Previous work on incorporating PDMS–PEG copolymers in commercial silicone elastomer16 has resulted in elastomers with increased dielectric relative permittivity without compromising the inherent softness of the silicone elastomer. However, the electrical breakdown strength of such elastomers is comparable to that of the commercial elastomer or slightly less. Voltage stabilization resulting in increased breakdown strength has been achieved by formulation of silicone elastomers with PDMS–PPMS and thus paves the way towards specially designed elastomers with high electrical stability.21 Hence incorporating a relative permittivity enhancer such as PDMS–PEG copolymer in a voltage-stabilised silicone elastomer may show the favourable combination of high dielectric permittivity and high electrical breakdown strength.
In this work, phase separation as a means of optimising silicone elastomers is explored further by combining two recently synthesised copolymers (PDMS–PEG and PDMS–PPMS copolymers), which have been shown to enhance relative permittivity and electrical breakdown strength, respectively.
2 Experimental
2.1 Materials and methods
Telechelic vinyl-terminated polydimethylsiloxanes and telechelic hydride-terminated polyphenylmethylsiloxanes (used in the synthesis of a PDMS–PPMS copolymer) were DMS-V21 and PMS-H03, with an average molecular weight (Mn) of 6000 and 400 g mol−1, respectively. In the synthesis of the PDMS–PEG copolymer, telechelic hydride-terminated polydimethylsiloxanes (H-PDMS) were DMS-H21, DMS-H11, DMS-H03 and SIH6117.0, with Mn of 6000, 1050, 550 and 208 g mol−1, respectively. All of the abovementioned PDMS copolymers were purchased from Gelest Inc. The catalyst was platinum-divinyl-tetramethyl disiloxane complex [SIP6830.3], containing 3.25% of platinum in xylene, and the cross-linkers were vinyl-functional (4–5% vinylmethylsiloxane)-dimethylsiloxane copolymers [VDT-431] (Mn = 28 kg mol−1, 15-functional) and hydride-functional (45–55% methylhydrosiloxane)-dimethylsiloxane copolymers [HMS-501] (Mn = 1050 g mol−1, 9-functional). Both the catalyst and the cross-linkers were purchased from Gelest Inc. Telechelic vinyl-terminated polyethyleneglycol (V-PEG) was acquired from Sigma Aldrich. Fumed silica (SIS6962.0) and volatile methylsiloxane (VMS) [OS-20] were purchased from Fluorochem and Dow Corning, respectively.The synthesised copolymers were synthesized from telechelic hydride-functional PDMS–PPMS copolymers and telechelic vinyl-functional PDMS–PEG copolymers. The degrees of conversion for the vinyl and hydride PDMS groups from the hydrosilylation reactions of the hydride-terminated PPMS and vinyl-terminated PDMS, and the hydride-terminated PDMS and vinyl-terminated PEG, respectively, were determined through proton nuclear magnetic resonance spectroscopy (1H-NMR), which was performed on a Bruker 300 MHz NMR. The full conversion of hydride and vinyl groups during hydrosilylation reactions was monitored by observing the disappearance of hydride and vinyl peaks. The number of scannings per sample was 128, and sample concentration was 100 mg mL−1 in deuterated chloroform (CDCl3).
The numbers of average molecular weights (Mn) of the copolymers were determined via size-exclusive chromatography (SEC), which was performed on a Viscotek GPCmax VE-2001 instrument equipped with a Viscotek TriSEC Model 302 triple detector, using two PLgel mixed-D columns from Polymer Laboratories. Solutions for SEC containing copolymers dissolved in toluene were prepared in a concentration of 2–3 mg mL−1 and were run at 35 °C at an elution rate of 1 mL min−1. The software for molecular weight distributions was WinGPC Unity 7.4.0 and linear PDMS standards acquired from Polymer Standards Service GmbH.
Measurement of the electrical breakdown strength of thin films with a thickness of less than 135 μm was performed on an in-house-built device based on international standards (IEC 60243-1 (1998) and IEC 60243-2 (2001)). The film was placed on a plastic frame containing 12 holes and subsequently was slid between two metal electrodes which were hemi-spherical and 20 mm in diameter. For each sample, the electrical breakdown strength was measured and repeated 12 times, with a stepwise increasing voltage of 50–100 V per step applied at a rate of 0.5–1 steps s−1. The average electrical breakdown strength from 12 measurements was then quantified as the electrical breakdown strength.
Dielectric properties were measured by dielectric spectroscopy, which was performed on a Novocontrol Alpha-A high-performance frequency analyser (Novo-control Technologies GmbH & Co. KG, Germany). Prior to dielectric measurement, the sample, approximately 1 mm thick, was sandwiched between two gold-coated plates. Dielectric measurement was operated in the frequency range 10−1 to 106 Hz at 23 °C, using an electrode diameter of 20 mm.
For linear viscoelasticity (LVE) properties, prepared films with a 25 mm in diameter were characterised at 23 °C, using an advanced rotational rheometer from TA Instruments (ARES-G2) by means of a parallel plate with a diameter of 25 mm. The axial force ranged from 5 to 12 N for sufficient contact between the plate and the sample. LVE properties were measured in the linear regime at a strain and a frequency of 2% and 10−2 to 102 Hz, respectively.
For stress–strain relationships, ultimate strengths and ultimate strains, as well as the Young's moduli at 5% strain, were measured in extensional rheological tests performed on an ARES-G2 rheometer using a SER2 universal testing platform consisting of two rotating drums 10.3 mm in diameter. The lateral offset of the centre axis of the two rotating drums was 12.7 mm. The sample was prepared in the following dimensions: 6 mm (width), 30 mm (length) and 1 mm (thickness). The ends of the sample were secured by means of strong glue to the surfaces of the rotating drums and then elongated within a confined length by winding up the sample with two rotary drums. Engineering strain and stress were used in the stress–strain relationship and were calculated from the measured Hencky strains and from the measured torque over the cross-sectional area of the sample, respectively (refer to ESI 1, eqn (1)–(5)† for details on engineering stress and strain).
The morphologies of prepared elastomers and the reference elastomer were inspected via scanning electron microscopy (SEM) images, which were performed on an FEI Quanta 200 ESEM FEG. Cross-sectional SEM samples were coated in 2 nm-thick gold by means of a sputter coater (Cressington, model 208HR) under vacuum conditions and a current of 10 mA. A field emission gun with an accelerating voltage between 500 V and 30 kV was applied to detect the element distribution profile on the surface of the samples.
2.2 PDMS–PPMS copolymer synthesis
The procedure used to synthesise the PDMS–PPMS copolymer was taken from A Razak and Skov.21 PDMS–PPMS copolymers were prepared through the hydrosilylation of hydride-terminated PPMS and vinyl-terminated PDMS, as illustrated in Scheme 1. The synthesised copolymer was telechelic hydride-functional. The theoretical number of PDMS–PPMS repeating units in the copolymer (X1) was calculated from the targeted Mn of 30 kg mol−1. The mixture containing DMS-V21, PMS-H03 and a 30 ppm Pt catalyst was speed-mixed at 3000 rpm for 5 min. The stoichiometric ratio for preparing the PDMS–PPMS copolymer (r1) was calculated from the ratio (X1 + 1) to X1.212.3 Synthesis of PDMS–PEG copolymers
PDMS–PEG copolymers were synthesised as described by A Razak et al.16 The theoretical number of PDMS–PEG repeating units in the copolymer (X2) was calculated from Mn of 30 kg mol−1. The stoichiometric ratio for preparing the PDMS–PEG copolymers (r2) was calculated from the ratio (X2 + 1) to X2.16 The synthesis of the PDMS–PEG copolymer was based on the hydrosilylation of hydride-terminated PDMS and vinyl-terminated PEG, as shown in Scheme 2. The synthesised PDMS–PEG copolymers were telechelic vinyl-functional.Various volume fractions of PDMS in the PDMS–PEG copolymer were obtained by varying PDMS chain lengths, i.e. repeating PDMS units (m2) were varied such that m2 = 3, 7, 14, 81, while the number of repeating PEG units remained constant (n2 = 4). The synthesised copolymers were named PDMS3–PEG, PDMS7–PEG, PDMS14–PEG and PDMS81–PEG, respectively.
2.4 Binary copolymer blends and sample preparations
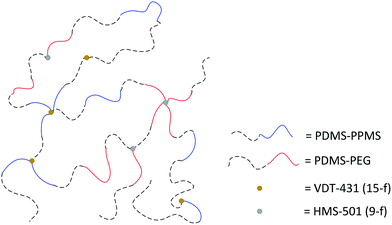
PDMS–PEG copolymers were incorporated into a PDMS–PPMS copolymer in concentrations of 10 and 20 phr before being speed-mixed at 3500 rpm for 2 minutes. The loadings of 10 and 20 phr are considered low and high loadings, respectively. One possible network is illustrated in Fig. 1, such that hydride-functional PDMS–PPMS copolymers may bond covalently to vinyl-functional PDMS–PEG copolymers to form double copolymers, while some of them may cross-link with vinyl-functional cross-linkers (VDT-431) and vinyl-functional PDMS–PEG copolymers cross-link with hydride-functional cross-linkers (HMS-501). The stoichiometric ratio for both cross-linking reactions between PDMS–PPMS and VDT-431, and between PDMS–PEG and HMS-501 were 1.5.16,21 Blends containing copolymers, cross-linkers, 30 ppm of Pt catalyst, 25 parts per hundred rubber (phr) of silica and 25 phr of VMS solvent (OS-20 from Dow Corning) were speed-mixed at 3000 rpm for 4 minutes.The final mixtures were cast on Teflon substrates for easy release, and the films were prepared at thicknesses of approximately 1 ± 0.5 mm and 100 ± 35 μm, as thick and thin films, respectively. Thin films were used for the measurement of electrical breakdown strength and thick films were used for measurements of linear viscoelasticity (LVE), the stress–strain relationship and dielectric properties. All films were placed in a vacuum oven at 23 °C for 2 hours and were subsequently cured at 40 °C for 12 hours for proper film formation. The samples were placed in the oven at 150 °C for 5–8 hours and subsequently post-cured at 200 °C for 2 hours.
The cross-linked PDMS–PPMS copolymer containing 80 repeating DMS units and two repeating PMS units, referred to as 80DMS_2PMS. 80DMS_2PMS, was used as the reference elastomer and was prepared without incorporating the PDMS–PEG copolymer. Due to its proven versatility as a voltage-stabilised silicone elastomer, 80DMS_2PMS was utilised in all prepared binary copolymer blends (BCBs). Furthermore, 80DMS_2PMS has been proven to possess the most increased electrical breakdown strength compared to other PDMS–PPMS elastomers.21 Details of the cross-linked BCBs containing 80DMS_2PMS and PDMS–PEG copolymers, and the reference elastomer, are shown in Table 1.
| No. | PDMS–PEG copolymer | Samples | |
|---|---|---|---|
| Concentration (phr) | PDMSxx–PEGa | ||
| a xx is the PDMS chain length. | |||
| 1 | — | — | 80DMS_2PMS (reference) |
| 2 | 10 | PDMS81–PEG | 10 phr PDMS81–PEG BCB |
| 3 | 20 | 20 phr PDMS81–PEG BCB | |
| 4 | 10 | PDMS14–PEG | 10 phr PDMS14–PEG BCB |
| 5 | 20 | 20 phr PDMS14–PEG BCB | |
| 6 | 10 | PDMS7–PEG | 10 phr PDMS7–PEG BCB |
| 7 | 20 | 20 phr PDMS7–PEG BCB | |
| 8 | 10 | PDMS3–PEG | 10 phr PDMS3–PEG BCB |
| 9 | 20 | 20 phr PDMS3–PEG BCB | |
3 Results and discussion
A cross-linked binary copolymer blend consisting of PDMS–PPMS and PDMS–PEG copolymers can potentially assemble into several distinct morphologies or combinations thereof. The targeted morphology of the binary system of copolymer blends containing PDMS–PEG and PDMS–PPMS copolymers is a well-defined structure forming a continuous PDMS-rich phase and discontinuous phases of PEG and PPMS, as illustrated in Fig. 2. Alternatively no microscopic phase separation is desirable. However, with silicone polymers (and thus elastomers) this is very difficult – if not unrealistic – to achieve a completely homogeneous blend which is crosslinked into a likewise homogeneous network.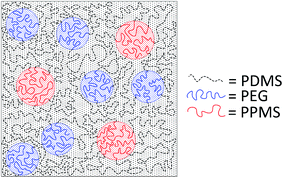 | ||
| Fig. 2 Illustration of silicone copolymers prepared by phase-separation of PDMS–PEG copolymer in a PDMS–PPMS matrix by means of a binary system of copolymer blends. | ||
3.1 Synthesised PDMS–PPMS copolymer (80DMS_2PMS)
It has been shown previously that PDMS–PPMS copolymers possess excellent mechanical properties when they are cross-linked with a vinyl-functional cross-linker.21 All vinyl groups of PDMS were consumed during the hydrosilylation of vinyl-terminated PDMS and hydride-terminated PPMS, which was confirmed by the disappearance of the Si–CH2![[double bond, length as m-dash]](https://www.rsc.org/images/entities/char_e001.gif) CH2 bond signal at 5.8–6.2 ppm in the 1H-NMR spectra (refer to ESI 2 for NMR spectra in Fig. S1†). The synthesised PDMS–PPMS copolymer was telechelic hydride-functional. The determined molecular weight of 80DMS_2PMS was 32 kg mol−1, while the molar concentration of phenyl groups of 80DMS_2PMS was 8.8 × 10⁻⁴ g mol−1, determined from NMR integration areas.21 A PDMS–PPMS copolymer containing a PDMS chain length of m1 = 80 and a PPMS chain length of n1 = 2 (80DMS_2PMS) was used in all cross-linked binary copolymer blends (BCBs), due to the highest electrical breakdown strength (EBD = 72 V μm−1) of the tested elastomers.
CH2 bond signal at 5.8–6.2 ppm in the 1H-NMR spectra (refer to ESI 2 for NMR spectra in Fig. S1†). The synthesised PDMS–PPMS copolymer was telechelic hydride-functional. The determined molecular weight of 80DMS_2PMS was 32 kg mol−1, while the molar concentration of phenyl groups of 80DMS_2PMS was 8.8 × 10⁻⁴ g mol−1, determined from NMR integration areas.21 A PDMS–PPMS copolymer containing a PDMS chain length of m1 = 80 and a PPMS chain length of n1 = 2 (80DMS_2PMS) was used in all cross-linked binary copolymer blends (BCBs), due to the highest electrical breakdown strength (EBD = 72 V μm−1) of the tested elastomers.
3.2 Synthesised PDMS–PEG copolymers
The disappearance of the Si–H bond signal at 4.70 ppm was checked by 1H-NMR for a complete conversion of hydride PDMS groups in the hydrosilylation of hydride-terminated PDMS and vinyl-terminated PEG; refer to ESI 2 for NMR spectra in Fig. S2–S5.† Determined molecular weights from the SEC of PDMS–PEG copolymers PDMS81–PEG, PDMS14–PEG, PDMS7–PEG and PDMS3–PEG were 49, 29, 3 and 5 kg mol−1, respectively.3.3 Linear viscoelasticity
To evaluate the effect of loading different types of PDMS–PEG copolymers on viscoelastic properties, the prepared elastomers were characterised rheologically, as shown in Fig. 3. They are well cross-linked and behave elastically, i.e. the incorporation of PDMS–PEG copolymer into the BCB does not destabilise the PDMS–PPMS elastomers. The resulting storage moduli (G′) for all prepared cross-linked BCBs and the reference are between 104 and 106 Pa. The cross-linked BCBs with 10 and 20 phr of PDMS81–PEG are the most rigid elastomers compared to other prepared elastomers and the reference elastomer, revealing that the elastomers have PEG-like properties, due to the semi-crystalline PEG acting as a reinforcing domain in the matrix. All prepared cross-linked BCBs and reference elastomer possess close-to-identical viscoelastic relaxations. Relative losses [tan(δ)] for all elastomers are low and are comparable to that of Elastosil RT625 (a commercial silicone elastomer from Wacker Chemie)1 as well as that of the reference elastomer. It is obvious from Fig. 3 that all of the prepared elastomers maintain their network integrity in the small deformation regime.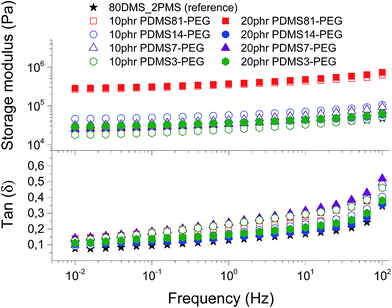 | ||
| Fig. 3 The storage modulus and tan(δ) of prepared voltage-stabilised elastomers with different types and concentrations of PDMS–PEG copolymers at 23 °C. | ||
3.4 Stress–strain relationship
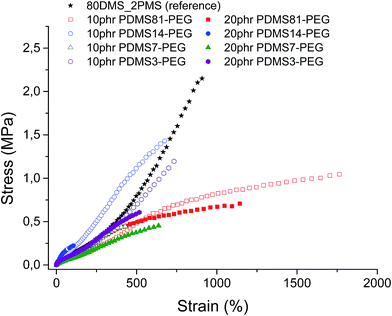
Stress–strain curves and the Young's moduli of prepared samples are shown in Fig. 4 and Table 2, respectively. It is evident from Fig. 4 that all prepared samples and the reference elastomer have reduced their strain-hardening behaviour compared to the reference. The cross-linked BCBs with 10 and 20 phr of PDMS81–PEG show the most increased ultimate strain together with a stress-softening behaviour, indicating the irreversibility of the stress-behaviour of the thermoplastic part of the elastomer arising from the crystallinity of the PEG-rich domains (refer to Fig. 4). Furthermore, most elastomers mentioned herein possess higher or comparable ultimate strains than that of the VHB 4910 elastomer from 3 M, where VHB 4910 possesses an ultimate strain of 800%, as reported by Tugui et al.26 On the other hand, the cross-linked BCB with 20 phr of PDMS14–PEG shows very low ultimate strain, indicating that the high loading of the PDMS14–PEG copolymer deteriorates network integrity, due to the macroscopic phase separation of PEG domains in the copolymer blend matrix.| Sample | Young's modulus, Y (MPa) |
|---|---|
| 0 phr PDMS–PEG (reference) | 0.41 ± 0.05 |
| 10 phr PDMS81–PEG BCB | 0.45 ± 0.08 |
| 20 phr PDMS81–PEG BCB | 0.25 ± 0.05 |
| 10 phr PDMS14–PEG BCB | 0.43 ± 0.05 |
| 20 phr PDMS14–PEG BCB | 0.58 ± 0.13 |
| 10 phr PDMS7–PEG BCB | 0.30 ± 0.10 |
| 20 phr PDMS7–PEG BCB | 0.21 ± 0.03 |
| 10 phr PDMS3–PEG BCB | 0.34 ± 0.06 |
| 20 phr PDMS3–PEG BCB | 0.36 ± 0.05 |
All cross-linked BCBs show decreased ultimate strength compared to the reference elastomer. Cross-linking with 10 phr of PDMS14–PEG results in the most increased ultimate stress compared to other cross-linked BCBs, due to semi-crystalline PEGs acting as reinforcing domains.
Obviously, the resulting Young's moduli of all cross-linked BCBs are low, as well as that of the reference elastomer, as shown in Table 2. In comparison to the commercial silicone elastomer (RT625 from Wacker Chemie, Y = 1 MPa), all cross-linked BCBs and the reference elastomer are softer.
3.5 Dielectric properties
The conductivity and dielectric properties of the prepared elastomers are shown in Fig. 5 and 6, respectively. The resulting conductivities indicate that none of elastomers is conductive. The resulting conductivity of the cross-linked BCB with 20 phr of PDMS3–PEG indicates increased relaxation occurring at the frequencies 100 to 102 Hz, compared to other cross-linked BCBs and the reference elastomer, which may indicate a local phase separation of PEG-rich domains.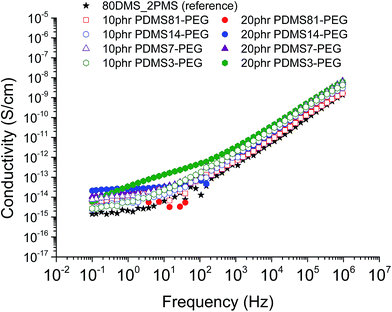 | ||
| Fig. 5 The conductivity of 80DMS_2PMS elastomers with different concentrations of PDMS–PEG copolymers at 23 °C. | ||
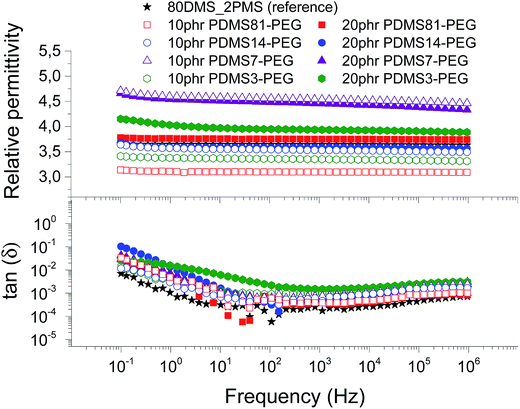 | ||
| Fig. 6 The dielectric properties of 80DMS_2PMS elastomers with different concentrations of PDMS–PEG copolymers at 23 °C. | ||
The resulting relative permittivity for the prepared elastomers with a low loading (10 phr) of PDMS–PEG copolymers is lower than the reference elastomer, except the cross-linked BCBs with 10 phr of PDMS7–PEG, which shows increased relative permittivity, improving by 27%. For the prepared elastomers with a high loading (20 phr) of PDMS–PEG copolymers, the relative permittivities are almost higher than the reference elastomer, whereby the cross-linked copolymer with 20 phr of PDMS7–PEG has the highest relative permittivity. Fig. 6 clearly shows that the cross-linked copolymers with low and high loadings of PDMS7–PEG possess increased relative permittivity, compared to the other elastomers and the reference. The phase separation of PDMS–PEG copolymers in the PDMS–PPMS matrix seems to occur on the micro- or nanoscopic scale, since the elastomers are macroscopically homogenous, as observed from light microscopy.
Dielectric losses, here represented by tan(δ), are relatively low for all cross-linked copolymers as well as the reference elastomer (see Fig. 6). Similar to the relaxation in Fig. 5, the cross-linked BCB with 20 phr of PDMS3–PEG shows increased relaxation occurring at the same frequency.
SEM imaging shows obviously different morphologies for prepared elastomers, as illustrated in Fig. 7. The SEM image of the cross-linked BCB with 20 phr of PDMS7–PEG shows clearly distinct PEG rich domains (white circles), which are well-distributed in the PDMS matrix, thereby indicating that a homogeneous elastomer on the macroscopic scale has been obtained (see Fig. 7b). On the other hand, SEM imaging of the reference elastomer shows the presence of PDMS and PPMS rich domains in the matrix (see Fig. 7a). Furthermore, the reference elastomer has a triangular pattern (PDMS rich domain) and that of a bent rectangle (PPMS rich domain), which is agrees with the SEM image of the cross-linked PDMS–PPMS copolymer21 (see Fig. 7a). Other SEM images of prepared elastomers, which show different morphologies, can be seen in ESI 3, Fig. S6.†
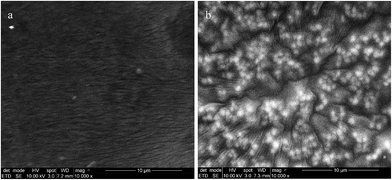 | ||
| Fig. 7 SEM pictures of two representative samples, namely (a) 80DMS_2PMS (reference elastomer) and (b) binary copolymer blends with 20 phr of PDMS7–PEG. | ||
For the reference elastomer, the PDMS-rich domains enhance elastomer softness, whilst PPMS domains which act as rigid zones reinforce the network, thus resulting in an elastomer with increased ultimate stress and increased ultimate strain, as shown in Table 3.
| Sample | Young's modulus (MPa) | Relative permittivity | Ultimate stress (MPa) | Ultimate strain (%) |
|---|---|---|---|---|
| 80DMS_2PMS (reference) | 0.41 ± 0.05 | 3.71 | 1.86 ± 0.31 | 967 ± 33 |
| 10 phr PDMS81–PEG BCB | 0.45 ± 0.08 | 3.14 | 1.10 ± 0.10 | 1748 ± 40 |
| 20 phr PDMS81–PEG BCB | 0.25 ± 0.05 | 3.78 | 0.74 ± 0.02 | 1164 ± 17 |
| 10 phr PDMS14–PEG BCB | 0.43 ± 0.05 | 3.64 | 1.57 ± 0.12 | 635 ± 52 |
| 20 phr PDMS14–PEG BCB | 0.58 ± 0.13 | 3.67 | 0.25 ± 0.03 | 104 ± 1 |
| 10 phr PDMS7–PEG BCB | 0.30 ± 0.10 | 4.71 | 0.40 ± 0.03 | 431 ± 19 |
| 20 phr PDMS7–PEG BCB | 0.21 ± 0.03 | 4.66 | 0.42 ± 0.04 | 552 ± 103 |
| 10 phr PDMS3–PEG BCB | 0.34 ± 0.06 | 3.41 | 1.14 ± 0.10 | 724 ± 40 |
| 20 phr PDMS3–PEG BCB | 0.36 ± 0.05 | 4.15 | 0.56 ± 0.03 | 491 ± 43 |
3.6 Electrical breakdown and Weibull analysis
The influence of the different PDMS–PEG copolymer and their concentrations in cross-linked BCBs on electrical breakdown strength was investigated. The thicknesses of the prepared samples were in the range of 81 to 135 μm. The resulting electrical breakdown strengths of prepared elastomers incorporating PDMS–PEG copolymers are shown in Table 4. The cross-linked BCBs with 10 and 20 phr of PDMS14–PEG possess the highest electrical breakdown strength, namely 80 ± 5 and 81 ± 18 V μm−1, respectively, improving by approximately 10% compared to the reference elastomer. Increased electrical breakdown is most likely due to the synergistic effect of the favourable phase separation of PEG and voltage stabilisation. Moreover, the cross-linked BCBs with PDMS7–PEG and PDMS3–PEG with a loading of 20 phr possess increased electrical breakdown strength compared to the reference elastomer. Clearly, the incorporation of PDMS81–PEG in the BCB decreases electrical breakdown strength (see Table 4), which indicates that PDMS81–PEG may destabilise voltage stabilisation and hence deteriorate the charge trapping effect caused by the π-electrons of phenyl groups.| Cross-linked PDMS–PPMS copolymer (80DMS_2PMS) | Electrical breakdown strength (V μm−1) | Weibull β-parameter | Weibull η-parameter | R2 | Normalised electrical breakdown strength |
|---|---|---|---|---|---|
| 0 phr PDMS–PEG (reference) | 72 ± 3 | 26 | 73 | 0.93 | 71.9 ± 3.1 |
| 10 phr PDMS81–PEG | 61 ± 8 | 9 | 64 | 0.89 | 61.1 ± 7.8 |
| 20 phr PDMS81–PEG | 54 ± 2 | 36 | 55 | 0.96 | 54.3 ± 1.7 |
| 10 phr PDMS14–PEG | 80 ± 5 | 19 | 82 | 0.84 | 80.5 ± 5.2 |
| 20 phr PDMS14–PEG | 81 ± 18 | 5 | 88 | 0.93 | 82.9 ± 18.8 |
| 10 phr PDMS7–PEG | 64 ± 2 | 38 | 65 | 0.70 | 64.3 ± 2.3 |
| 20 phr PDMS7–PEG | 76 ± 3 | 34 | 77 | 0.89 | 76.4 ± 2.6 |
| 10 phr PDMS3–PEG | 63 ± 9 | 7 | 67 | 0.94 | 60.6 ± 8.7 |
| 20 phr PDMS3–PEG | 74 ± 3 | 30 | 75 | 0.76 | 73.7 ± 3.0 |
The electrical reliability of the prepared elastomers was investigated via Weibull analysis. The β-parameter, the Weibull shape parameter, was determined from the slope of the Weibull plot of failure probability versus electrical breakdown strength. The η-parameter, the Weibull scale parameter, was determined at the point at which failure probability, ln[−ln(1 − F)], was 63.2%.16 Due to different film thicknesses, the determined electrical breakdown strengths were normalised, based on a reference thickness for better comparison. Normalised dielectric breakdown strengths were calculated using the equation of normalised electrical breakdown strength verified by Zakaria et al.27 The reference thickness for normalisation was 100 μm. The results for the Weibull η- and β-parameters, R2 of the linear fits for cross-linked copolymers and normalised electrical breakdown strength are presented in Table 4. The values of the coefficient of determination (R2) for all investigated elastomers are above 0.80, excluding elastomers with 10 phr of PDMS7–PEG and 20 phr of PDMS3–PEG. A coefficient of determination above 0.85 indicates that the measured electrical breakdown strength correlates well with the fitted regression lines.21 Cross-linked BCBs with 20 phr of PDMS81–PEG, 10 and 20 phr of PDMS7–PEG, 20 phr of PDMS3–PEG and the reference elastomer possess a high β-parameter, thereby indicating that electrical breakdown occurrences are narrowly dispersed and hence homogenous elastomers are obtained. The β-parameters of elastomers with the most increased electrical breakdown strength (10 and 20 phr of PDMS14–PEG BCBs) are lower than the β-parameter of the reference elastomer.
Thus far, combining the results for relative permittivity, electrical breakdown strength and Young's modulus, the cross-linked BCB with 20 phr of PDMS7–PEG possesses the most enhanced electrical properties (εr = 4.66, EBD = 76 ± 3 V μm−1) as well as inherent softness (Y = 0.21 ± 0.03 MPa). This elastomer is also the only investigated elastomer formulation which shows overall excellent properties and it gives a very clear indication of the complicated interplay of nano-scopic phase separation and electro-mechanical properties.
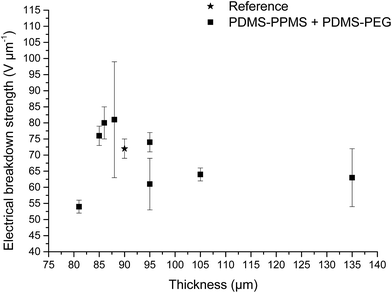
Increased electrical breakdown strength may have been established as the result of either an increased Young's modulus17 or voltage stabilisation.21 Further investigation into electrical breakdown was performed to evaluate whether increased electrical breakdown strength is the effect of changes in other properties, e.g. increased stiffness, increased relative permittivity or increased stretchability. The influences of the Young's modulus and relative permittivity on electrical breakdown strength are shown in Fig. 8, and 9. No obvious trend can been seen in Fig. 8 for increased electrical breakdown strength as a function of elastic modulus, indicating strongly that the increased electrical breakdown strength of all prepared elastomers is due to the synergistic effect of voltage stabilisation and/or the favourable phase separation of PEGs rather than due to increased stiffness and thus resistance towards actuation. No clear trend can be observed for electrical breakdown strength versus relative permittivity, indicating that the increased electrical breakdown strength is not due to increased relative permittivity (see Fig. 9). Likewise the effect of film thickness on electrical breakdown strength was investigated in order to eliminate all possible experimental artefacts. Again, there is no obvious correlation as observed from Fig. 10 which again confirms that the voltage stabilization is an electrical effect.
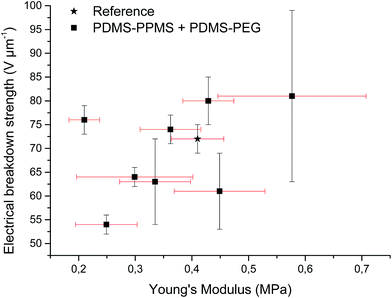 | ||
| Fig. 8 Electrical breakdown strength versus Young's modulus. Existing theories predict a linear4 or even an exponential increase28 of the electrical breakdown strength with the Young's modulus. This is obviously not valid for the investigated phase-separating system. | ||
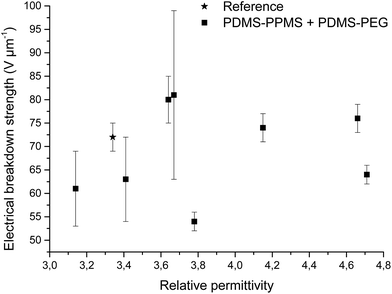 | ||
| Fig. 9 Electrical breakdown strength versus relative permittivity. Existing theories predict that the electrical breakdown strength scales with the square root of dielectric permittivity.29 | ||
The theoretical actuation strains were calculated from the actuation equation,30 by assuming the maximum applicable electrical field, i.e. electrical breakdown strength can be realized and the elastomer does not break down mechanically or electro-mechanically before electrically.21 Theoretical actuation strains and measured ultimate strains are shown in Table 5. The elastomer with 10 phr of PDMS81–PEG, which is highly extensible, shows the lowest theoretical actuation strain compared to the other elastomers. No correlation can be made from Table 5 about the dependence of theoretical actuation strain on ultimate strain. Previous theory predicts that the maximum actuation strain may be achieved for the elastomer which is highly extensible.21 However, a large actuation strain is also influenced by other parameters such as increased electrical breakdown strength and increased relative permittivity. Obviously, elastomers with decreased ultimate strain, such as the example with 20 phr of PDMS14–PEG, may break down mechanically before they break down electrically (see Table 5). However, it is obvious that this type of silicone elastomer is in general more stretchable than the maximum actuation demands.
| Sample | Theoretical actuation strain (%) | Ultimate strain (%) |
|---|---|---|
| 80DMS_2PMS (reference) | 600 | 967 ± 33 |
| 10 phr PDMS81–PEG BCB | 366 | 1748 ± 40 |
| 20 phr PDMS81–PEG BCB | 629 | 1164 ± 17 |
| 10 phr PDMS14–PEG BCB | 769 | 635 ± 52 |
| 20 phr PDMS14–PEG BCB | 590 | 104 ± 1 |
| 10 phr PDMS7–PEG BCB | 928 | 431 ± 19 |
| 20 phr PDMS7–PEG BCB | 1821 | 552 ± 103 |
| 10 phr PDMS3–PEG BCB | 578 | 724 ± 40 |
| 20 phr PDMS3–PEG BCB | 881 | 491 ± 43 |
4 Conclusions
A soft elastomer with high extensibility was prepared from phase-separating a PDMS–PEG copolymer in a binary copolymer blend consisting of a PDMS–PPMS copolymer as the primary copolymer. The elastomer possessed simultaneously increased relative permittivity and electrical breakdown. The increased electrical breakdown strength is due to voltage stabilisation arising from the phenyl groups of PPMS, while increased relative permittivity without achieving conductivity is due to the favourable phase separation of PEG constituents in the binary copolymer blend matrix. Thereby a facile method towards soft, reliable elastomers with good electrical properties allowing for large-strain actuation has been shown.Acknowledgements
The Malaysian Ministry of Education (MoE) and Universiti Tun Hussein Onn Malaysia (UTHM) are gratefully acknowledged for their funding.References
- F. B. Madsen, A. E. Daugaard, S. Hvilsted and A. L. Skov, Macromol. Rapid Commun., 2016, 37, 378–413 CrossRef CAS PubMed.
- P. Brochu and Q. Pei, Macromol. Rapid Commun., 2010, 31, 10–36 CrossRef CAS PubMed.
- A. L. Larsen, P. Sommer-Larsen and O. Hassager, Proc. SPIE, 2004, 5385, 108–117 CrossRef CAS.
- L. Yu and A. L. Skov, Int. J. Smart Nano Mater., 2015, 6, 268–289 CrossRef CAS.
- Z. Suo, Acta Mech. Solida Sin., 2010, 23, 549–577 CrossRef.
- S. Vudayagiri, Large scale processing of dielectric electroactive polymers, Ph.D. thesis, Technical University of Denmark, Lyngby Denmark, 2014.
- Z. Zhang, L. Liu, J. Fan, K. Yu, Y. Liu, L. Shi and J. Leng, Proc. SPIE, 2008, 6926, 692610 CrossRef.
- L. J. Romasanta, P. Leret, L. Casaban, M. Hernández, M. A. de la Rubia, J. F. Fernández, J. M. Kenny, M. A. Lopez-Manchado and R. Verdejo, J. Mater. Chem., 2012, 22, 24705–24712 RSC.
- A. Bele, M. Dascalu, C. Tugui, M. Iacob, C. Racles, L. Sacarescu and M. Cazacu, Mater. Des., 2016, 106, 454–462 CrossRef CAS.
- H. Böse, D. Uhl and R. Rabindranath, Proc. SPIE, 2012, 8340, 83402E CrossRef.
- B. Kussmaul, S. Risse, G. Kofod, R. Waché, M. Wegener, D. N. McCarthy, H. Krüger and R. Gerhard, Adv. Funct. Mater., 2011, 21, 4589–4594 CrossRef CAS.
- F. B. Madsen, A. E. Daugaard, S. Hvilsted, M. Y. Benslimane and A. L. Skov, Smart Mater. Struct., 2013, 22, 1–11 CrossRef.
- F. B. Madsen, I. Javakhishvili, R. E. Jensen, A. E. Daugaard, S. Hvilsted and A. L. Skov, Polym. Chem., 2014, 5, 7054–7061 RSC.
- P. Mazurek, S. Hvilsted and A. L. Skov, Polymer, 2016, 87, 1–7 CrossRef CAS.
- P. Mazurek, L. Yu, R. Gerhard, W. Wirges and A. L. Skov, J. Appl. Polym. Sci., 2016, 133, 44153 CrossRef.
- A. H. A Razak, P. Szabo and A. L. Skov, RSC Adv., 2015, 5, 53054–53062 RSC.
- S. Vudayagiri, S. Zakaria, L. Yu, S. S. Hassouneh, M. Benslimane and A. L. Skov, Smart Mater. Struct., 2014, 23, 105017 CrossRef.
- V. Englund, R. Huuva, S. M. Gubanski and T. Hjertberg, Polym. Degrad. Stab., 2009, 94, 823–833 CrossRef CAS.
- Y. Yamano, IEEE Trans. Dielectr. Electr. Insul., 2006, 13, 773–781 CrossRef CAS.
- Y. Yamano and H. Endoh, IEEE Trans. Dielectr. Electr. Insul., 1998, 5, 270–275 CrossRef CAS.
- A. H. A. Razak and A. L. Skov, RSC Adv., 2017, 7, 468–477 RSC.
- Y. Li, K. Hu, X. Han, Q. Yang, Y. Xiong, Y. Bai, X. Guo, Y. Cui, C. Yuan, H. Ge and Y. Chen, Langmuir, 2016, 32, 3670–3678 CrossRef CAS PubMed.
- J. Raczkowska, A. Bernasik, A. Budkowski, K. Sajewicz, B. Penc, J. Lekki, M. Lekka, J. Rysz, K. Kowalski and P. Czuba, Macromolecules, 2004, 37, 7308–7315 CrossRef CAS.
- H. Jinnai, Y. Nishikawa, T. Koga and T. Hashimoto, Macromolecules, 1995, 28, 4782–4784 CrossRef CAS.
- S. Walheim, M. Ramstein and U. Steiner, Langmuir, 1999, 15, 4828–4836 CrossRef CAS.
- C. Tugui, S. Vlad, M. Iacob, C. D. Varganici, L. Pricop and M. Cazacu, Polym. Chem., 2016, 7, 2709–2719 RSC.
- S. Zakaria, P. H. F. Morshuis, M. Y. Benslimane, L. Yu and A. L. Skov, Smart Mater. Struct., 2015, 24, 55009 CrossRef.
- G. Kofod, P. Sommer-Larsen, R. Kornbluh and R. Pelrine, J. Intell. Mater. Syst. Struct., 2003, 14, 787–793 CrossRef CAS.
- K. H. Stark and C. G. Garton, Nature, 1955, 176, 1225–1226 CrossRef.
- R. Pelrine, R. Kornbluh, Q. Pei and J. Joseph, Science, 2000, 287, 836–839 CrossRef CAS PubMed.
Footnote |
| † Electronic supplementary information (ESI) available. See DOI: 10.1039/c7ra02620j |
| This journal is © The Royal Society of Chemistry 2017 |


