 Open Access Article
Simple method for O-GlcNAc sensitive detection based on graphene quantum dots†
Li Gao a,
Yiwen Wanga,
Mei Lua,
Mengmei Faa,
Dingding Yanga and
Xin Yao
 *ab
*ab
aSchool of Chemistry and Chemical Engineering, University of Chinese Academy of Sciences, Beijing100049, PR China. E-mail: yaox@ucas.ac.cn; Fax: +86 10 69672552; Tel: +86 10 69672552
bState Key Laboratory of Natural and Biomimetic Drugs, Peking University, Beijing 100191, PR China
First published on 16th June 2017
Abstract
Recent studies have reported that abnormal levels of O-GlcNAc are involved in several diseases (e.g. cancer, diabetes and Alzheimer's disease, etc.). Therefore, the detection of O-GlcNAc has attracted numerous researchers' attention for the early clinical diagnosis of these diseases. Recently, graphene quantum dots (GQDs) have been widely used for the analysis of biomolecules because of their easy preparation and strong and stable fluorescence signal. Herein, we describe a simple and sensitive method for O-GlcNAc detection that first uses the GQDs in combination with wheat germ agglutinin (WGA) as fluorescence probes. The recognition between O-GlcNAc and WGA resulted in the decrease of fluorescence intensity, the signal decreased with the increased concentration of O-GlcNAc. The linear response range is from 5 to 200 pg mL−1 with a detection limit of 0.8 pg mL−1. The selectivity of this method has also been investigated. Finally, this sensing system was used to detect O-GlcNAc on α-crystallin protein and cancer cells lysate. The result suggests the potential application of this simple, high sensitivity sensing system to directly diagnose O-GlcNAc-related diseases that are a serious threat to the human health.
1. Introduction
O-Linked-N-acetylglucosamine (O-GlcNAc) is a modification protein, which transfers a single N-acetylglucosamine (GlcNAc) moiety to the serine or threonine residues of cytoplasmic and nuclear proteins.1,2 Unlike other carbohydrate modifications, O-GlcNAcylation is found in the nuclear and cytoplasmic proteins3 rather than in the endoplasmic reticulum and Golgi apparatus.4 During the past 30 years of O-GlcNAc study, it has been demonstrated that the variety of O-GlcNAcylated proteins are crucial for cell survival and play an important role in biological systems such as glucose homeostasis,5 cell cycle,6 apoptosis7 and signal transduction.8 In addition, the deregulation of O-GlcNAc levels has been associated with various diseases, including Alzheimer's disease,9 breast cancer,10 diabetes,11 and cardiovascular diseases.12–14 Researchers suggest that an abnormal level of O-GlcNAc can be used to facilitate the clinical diagnosis of these diseases.15,16However, the detection of O-GlcNAc is a challenging task for the following reasons.17 First, different from other glycosylations, the O-GlcNAc is found primarily in the nuclear and cytoplasmic proteins, which are difficult to detect from the outside of the cells. Second, the O-glycosidic bond is more labile, which makes accurate detection of O-GlcNAc more difficult. Third, because of the low stoichiometry of the O-GlcNAc sites, sensitive detection methods for O-GlcNAc are needed.18,19 Several powerful methods have been developed for O-GlcNAc detection, which are aimed at solving these problems.1,20–22 Along with increasing interest in click-chemistry, protein-labeling methods have attracted increasing attention for O-GlcNAc detection and site identification inside the cells. Vocadlo et al. detected O-GlcNAc in Jurkat cells using O-GlcNAc transferase (OGT) to transfer the azide-containing GlcNAc analog (GlcNAz) to O-GlcNAcylation protein substrates.23 Utilizing the interaction between the azide and phosphine group, biotin–phosphine could be modified on to the protein substrates. Then, streptavidin–HPR could link with the O-GlcNAcylation protein substrates by interacting with biotin–phosphine. Therefore, the amount of O-GlcNAc could be detected using the HRP enzyme catalysis. Though this method could detect O-GlcNAc inside the cells, the utilization efficiency of OGT enzyme is insufficient. Qasba et al. synthesized a novel chemical enzyme (Y298L GalT) that could transfer UDP-GalNAc to O-GlcNAc residues, where the high catalytic activity of Y298L GalT greatly enhances the sensitivity of O-GlcNAc detection.21 Polyethylene glycol (PEG) can be used as the mass tag for O-GlcNAc detection.19 In all the above studies, after the labeling of O-GlcNAc samples inside the cells, the cells were put on SDS-PAGE to detect O-GlcNAcylated proteins through the western blot methods. In addition, the labeling methods are time-consuming and complicated, and harmful reagents are used during the synthesis process. Aimed at the low stoichiometry of O-GlcNAc modification, O-GlcNAc highly specific mouse monoclonal antibodies,24 RL-2![[thin space (1/6-em)]](https://www.rsc.org/images/entities/char_2009.gif) 25 and CTD110.6
25 and CTD110.6![[thin space (1/6-em)]](https://www.rsc.org/images/entities/char_2009.gif) 26 have been used for the enrichment of O-GlcNAc modification proteins. Though the sensitivity was greatly increased through the enrichment method, the antibodies suffered from weak affinity,27 poor specificity21 and limited utilization because of the demands of the peptide sequence.15 In addition to antibody enrichment, lectins have also been used to enrich glycoproteins because of their specific binding interactions with O-GlcNAc. The most commonly used O-GlcNAc-binding lectin is WGA.22,28,29 Vosseller et al. reported the method of enrichment of O-GlcNAcylayted peptides through a WGA affinity column, and then used collision-induced dissociation mass spectrometry (CID-MS) to identify the O-GlcNAcylated peptides from a mouse brain post-synaptic density.22 MS methods are used to detect O-GlcNAc through the analysis of the fragmentation masses without labeling27,30,31 compared to western blot, while the CID-MS is a vibrational activation fragmentation process that breaks the weakest bonds in the structure. As mentioned above, the O-glycosidic bond is labile, which makes accurate detection of O-GlcNAc more difficult. Chalkley et al. reported the electron transfer dissociation (ETD) MS method to detect O-GlcNAc based on WGA enrichment.32 This method can accurately detect O-GlcNAc and avoid breaking of the O-glycosidic bond because the O-glycosidic bond is stable under ETD-MS conditions, whereas the peptide splits into lots of fragments in the MS analysis, which makes the identification of O-GlcNAc difficult. Then, considering the complex structure of proteins, there should be more fragments obtained during the detection process, making the spectrogram analysis to identify O-GlcNAc more difficult. Furthermore, Maury et al. investigated a targeted method multiple reaction monitoring mass spectrometry (MRM-MS) to detect and quantify native O-GlcNAc-modified peptides from a complex mixture without enrichment and labeling.31 MRM-MS exploited the unique capabilities of triple quadrupole (QQQ) MS that can simplify the experimental steps and the processes of data analysis by recognizing the targeted peptides. However, the peptide sequence must be known in advance. The absence of peptide sequence information of complex biological samples makes the detection and quantification of O-GlcNAc impossible with MRM-MS.33 In addition, the instrument is relatively expensive compared to other instruments. In summary, methods of detection of O-GlcNAc suffer from low-sensitivity, are complicated, expensive, make it difficult to analyse the data and so on. The development of a simple, higher-sensitivity and lower-cost method for O-GlcNAc analysis is still necessary.
26 have been used for the enrichment of O-GlcNAc modification proteins. Though the sensitivity was greatly increased through the enrichment method, the antibodies suffered from weak affinity,27 poor specificity21 and limited utilization because of the demands of the peptide sequence.15 In addition to antibody enrichment, lectins have also been used to enrich glycoproteins because of their specific binding interactions with O-GlcNAc. The most commonly used O-GlcNAc-binding lectin is WGA.22,28,29 Vosseller et al. reported the method of enrichment of O-GlcNAcylayted peptides through a WGA affinity column, and then used collision-induced dissociation mass spectrometry (CID-MS) to identify the O-GlcNAcylated peptides from a mouse brain post-synaptic density.22 MS methods are used to detect O-GlcNAc through the analysis of the fragmentation masses without labeling27,30,31 compared to western blot, while the CID-MS is a vibrational activation fragmentation process that breaks the weakest bonds in the structure. As mentioned above, the O-glycosidic bond is labile, which makes accurate detection of O-GlcNAc more difficult. Chalkley et al. reported the electron transfer dissociation (ETD) MS method to detect O-GlcNAc based on WGA enrichment.32 This method can accurately detect O-GlcNAc and avoid breaking of the O-glycosidic bond because the O-glycosidic bond is stable under ETD-MS conditions, whereas the peptide splits into lots of fragments in the MS analysis, which makes the identification of O-GlcNAc difficult. Then, considering the complex structure of proteins, there should be more fragments obtained during the detection process, making the spectrogram analysis to identify O-GlcNAc more difficult. Furthermore, Maury et al. investigated a targeted method multiple reaction monitoring mass spectrometry (MRM-MS) to detect and quantify native O-GlcNAc-modified peptides from a complex mixture without enrichment and labeling.31 MRM-MS exploited the unique capabilities of triple quadrupole (QQQ) MS that can simplify the experimental steps and the processes of data analysis by recognizing the targeted peptides. However, the peptide sequence must be known in advance. The absence of peptide sequence information of complex biological samples makes the detection and quantification of O-GlcNAc impossible with MRM-MS.33 In addition, the instrument is relatively expensive compared to other instruments. In summary, methods of detection of O-GlcNAc suffer from low-sensitivity, are complicated, expensive, make it difficult to analyse the data and so on. The development of a simple, higher-sensitivity and lower-cost method for O-GlcNAc analysis is still necessary.
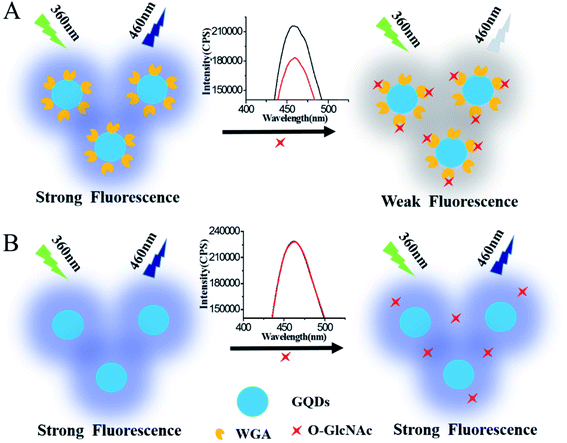
Recently, GQDs were widely used in the detection of biological molecules34–38 because of their strong and stable fluorescence emission, good biocompatibility and easy synthesis.39–43 Herein, based on the advantage of GQDs, a simple and sensitive fluorescence sensing system for O-GlcNAc detection was designed, in which the GQDs bound with WGA were used as a fluorescence probe. The specific recognition between WGA and O-GlcNAc would lead to fluorescence decrease due to the shield effect of immobilized O-GlcNAcylated molecular to GQDs fluorescence signal. The more the O-GlcNAcylated molecule is immobilized onto WGA/GQDs, the bigger are the fluorescence signal changes; thus the amount of O-GlcNAc can be easily monitored (Scheme 1A). A control experiment using unmodified GQDs to detect O-GlcNAcylated peptide was also studied (Scheme 1B). Without WGA, the O-GlcNAcylated molecule cannot adsorb onto the surface of GQDs; thus the added O-GlcNAcylated molecule cannot result in a fluorescence signal change of GQDs, which further verifies the successful incorporation of the WGA modified GQDs for the detection of O-GlcNAcylated molecule. The linear response and detection limitation of the method was investigated. The method was also used to detect O-GlcNAc on real samples of α-crystallin protein and cancer cells lysate. In our strategy, the GQDs could provide a multivalent recognition interface for bound WGA. Therefore, the fluorescence of the O-GlcNAc sensing system should improve the sensitivity of the sensing system. Then, a simple, rapid and high sensitivity method for the analysis of O-GlcNAc was developed.
2. Materials and methods
2.1. Materials
Citric acid was purchased from Alfa Aesar. WGA, HEPES, Tween P20, and sodium hydroxide were obtained from Sigma-Aldrich Co (St Louis, MO, USA). Standard O-GlcNAcylated CREB peptide (TAPT(S-O-GlcNAc)TIAPG, O-GlcNAcylated peptide) and TAPTSTIAPG peptide (peptide without O-GlcNAc) were purchased from Bankpeptide Biological Technology Co., Ltd. Bovine serum albumin (BSA), histidine (His), arginine (Arg), glutamic acid (Glu), lysine (Lys), glucose, lactose and sucrose, MnCl2, CaCl2, MgCl2, Ba(NO3)2, CuCl2 and ZnSO4 were purchased from Sinopharm Chemical Reagent Co., Ltd. (Shanghai, China). All the reagents were analytical reagents and were used without further purification. Millipore Milli Q (18.2 MΩ cm) water was used in all the experiments.2.2. Apparatus
The fluorescent spectra were obtained using a FluoroMax-4P spectrometer (Horiba Jobin Yvon, Japan). Fourier transform infrared spectra (FT-IR) were recorded using a Bruker 70 FT-IR spectrometer. The UV-vis absorption spectra were obtained using a UV-2550 spectrometer. Transmission electron microscopy (TEM) images were measured using an American FEI TECAI G2F20 Electron Microscope. Atomic force microscopy (AFM) images were obtained using a Bruker Dimension Icon. The fluorescent cell used was a 350 μL quartz cuvette.2.3. Synthesis of GQD
The GQDs were prepared by pyrolysis citric acid method with minor revisions.44 First, 2 g citric acid particle was placed into a 10 mL beaker and the beaker was heated to 200 °C using a heating mantle. After 35 min, the citric acid powder became liquid, and the color of the liquid changed from colorless to orange. The orange liquid was added dropwise into 100 mL of 10 mg mL−1 NaOH solution with vigorous agitation. The NaOH solution was preheated to about 60 °C. Finally, the solution was filtered using a cylindrical filtration membrane filter (0.22 μm); the filtrate was the final product. GQDs stock solution was obtained by diluting the filtrate 6 times with HEPES containing 1 mM MnCl2, CaCl2, MgCl2 (10 mM, pH 7.4) and stored in the refrigerator at 4 °C for further use.2.4. Preparation of GQDs labeled WGA
The optimal GQDs labeled WGA system (GQDs/WGA) for the O-GlcNAc sensitive detection was selected. Herein, different concentrations of WGA (final concentrations: 25, 5, 1, 0.1 μg mL−1) and 300 μL GQDs were used to prepare GQDs/WGA in HEPES buffer (10 mM, pH 7.4) with a final volume of 9 mL. The mixture solution was prepared using a vortex mixer at room temperature for 1 h and then stored in the refrigerator at 4 °C. The fluorescence spectra of the GQDs were determined using an excitation wavelength of 360 nm and an emission peak at 460 nm.2.5. Detection of O-GlcNAc in O-GlcNAcylated peptide
The calibration curve of the relative fluorescence intensity F0 − F versus the O-GlcNAcylated peptide concentration was established. Herein, F0 and F are the fluorescence intensities during the absence and presence of O-GlcNAcylated peptide. Furthermore, 10 μL of different concentrations of the O-GlcNAcylated peptide was added into 290 μL of GQDs/WGA solution, the mixture solution was placed on a vortex mixer at room temperature for 30 min and then the fluorescence spectra were measured.2.6. Measurement of O-GlcNAc in α-crystallin protein and cell lysates
The method was also used for O-GlcNAc detection of α-crystallin protein and cell lysates. The working concentration of α-crystallin (1 μg mL−1) was prepared by dilution of the stock solutions with HEPES. Moreover, 2.74 × 10⁷ cells per mL cell lysates were prepared from colon cancer cell lines (SW480, SW620). The 2 cell lines were purchased from ATCC and cryopreserved in a refrigerator at low passages. SW480 and SW620 cells were cultured in L15 supplement with 10% FBS at 37 °C in 100% air based on the ATCC protocols. Cell density was measured using a Countess II FL Automated Cell Counter (ThermoFisher Scientific). Then, cells were lysed using a lysis buffer (0.5% Triton X-100, 1 mM EDTA, 1 mM PMSF in PBS and supplied with a cocktail protein inhibitor (Roche) according to the manufacturer's instructions) for 15 minutes on ice. The supernatant was collected after centrifugation at 12![[thin space (1/6-em)]](https://www.rsc.org/images/entities/char_2009.gif) 000 g for 10 minutes at 4 °C. The cell lysate was diluted to 200 times with HEPES for the last use. The procedure was the same as for the O-GlcNAcylated peptide detection.
000 g for 10 minutes at 4 °C. The cell lysate was diluted to 200 times with HEPES for the last use. The procedure was the same as for the O-GlcNAcylated peptide detection.
3. Result and discussion
3.1. Characterization of the synthesized GQDs
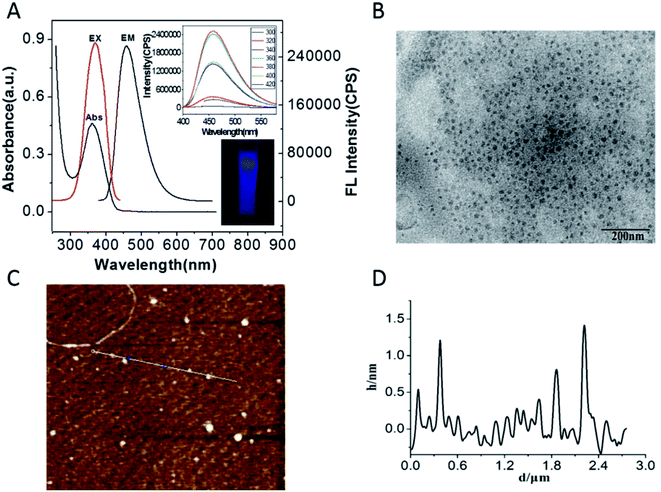
The properties of the prepared GQDs were characterized by UV-vis absorption spectra and fluorescence spectra. There is a strong UV-vis absorption peak located at 362 nm, which is ascribed to the π–π* transitions of the C![[double bond, length as m-dash]](https://www.rsc.org/images/entities/char_e001.gif) C bonds34 (Fig. 1A). As is shown in Fig. 1A, an evident emission peak at 460 nm was observed under an optimal excitation of 360 nm in the fluorescence spectrum, which is consistent with previous reports.44 The colorless GQDs solution under the excitation of a UV lamp at 365 nm shows a bright blue luminescence to the naked eye, indicating that the GQDs can emit a blue fluorescence (the inset of Fig. 1A lower). In order to further study the properties of the GQDs, the fluorescence emission spectra of the GQDs with excitation at different wavelengths were investigated (the inset of Fig. 1A upper). The result shows that the emission of GQDs wavelength was stable over the excitation wavelength range of 300 nm to 420 nm, demonstrating that GQDs exhibit an excitation-independent performance.
C bonds34 (Fig. 1A). As is shown in Fig. 1A, an evident emission peak at 460 nm was observed under an optimal excitation of 360 nm in the fluorescence spectrum, which is consistent with previous reports.44 The colorless GQDs solution under the excitation of a UV lamp at 365 nm shows a bright blue luminescence to the naked eye, indicating that the GQDs can emit a blue fluorescence (the inset of Fig. 1A lower). In order to further study the properties of the GQDs, the fluorescence emission spectra of the GQDs with excitation at different wavelengths were investigated (the inset of Fig. 1A upper). The result shows that the emission of GQDs wavelength was stable over the excitation wavelength range of 300 nm to 420 nm, demonstrating that GQDs exhibit an excitation-independent performance.
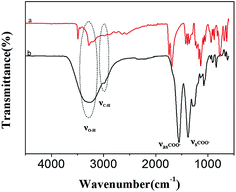
The synthesized GQDs were also characterized by TEM (Fig. 1B). The TEM image indicated that the GQDs are mono-dispersed and uniform, and the diameters of the GQDs are about 4–6 nm. Fig. 1C and D show the AFM images of the GQDs. The AFM result indicates that the GQDs are highly dispersed (C), and their heights are mostly in the range of 0.5–1.3 nm (D). In addition, the GQDs were also characterized by FT-IR spectra (Fig. 2). It can be seen that there are two evident peaks at 1385 cm−1 and 1560 cm−1 in the FT-IR spectra of the GQDs (curve b) compared to that of citric acid (curve a), which should be the result of the symmetric and asymmetric stretching vibrations of –COO. The absorption peaks at 3331 cm−1 and 2980 cm−1 are ascribed to the stretching vibrations of O–H and C–H, respectively, implying that the GQDs contain some incompletely carbonized citric acid.44 These phenomena demonstrate that the GQDs were successfully synthesized.
3.2. Preparation of GQDs labeled WGA
To obtain the best fluorescence intensity for the detection of O-GlcNAc, the amount of GQDs and WGA was optimized by adjusting the concentration of WGA with the same concentration of GQDs (Fig. 3). Column a shows the fluorescence signal of the GQDs. The fluorescence signal of the GQDs was not affected when the concentrations of WGA were 0.1 and 1 pg mL−1 in the GQDs solution (column b and c, respectively). When the concentration of WGA increased to 5 and 25 pg mL−1, a signal decrease was observed (column d and e). The result demonstrated that with the increase in the WGA concentration, more WGA immobilized onto the GODs surface by electrostatic interaction (the WGA (pI = 9)45 are positively charged in the HEPES buffer (10 mM, pH 7.4)). In contrast, there are –COOH groups existed on the surface of the prepared GQDs, and GQDs are negatively charged in pH 7.4 solution because most carboxylic acid groups (pKa ≈ 4.7).46 Thus, WGA can reach the surface of the GQDs because of electrostatic interactions, and the fluorescence signal of GQDs could be shielded by WGA when the amount of WGA approaches a certain degree. Then, the response of the GQDs modified with a different concentration of WGA for the detection of O-GlcNAc was explored as shown in Fig. S1.† The concentration of 5 pg mL−1 WGA was selected for the following experiment, based on the higher sensitivity for the O-GlcNAcylate molecule detection used and the little free WGA interference (details in ESI†). The effect of pH on the fluorescence signal was also explored (Fig. S2†). It was found that the fluorescence signal of the WGA/GQDs system is pH dependent, but in a pH 7.4 medium, the signal change is the biggest after the addition of the O-GlcNAcylate molecule. Considering that a pH of 7.4 is also close to physiological situations, a pH 7.4 medium was selected for the O-GlcNAc detection. More information is shown in the ESI.†3.3. Quantification of a standard O-GlcNAcylated CREB peptide
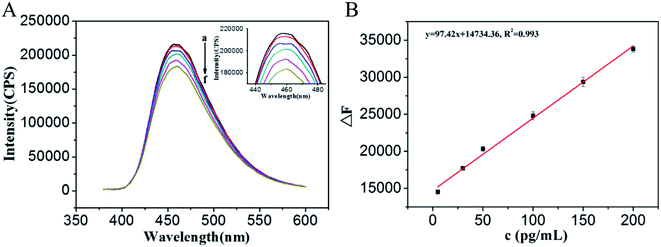
At the optimal conditions, the fluorescence responses for different concentrations of O-GlcNAcylated peptide were evaluated. It can be seen that the fluorescence intensities of the WGA/GQDs solution at 460 nm are decreased with the increasing concentrations of the O-GlcNAcylated peptide (Fig. 4A). Fig. 4B shows the correlation between the relative fluorescence intensities (F0 − F) and the concentrations of O-GlcNAcylated peptide. The linear equation is F0 − F = 97.39C + 1.47 × 10⁴, the linear response range of the sensing system is 5–200 pg mL−1 and the correlation coefficient (R2) of the standard curve is 0.993. A wide linear range was obtained, which may be attributed to the relatively high concentration of WGA that was used when preparing the WGA/GQDs. In a relatively high WGA concentration system, more WGA could be immobilized on the surface of the GQDs, which is beneficial for the recognition of the O-GlcNAcylated peptide. The recognition of O-GlcNAc is not easy to reach saturation and benefit to a wider linear range. The detection limit of 0.8 pg mL−1 (0.82 fmol) was calculated based on three times the signal-noise ratio (S/N = 3), which is about 3 times lower than that of the MRM-MS method 3 fmol.31 The proposed method is simple and sensitive for the detection of complex O-GlcNAcylated proteins compared to MRM-MS. Though MRM-MS quantified the O-GlcNAcylated samples without enrichment and labeling, it needs to know the sequence of peptides in advance and the instruments are relatively expensive. In addition, the fluorescence signal can be obtained directly through the recognition between WGA and O-GlcNAc, avoiding the need for analysis of several experimental results and the prediction of the structure of the proteins.3.4. Selectivity of GQDs/WGA for O-GlcNAc detection
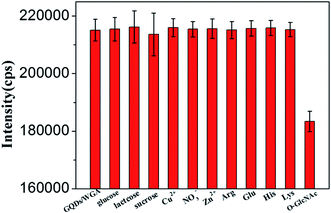
In order to further test the selectivity of this detection method for O-GlcNAc, several interference substances, such as 1 mM metal ions (Cu2+, NO3−, Zn2+), 2 ng mL−1 sugars (glucose, lactose, sucrose) and 2 mM amino acids (Arg, Glu, His, Lys), were used as control. As shown in Fig. 5, no remarkable fluorescence change was observed upon the addition of these interfering substances. These results indicate that WGA does not recognize these substances; therefore these substances do not reach the surface of the GQDs to change the fluorescence signal of GQDs/WGA. However, when the 200 pg mL−1 O-GlcNAcylated peptide was added into the system, it caused an evident fluorescence intensity variation, although the concentration of the O-GlcNAcylated peptide was much lower than that of the interfering substrates. These results mean that this method has excellent selectivity for the detection of the O-GlcNAcylated molecule. The excellent selectively and high sensitivity toward O-GlcNAc modified biomolecules suggests that this proposed method might be directly applied for detecting O-GlcNAc in real samples.3.5. Detection of O-GlcNAc in real samples
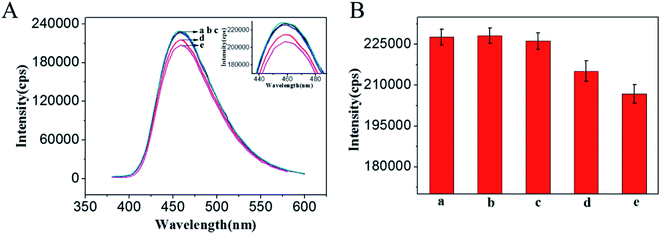
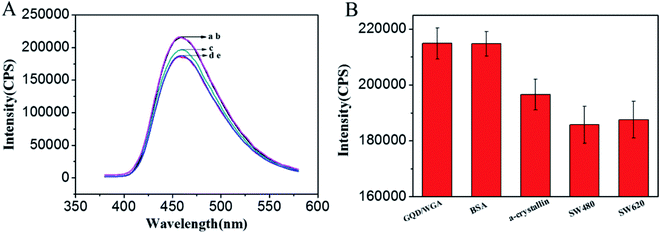
α-Crystallin is a major structure of lens protein that plays an essential role in maintaining the transparency of the ocular lens.47 In addition, the up regulation of α-crystallin has been associated with ischemic heart, Parkinson's disease, multiple sclerosis and so on.48 It is particularly difficult to detect O-GlcNAc on α-crystallin because of the presence of only one major modification site and its low stoichiometry of glycosylation.49,50 Herein, to further study the potential practical applications of this method, purified α-crystallin protein was used as a model sample to analyze the O-GlcNAc amount in the protein. As shown in Fig. 6A, when 1 μg mL−1 α-crystallin was added into the GQDs/WGA solution, the fluorescence intensity of GQDs/WGA decreased (c). Because of the recognition between WGA and O-GlcNAc, the protein could be immobilized on the surface of GQDs, then the protein could shield the fluorescence signal of GQDs, resulting in a signal decrease. However, when the same concentration of BSA was added, there were a few effects on the fluorescence signal of GQDs/WGA (curve b Fig. 6A). Because BSA does not contain O-GlcNAc, it cannot be adsorbed on the surface of GQDs and decreases the fluorescence signal of GQDs. This result suggested that this method can be used to detect O-GlcNAc in real sample proteins.On the basis of the above results, the application of the method for O-GlcNAc detection in complicated biological samples was evaluated. The fluorescence intensity of GQDs/WGA decreased more evidently after the introduction of 10 μL cancer cell lysates (1.37 × 10⁵ cells per mL) of SW480 and SW620 (curve d and e Fig. 6A). These results demonstrated that there are more O-GlcNAc modified proteins in the two cells, which reach the surface of the GQDs to shield the fluorescence signal of GQDs/WGA by the recognition between WGA and GQDs. To show this trend more clearly, the fluorescence intensity response of SW480 and SW620 is displayed in Fig. 6B. It is observed that the fluorescence intensity of SW480 changed more than that of SW620, while the BSA did not cause fluorescence signal changes, suggesting that the proteins do not contain O-GlcNAc. In spite of the fact that the cell lysate contains several different types of protein, nucleic acids and sugars, this method can distinguish O-GlcNAc modified proteins and other substrates. These results suggested the potential practical application of this simple and the high sensitivity method in the clinical diagnosis of O-GlcNAc related diseases.
4. Conclusions
In this study, a new fluorescence sensing strategy for the simple and sensitive detection of O-GlcNAc was developed. The method is based on the recognition between O-GlcNAc and WGA, which could shield the fluorescence signal of GQDs/WGA solution. The linear response range is from 5 to 200 pg mL−1. The proposed strategy shows a high sensitivity to O-GlcNAc with the detection limit of 0.8 pg mL−1. Because of the biocompatibility and excellent chemical properties of GQDs, the sensing system was also successfully used to detect O-GlcNAc in complicated biological samples of cell lysates. It is expected that this strategy will open up new opportunities to apply the fluorescence method for the simple and sensitive detection of O-GlcNAc.Acknowledgements
This study was supported by the National Nature Science Foundation of China (21271184) and the Ministry of Science and Technology of China (973 program 2014CB931900).References
- G. W. Hart, M. P. Housley and C. Slawson, Nature, 2007, 446, 1017–1022 CrossRef CAS PubMed.
- D. C. Love, M. M. Krause and J. A. Hanover, Amino Acids, 2009, 37, 60 Search PubMed.
- C. R. Torres and G. W. Hart, J. Biol. Chem., 1984, 259, 3308–3317 CAS.
- Z. L. L. Wu, M. T. Robey, T. Tatge, C. Lin, N. Leymarie, Y. L. Zou and J. Zaia, Glycobiology, 2014, 24, 740–747 CrossRef CAS PubMed.
- R. Dentin, S. Hedrick, J. X. Xie, J. Yates and M. Montminy, Science, 2008, 319, 1402–1405 CrossRef CAS PubMed.
- E. P. Tan, S. Caro, A. Potnis, C. Lanza and C. Slawson, J. Biol. Chem., 2013, 288, 27085–27099 CrossRef CAS PubMed.
- S. Hardiville, A. Escobar-Ramirez, S. Pina-Canceco, E. Elass and A. Pierce, BioMetals, 2014, 27, 875–889 CrossRef CAS PubMed.
- M. R. Bond and J. A. Hanover, Annu. Rev. Nutr., 2013, 33, 205–229 CrossRef CAS PubMed.
- F. Liu, K. Iqbal, I. Grundke-Iqbal, G. W. Hart and C. X. Gong, Proc. Natl. Acad. Sci. U. S. A., 2004, 101, 10804–10809 CrossRef CAS PubMed.
- V. Champattanachai, P. Netsirisawan, P. Chaiyawat, T. Phueaouan, R. Charoenwattanasatien, D. Chokchaichamnankit, P. Punyarit, C. Srisomsap and J. Svasti, Proteomics, 2013, 13, 2088–2099 CrossRef CAS PubMed.
- K. M. Mellor, M. A. Brimble and L. M. D. Delbridge, Life Sci., 2015, 129, 48–53 CrossRef CAS PubMed.
- N. E. Zachara, Am. J. Physiol., 2012, 302, H1905–H1918 CrossRef CAS PubMed.
- H. M. Itkonen, S. Minner, I. J. Guldvik, M. J. Sandmann, M. C. Tsourlakis, V. Berge, A. Svindland, T. Schlomm and I. G. Mills, Cancer Res., 2013, 73, 5277–5287 CrossRef CAS PubMed.
- G. Yehezkel, L. Cohen, A. Kliger, E. Manor and I. Khalaila, J. Biol. Chem., 2012, 287, 28755–28769 CrossRef CAS PubMed.
- Y. C. Gu, W. Y. Mi, Y. Q. Ge, H. Y. Liu, Q. O. Fan, C. F. Han, J. Yang, F. Han, X. Z. Lu and W. G. Yu, Cancer Res., 2010, 70, 6344–6351 CrossRef CAS PubMed.
- Z. Y. Ma, D. J. Vocadlo and K. Vosseller, J. Biol. Chem., 2013, 288, 15121–15130 CrossRef CAS PubMed.
- E. J. Kim, Molecules, 2011, 16, 1987–2022 CrossRef CAS PubMed.
- D. L. Y. Dong, Z. S. Xu, M. R. Chevrier, R. J. Cotter, D. W. Cleveland and G. W. Hart, J. Biol. Chem., 1993, 268, 16679–16687 CAS.
- J. E. Rexach, C. J. Rogers, S. H. Yu, J. F. Tao, Y. E. Sun and L. C. Hsieh-Wilson, Nat. Chem. Biol., 2010, 6, 645–651 CrossRef CAS PubMed.
- A. S. Vercoutter-Edouart, I. El Yazidi-Belkoura, C. Guinez, S. Baldini, M. Leturcq, M. Mortuaire, A. M. Mir, A. Steenackers, V. Dehennaut, A. Pierce and T. Lefebvre, Proteomics, 2015, 15, 1039–1050 CrossRef CAS PubMed.
- N. Khidekel, S. Arndt, N. Lamarre-Vincent, A. Lippert, K. G. Poulin-Kerstien, B. Ramakrishnan, P. K. Qasba and L. C. Hsieh-Wilson, J. Am. Chem. Soc., 2003, 125, 16162–16163 CrossRef CAS PubMed.
- K. Vosseller, J. C. Trinidad, R. J. Chalkley, C. G. Specht, A. Thalhammer, A. J. Lynn, J. O. Snedecor, S. H. Guan, K. F. Medzihradszky, D. A. Maltby, R. Schoepfer and A. L. Burlingame, Mol. Cell. Proteomics, 2006, 5, 923–934 CAS.
- D. J. Vocadlo, H. C. Hang, E. J. Kim, J. A. Hanover and C. R. Bertozzi, Proc. Natl. Acad. Sci. U. S. A., 2003, 100, 9116–9121 CrossRef CAS PubMed.
- F. I. Comer, K. Vosseller, L. Wells, M. A. Accavitti and G. W. Hart, Anal. Biochem., 2001, 293, 169–177 CrossRef CAS PubMed.
- C. M. Snow, A. Senior and L. Gerace, J. Cell Biol., 1987, 104, 1143–1156 CrossRef CAS PubMed.
- Y. Tashima and P. Stanley, J. Biol. Chem., 2014, 289, 11132–11142 CrossRef CAS PubMed.
- N. Khidekel, S. B. Ficarro, P. M. Clark, M. C. Bryan, D. L. Swaney, J. E. Rexach, Y. E. Sun, J. J. Coon, E. C. Peters and L. C. Hsieh-Wilson, Nat. Chem. Biol., 2007, 3, 339–348 CrossRef CAS PubMed.
- J. A. Hanover, C. K. Cohen, M. C. Willingham and M. K. Park, J. Biol. Chem., 1987, 262, 9887–9894 CAS.
- C. Cieniewski-Bernard, B. Bastide, T. Lefebvre, J. Lemoine, Y. Mounier and J. C. Michalski, Mol. Cell. Proteomics, 2004, 3, 577–585 CAS.
- P. Zhao, R. Viner, C. F. Teo, G. J. Boons, D. Horn and L. Wells, J. Proteome Res., 2011, 10, 4088–4104 CrossRef CAS PubMed.
- J. J. P. Maury, D. Ng, X. Z. Bi, M. Bardor and A. B. H. Choo, Anal. Chem., 2014, 86, 395–402 CrossRef CAS PubMed.
- R. J. Chalkley, A. Thalhammer, R. Schoepfer and A. L. Burlingame, Proc. Natl. Acad. Sci. U. S. A., 2009, 106, 8894–8899 CrossRef CAS PubMed.
- S. Cecioni and D. J. Vocadlo, Curr. Opin. Chem. Biol., 2013, 17, 719–728 CrossRef CAS PubMed.
- J. J. Liu, Z. T. Chen, D. S. Tang, Y. B. Wang, L. T. Kang and J. N. Yao, Sens. Actuators, B, 2015, 212, 214–219 CrossRef CAS.
- H. Razmi and R. Mohammad-Rezaei, Biosens. Bioelectron., 2013, 41, 498–504 CrossRef CAS PubMed.
- Y. Zhang, C. Y. Wu, X. J. Zhou, X. C. Wu, Y. Q. Yang, H. X. Wu, S. W. Guo and J. Y. Zhang, Nanoscale, 2013, 5, 1816–1819 RSC.
- W. Zhao, Y. Li, S. Yang, Y. Chen, J. Zheng, C. Liu, Z. Qing, J. Li and R. Yang, Anal. Chem., 2016, 88, 4833–4840 CrossRef CAS PubMed.
- L. B. Li, C. Wang, J. X. Luo, Q. W. Guo, K. Y. Liu, K. Liu, W. J. Zhao and Y. Q. Lin, Talanta, 2015, 144, 1301–1307 CrossRef CAS PubMed.
- R. L. Liu, D. Q. Wu, X. L. Feng and K. Mullen, J. Am. Chem. Soc., 2011, 133, 15221–15223 CrossRef CAS PubMed.
- J. J. Lu, Y. J. Cai and J. Ding, Mol. Cell. Biochem., 2011, 354, 247–252 CrossRef CAS PubMed.
- J. H. Shen, Y. H. Zhu, X. L. Yang and C. Z. Li, Chem. Commun., 2012, 48, 3686–3699 RSC.
- G. L. Wang, X. Fang, X. M. Wu, X. L. Hu and Z. J. Li, Biosens. Bioelectron., 2016, 81, 214–220 CrossRef CAS PubMed.
- S. J. Zhu, J. H. Zhang, C. Y. Qiao, S. J. Tang, Y. F. Li, W. J. Yuan, B. Li, L. Tian, F. Liu, R. Hu, H. N. Gao, H. T. Wei, H. Zhang, H. C. Sun and B. Yang, Chem. Commun., 2011, 47, 6858–6860 RSC.
- Y. Q. Dong, J. W. Shao, C. Q. Chen, H. Li, R. X. Wang, Y. W. Chi, X. M. Lin and G. N. Chen, Carbon, 2012, 50, 4738–4743 CrossRef CAS.
- T. Crouzier, C. H. Beckwitt and K. Ribbeck, Biomacromolecules, 2012, 13, 3401–3408 CrossRef CAS PubMed.
- A. Z. M. Badruddoza, A. S. H. Tay, P. Y. Tan, K. Hidajat and M. S. Uddin, J. Hazard. Mater., 2011, 185, 1177–1186 CrossRef CAS PubMed.
- H. Bloemendal, CRC Crit. Rev. Biochem. Mol. Biol., 1982, 12, 1–38 CrossRef CAS.
- M. Ghahramani, R. Yousefi, K. Khoshaman, S. S. Moghadam and B. I. Kurganov, Int. J. Biol. Macromol., 2016, 87, 208–221 CrossRef CAS PubMed.
- R. J. Chalkley and A. L. Burlingame, J. Am. Soc. Mass Spectrom., 2001, 12, 1106–1113 CrossRef CAS PubMed.
- P. A. Haynes and R. Aebersold, Anal. Chem., 2000, 72, 5402–5410 CrossRef CAS PubMed.
Footnote |
| † Electronic supplementary information (ESI) available. See DOI: 10.1039/c7ra02643a |
| This journal is © The Royal Society of Chemistry 2017 |

