 Open Access Article
Creative Commons Attribution 3.0 Unported Licence
Controllable synthesis of nitrogen-doped mesoporous carbons for supercapacitor applications
Zhu Li,
Kunkun Guo * and
Xuli Chen
College of Materials Science and Engineering, Hunan University, Changsha, 410082, People's Republic of China. E-mail: kunkunguo@hnu.edu.cn
First published on 14th June 2017
Abstract
Nitrogen-doped mesoporous carbons (NMC) have been controllably synthesized through a solvent evaporation induced self-assembly (EISA) method, where a novel nitrogen-doped carbon precursor is used, followed by thermo-polymerization and pyrolysis of this precursor. In this precursor, dicyandiamide is covalently integrated into low-molecular weight and soluble phenolic resins. The configuration of nitrogen and the effects of nitrogen on the structure and porosity before and after KOH activation are deeply investigated for the obtained NMC. The nitrogen functional groups are found to facilitate the KOH activation process, especially when the aperture is suitable for molten KOH immersion, leading to the formation of much more micropores and mesopores on the surface of the carbons. As a result, a large specific surface area of 2828.8 m2 g−1 in activated NMC (A-NMC) is significantly greater than that of activated mesoporous carbon without nitrogen (1244.6 m2 g−1), and the mesoporous ratio in A-NMC is as high as 44.1%. Meanwhile, supercapacitor electrodes based on the obtained A-NMC exhibit a specific capacitance as high as 388 F g−1 at the current density of 0.5 A g−1, while only 213.6 F g−1 is achieved by the nitrogen-free activated mesoporous carbons based electrode. Moreover, the A-NMC shows a good rate capability (70% of the capacitance retained at a high current density up to 50 A g−1) and an excellent cycling stability (no capacitance loss over 5000 cycles). The method demonstrated in this work is hopeful to open up a new route of designing nitrogen-doped mesoporous carbons for supercapacitor applications with good rate capability and excellent cycling stability.
1. Introduction
Mesoporous carbons (MC) have become ideal candidates for electrical double-layer supercapacitors (EDLCs) electrodes due to their advantages of specific surface area, controllable pore sizes and structures, chemically inert nature and mechanical stability.1 As previously reported,2 the synthetic routes of ordered MC are mainly classified into hard- and soft-template strategies. Compared with the nanocasting process using silica as a hard template, which is complex and not suitable for large-scale production, it is more efficient and feasible to use the self-assembly of precursors such as resins and block copolymers. Using phenolic resins as precursors, the specific surface area of mesoporous carbons prepared by the solvent evaporation induced self-assembly (EISA) method is generally less than 1000 m2 g−1.3 On the other hand, highly ordered MC prepared by EISA method, using amphipathic triblock copolymer F127 as a soft-template, exhibit a specific surface area of 700 m2 g−1 and a specific capacitance of 136 F g−1 at the current density of 0.5 A g−1 in 6 M KOH electrolyte.4 For this kind of ordered MC followed by KOH activation, the specific surface area can increase from 660 m2 g−1 to 1410 m2 g−1, together with the increase of the specific capacitance from 130 F g−1 to 200 F g−1 at the current density of 0.5 A g−1.5 Therefore, not only the controllable structure of precursors, but also the proper activation method are required to achieve a significant improvement of mesoporous carbons for supercapacitor applications.To further enhance energy density and power output, one strategy is proposed to introduce pseudocapacitance through doping functional groups/heteroatoms, such as N, O, S, B and P to carbon materials.6,7 Among various heteroatoms, nitrogen atom can greatly improve the specific capacitance of carbon materials by both improving the surface wettability8 and inducing redox reactions to incorporate pseudocapacitance.9 Some nitrogen-containing compounds, such as melamine,10,11 urea,12 dicyandiamide,13–16 have been used to prepare nitrogen-doped mesoporous carbons in the applications of supercapacitor electrodes. Dicyandiamide that is low price with the nitrogen content about 66.7%, possesses higher water solubility and reactivity, and thus is an ideal nitrogen source. NMC synthesized by simply mixing dicyandiamide, low molecular weight phenolic resins with F127, exhibits a specific surface area of 537 m2 g−1, and the specific capacitance of 244 F g−1 at a low current density of 0.5 A g−1, which is higher than that of MC without nitrogens.13 Additionally, the ordered NMC fabricated by soft template hydrothermal method, where D-fructose and dicyandiamide were used as carbon source and nitrogen source, respectively, give a specific surface area of 375–730 m2 g−1, and a specific capacitance of 212 F g−1 even at a low scan rate of 1 mV s−1.14
Although the incorporation of nitrogen can provide some pseudo capacitance, it is very limited to increase in both the capacitance and surface area of mesoporous carbons. It is well known that the specific surface area is crucial to the capacitance of EDLCs, which has a direct effect on the performance of mesoporous carbons. The ordered NMC prepared by EISA method with both TEOS and F127 as template, dicyandiamide and phenolic resins as nitrogen source and carbon source, respectively, followed by HF etching of SiO2, showed a specific surface area of 1374 m2 g−1 and a specific capacitance of 308 F g−1 at low current density of 0.2 A g−1, which was far higher than that of NMC without using silicon template (631 m2 g−1 and 234 F g−1). However, at high current density of 20 A g−1, the specific capacitance of NMC with TEOS was only 131 F g−1 less than that of NMC without silicon template (145 F g−1), as well as the capacitance retention rate of NMC with TEOS is only 42.5%.16 Another nitrogen-doped ordered mesoporous carbons prepared by mechanically mixing lysine and phenolic resins, showed a limited specific surface area of 1866 m2 g−1 even after further KOH activation and a specific capacitance of 186 F g−1 in ionic liquid electrolyte at the low current density of 0.25 A g−1.17 Besides, a series of nitrogen-doped porous carbons (NPC) were synthesized by pyrolysis of the polymerized ethylenediamine and carbon tetrachloride, followed by KOH activation. The specific surface area of the obtained NPC is 1913 m2 g−1, and the specific capacitance is 363 F g−1 at a current density of 0.1 A g−1. However, the capacitance retention rate was only 50% at the current density of 20 A g−1.18 The specific surface area and the specific capacitance of nitrogen-doped porous carbons can be effectively increased by the extra method of silica template19,20 and KOH activation.21–25 Likewise, it is found that large micropores are further formed in these porous carbons after KOH activation. Therefore, the obtained materials can exhibit a good specific capacitance at small current density, not at high current densities. This phenomenon is mainly ascribed to the fact that electrolyte ions cannot freely enter and leave small pores at high current density.26 Therefore, controllable synthesis of nitrogen-doped mesoporous carbons with large specific surface area and moderate pore size is possible to improve the electrochemical performance at high current density.
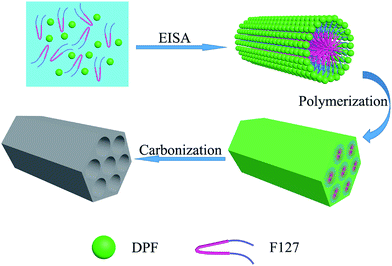
Here, a kind of soluble resins (dicyandiamide formaldehyde resin, DPF) covalently inter-connected among dicyandiamide, phenol and formaldehyde via a basic catalyzed process, possesses high nitrogen content and stable structure. As illustrated in Scheme 1, using triblock copolymer F127 as a soft template, and dicyandiamide phenolic resins as the precursor, nitrogen-doped mesoporous carbons are controllably synthesized through EISA method followed by thermo-polymerization and carbonization. After KOH activation, large micropores and mesoporous are formed in the obtained nitrogen-doped mesoporous carbons, giving A-NMC with a large specific surface area and a high ratio of mesoporous. The as-made carbons based supercapacitor electrodes greatly improve the electrochemical capacitive performance compared with MC without nitrogen, especially showing good rate capability and excellent cycling stability.
2. Experimental section
2.1 Chemicals
Poly(ethylene oxide)-block-poly(propylene oxide)-block-poly(ethylene oxide) triblock copolymer Pluronic F127 (PEO106PPO70PEO106, Mw = 12![[thin space (1/6-em)]](https://www.rsc.org/images/entities/char_2009.gif) 600) was obtained from Sigma Corp. Phenol and formalin aqueous solution (37 wt%) were provided by Tianjin Baishi Chemical Co. Ltd. Sodium hydroxide (NaOH), hydrochloric acid (HCl) were purchased from Hunan Huihong Chemical Reagent Co. Ltd. Potassium hydroxide (KOH) and ethanol were purchased in Tianjin City Hengxing Chemical Reagent Co. Ltd. Dicyandiamide (DCDA) was purchased from Sinopharm Chemical Reagent Co. Ltd. All chemicals were employed without any further purification.
600) was obtained from Sigma Corp. Phenol and formalin aqueous solution (37 wt%) were provided by Tianjin Baishi Chemical Co. Ltd. Sodium hydroxide (NaOH), hydrochloric acid (HCl) were purchased from Hunan Huihong Chemical Reagent Co. Ltd. Potassium hydroxide (KOH) and ethanol were purchased in Tianjin City Hengxing Chemical Reagent Co. Ltd. Dicyandiamide (DCDA) was purchased from Sinopharm Chemical Reagent Co. Ltd. All chemicals were employed without any further purification.
2.2 Preparation of dicyandiamide phenolic resins precursors (DPF)
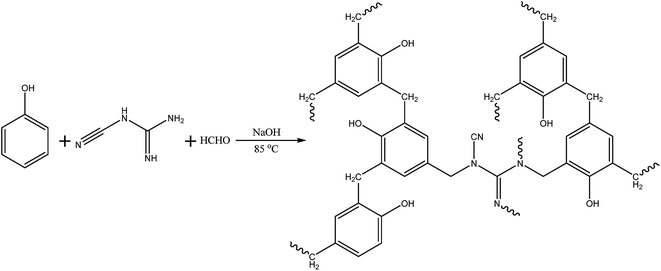
A low-molecular-weight and soluble modified phenolic resins were prepared with dicyandiamide, phenol and formaldehyde via a basic catalyzed process. This modified phenolic resins are also called as the dicyandiamide phenolic resins (DPF) in the present study. The synthesized process is simply elucidated as follows. Phenol (6.1 g) was firstly melted at 44 °C in a flask and then mixed with 20 wt% NaOH aqueous solution (1.3 g) under stirring. After stirring 20 min, formalin aqueous solution (37 wt%, 10.5 g) and dicyandiamide (2.5–6 g) were added dropwisely, where the molar ratios of dicyandiamide and phenol ranges from 0.5 to 1.2. Then, the mixture was kept on stirring at 60 °C for 30 min, and then proceeded the reaction for another 1 h with the temperature increased up to 85 °C. Cooling the mixture down to room temperature, the pH value of the reaction mixture was adjusted to neutral (pH ∼ 7.0) using 0.1 M HCl solution. The final product was dried at 50 °C under vacuum to remove water. These products were abbreviated as DPF-x, where x is the molar ratio of dicyandiamide to phenol (x = 0.0, 0.5, 0.8, 1.0, 1.2).2.3 Preparation of nitrogen doped mesoporous carbons (NMC)
The formation process of nitrogen doped mesoporous carbons is illustrated in Scheme 1. Triblock copolymer Pluronic F127 (1.0 g) was dissolved in ethanol (8.0 g). While, the above DPF-x precursors (1.5 g) was dissolved in the solution of ethanol (12.0 g) and distilled water (10.0 g), and then were added into the above F127 solution under stirring for 30 min. After stirred homogeneously, the solution was transferred to a dish to evaporate ethanol and water at 50 °C for 6–8 h, and then followed by thermos-polymerization in an oven at 100 °C for 24 h. The as-made products were scraped from the dishes and crushed into small pieces. Carbonization was carried out in a tubular furnace under argon atmosphere at 350 °C for 2 h and then 600 °C for 3 h with a heating rate of 1 °C min−1. The carbon products were denoted as NMC-x, where x is the molar ratio of dicyandiamide to phenol. These NMC-x products before used as supercapacitor electrode materials were activated by KOH, where the mass ratio of KOH/NMC-x was about 4![[thin space (1/6-em)]](https://www.rsc.org/images/entities/char_2009.gif) :
:![[thin space (1/6-em)]](https://www.rsc.org/images/entities/char_2009.gif) 1.27 During the activation process, the mixtures of KOH/NMC-x were heated to 600 °C at a heating rate of 2 °C min−1 and then to 800 °C for 2 h with a rate of 4 °C min−1 under argon atmosphere. Until cooling the mixture down to room temperature, the mixtures were treated with 0.1 M HCl to remove KOH and then washed by bulk deionized water until the pH value close to 7. Then the activated products were dried at 90 °C for 12 h in air. The carbons after KOH activation were denoted as A-NMC-x.
1.27 During the activation process, the mixtures of KOH/NMC-x were heated to 600 °C at a heating rate of 2 °C min−1 and then to 800 °C for 2 h with a rate of 4 °C min−1 under argon atmosphere. Until cooling the mixture down to room temperature, the mixtures were treated with 0.1 M HCl to remove KOH and then washed by bulk deionized water until the pH value close to 7. Then the activated products were dried at 90 °C for 12 h in air. The carbons after KOH activation were denoted as A-NMC-x.
2.4 Characterization
Fourier transform infrared (FTIR) spectrum was recorded between 4000 cm−1 and 400 cm−1 on a Nicolet 5700 infrared spectrometer. The morphology was characterized by transmission electron microscope (TEM, Titan G2 60-300 with image corrector) with an accelerating voltage of 200 kV. Small-angle X-ray scattering (SAXS) measurements were performed on a Nanostar U small-angle X-ray scattering system (Germany) with Cu-Kα radiation (λ = 0.154 nm). The porous properties of the carbons were analyzed using N2 adsorption–desorption isotherms measured by an ASAP 2000 analyzer (Micromeritics, USA) at 77 K. Before measurements, the carbons were degassed in a vacuum at 200 °C for at least 6 h. X-ray photoelectron spectrum (XPS) was conducted using a VG ESCALAB 220I-XL device with a monochromatic Al-Kα source.2.5 Electrochemical measurements
The electrochemical measurements were performed in a conventional three-electrode system with 1 M H2SO4 electrolyte, where the working electrode is the activated products, and a Pt plate electrode and a saturated calomel electrode (SCE) as the counter and reference electrodes, respectively. The working electrodes were obtained by mixing A-NMC-x (80 wt%), conductive carbon black (15 wt%) and polytetrafluoroethylene (5 wt%) dissolved in ethanol. The slurry was then coated onto a stainless steel mesh (1 cm × 1 cm) and dried in a vacuum oven at 100 °C for 12 h. Each working electrode contains the active products in a range from 1.5 to 3 mg. Galvanostatic charge/discharge, the life cycle measurements, cyclic voltammetry (CV) and electrochemical impedance spectroscopy (EIS) measurements were performed using the electrochemical workstation of CHI660E (Shanghai Chenhua Co. Ltd., China). Galvanostatic charge/discharge, the life cycle measurements and cyclic voltammetry (CV) measurements were carried out in a potential window between −0.2 and 0.7 V, while the electrochemical impedance spectroscopy (EIS) measurements were performed in a frequency ranged from 100 kHz to 10 mHz with an AC amplitude of 5 mV.3. Results and discussion
3.1 FTIR characterization of phenolic resins (PF), DCDA and DPF
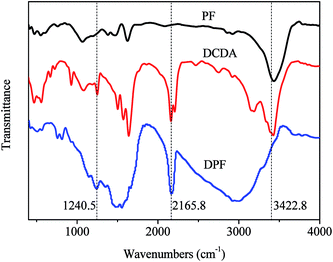
Fig. 1 shows the Fourier transform infrared (FTIR) spectra of PF, DCDA and DPF. The stretching vibration absorption of the C![[double bond, length as m-dash]](https://www.rsc.org/images/entities/char_e001.gif) C (1478.3 cm−1 and 1553.6 cm−1) and the C–H (2923.7 cm−1 and 3001.6 cm−1) in benzene rings, as well as the new bond of the O–H (3434.7 cm−1) after the reactions between phenol and formaldehyde appear in FTIR spectrum of PF. While, the stretching vibration absorptions of the N–H (3422.8 cm−1) in primary or secondary amine, the C
C (1478.3 cm−1 and 1553.6 cm−1) and the C–H (2923.7 cm−1 and 3001.6 cm−1) in benzene rings, as well as the new bond of the O–H (3434.7 cm−1) after the reactions between phenol and formaldehyde appear in FTIR spectrum of PF. While, the stretching vibration absorptions of the N–H (3422.8 cm−1) in primary or secondary amine, the C![[triple bond, length as m-dash]](https://www.rsc.org/images/entities/char_e002.gif) N (2165.8 cm−1) and the C–N (1240.5 cm−1) are found in the spectrum of DCDA. Likewise, the absorptions of the C
N (2165.8 cm−1) and the C–N (1240.5 cm−1) are found in the spectrum of DCDA. Likewise, the absorptions of the C![[triple bond, length as m-dash]](https://www.rsc.org/images/entities/char_e002.gif) N, the C
N, the C![[double bond, length as m-dash]](https://www.rsc.org/images/entities/char_e001.gif) C and the C–H corresponding to DCDA and benzene rings, are still observed in the spectrum of DPF. However, it is found that the characteristic absorptions of the O–H and the N–H disappear, indicating that the reaction occurs between the amino and hydroxyl groups. Additionally, it is observed that the intensity of the characteristic absorption (C–N, 1240.5 cm−1) in the spectra of DPF is stronger than that of DCDA, giving that much more bonds of C–N are formed in DPF. These results demonstrate dicyandiamide successfully embedded phenolic resins by covalent bonds, and then the formation of nitrogen-doped carbon precursors (DPF). The related reaction mechanism between PF and DCDA is illustrated in Scheme 2.
C and the C–H corresponding to DCDA and benzene rings, are still observed in the spectrum of DPF. However, it is found that the characteristic absorptions of the O–H and the N–H disappear, indicating that the reaction occurs between the amino and hydroxyl groups. Additionally, it is observed that the intensity of the characteristic absorption (C–N, 1240.5 cm−1) in the spectra of DPF is stronger than that of DCDA, giving that much more bonds of C–N are formed in DPF. These results demonstrate dicyandiamide successfully embedded phenolic resins by covalent bonds, and then the formation of nitrogen-doped carbon precursors (DPF). The related reaction mechanism between PF and DCDA is illustrated in Scheme 2.
3.2 Morphologies of N-doped mesoporous carbons (NMC)
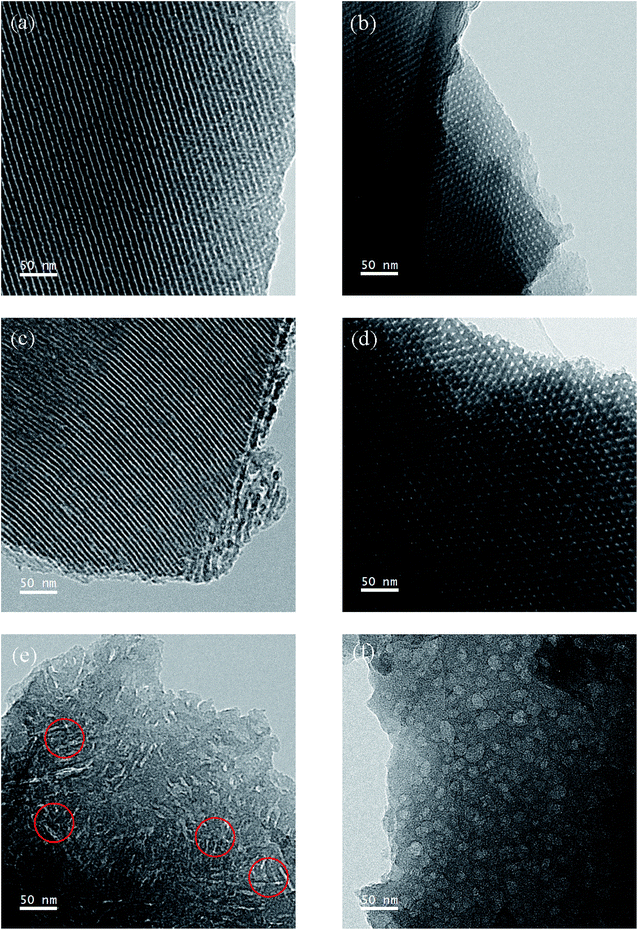
Fig. 2 presents transmission electron microscopy (TEM) images of N-doped mesoporous carbons (NMC-0.0, NMC-0.5, NMC-1.0 and NMC-1.2) with different nitrogen loadings. Large domains of highly ordered and strip-like mesostructures are observed for both NMC-0.0 and NMC-0.5 in Fig. 2(a) and (c), and 2D hexagonal arrays of mesoporous for NMC-0.0 and NMC-0.5 in Fig. 2(b) and (d), respectively. Additionally, the lattice sizes estimated from the TEM images are about 8.87 ± 0.85 nm for NMC-0.0 and 9.61 ± 1.52 nm for NMC-0.5, respectively. The pore diameter and wall thickness are 3.14 ± 1.28 nm and 6.65 ± 1.40 nm for NMC-0.0, respectively, whereas those are separately 3.32 ± 1.09 nm and 6.59 ± 2.35 nm for NMC-0.5. These results indicate that both NMC-0.0 and NMC-0.5 keep the ordered hexagonal P6mm mesostructures, but the lattice size, pore diameter and wall thickness of NMC-0.5 are slightly larger than those of NMC-0.0. However, the disordered strip-like mesostructures are observed for NMC-1.0 as shown in Fig. 2(e), and the pore diameter and the length of strips are measured approximately to 3.97 ± 0.36 nm and 44.05 ± 15.23 nm, respectively. Likewise, we find that about 80% of these strips are observed to form the inter-connected bridge structures, which can shortened the transport distance so as to provide fast and efficient diffusion of the electrolyte ions and excellent electron transport. When the molar ratio of dicyandiamide to phenol (x), that is the nitrogen content in MC, is further increased up to 1.2, isolate spheres for NMC-1.2 are observed in Fig. 2(f). These changes would attribute to the interaction between nitrogen functional groups and the carbon surface, causing the expansion of the mesoporous and even the distortions and collapses of the original highly ordered mesostructures.3.3 Structure of nitrogen-doped mesoporous carbons (NMC)
Fig. 3 elucidates small-angle XRD patterns of NMC-0.0, NMC-0.5 and NMC-1.0. Three resolved diffraction peaks in the patterns of both NMC-0.0 and NMC-0.5 are observed, which are indexed as 100, 110 and 200 reflections, corresponding to a 2D hexagonal mesostructure (P6mm space group).3 The unit cell parameters (a0) deduced from the small-angle XRD patterns are approximate to 9.01 nm and 9.39 nm for NMC-0.0 and NMC-0.5, respectively, in accordance with the above TEM observations. However, no evident peaks are observed in the pattern of NMC-1.0, indicating that highly ordered mesoporous structures are destroyed and are not observed any more. Therefore, it could be concluded from the small-angle XRD patterns that the obtained NMC-0.0 and NMC-0.5 still retain the highly ordered mesoporous structures, but the obtained NMC-1.0 possesses the disordered mesostructures.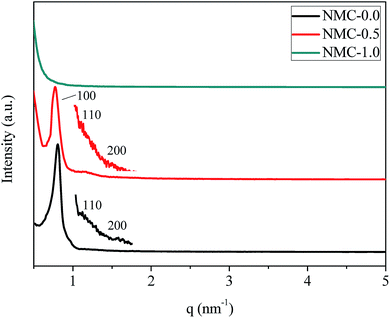 | ||
| Fig. 3 Small-angle XRD patterns of NMC-0.0, NMC-0.5 and NMC-1.0, where the short curves of NMC-0.0 and NMC-0.5 are the magnification with 20 times. | ||
Fig. 4 shows the nitrogen sorption results of NMC before and after KOH activation. A sharp uptake at P/P0 below 0.1 are displayed in all isotherms of Fig. 4(a) and (c), indicative of large micropores found in both NMC-x and A-NMC-x.28 Likewise, all nitrogen sorption isotherms exhibit the combination of type I and IV curves. However, NMC-x before KOH activation contain the typical type-IV curves with steep H4 hysteresis loops in the pressure of 0.5–1.0, which evidently indicate the existence of both mesoporous and micropores.29 Likewise, the pore size distributions decided by density functional theory (DFT)15 are presented in Fig. 4(b) and (d), also giving the existence of both micropores and mesoporous in both NMC-x and A-NMC-x. As shown in Fig. 4(b), when x is above 1.0, the mesoporous (pore width > 2.0 nm) possess much wide distribution, indicating that the pores formed by the cylindrical micelles (F127) are not uniform any more. Along with the continuous increase of nitrogen atoms, such interactions between nitrogen functional groups and the carbon surface would be prone to cause the expansion of the mesoporous in certain directions, and finally leading to the distortion and collapses of the original ordering structure.13 As such, when x is equal to 0.5, the width of mesoporous is slightly larger than those of NMC-0.0. With further increase of x, the distortions and collapses of the ordered mesostructures appear evidently, giving that the distribution of mesoporous becomes much wider. These results are well consistent with those obtained from both TEM and SAXS.
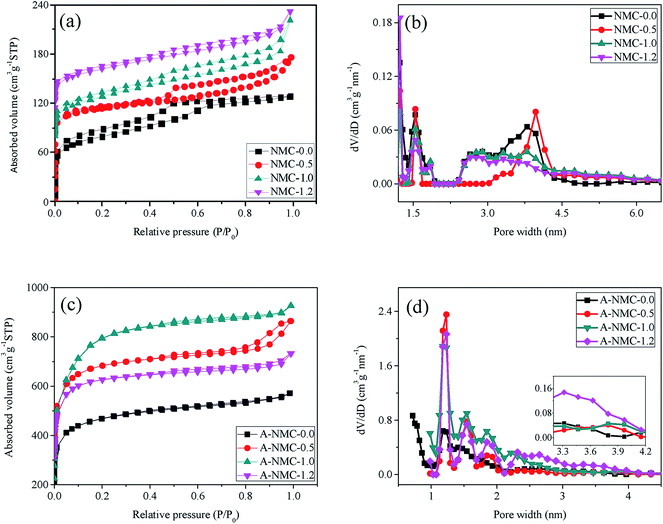 | ||
| Fig. 4 Nitrogen adsorption–desorption isotherms and DFT pore size distributions of NMC-x (a) and (b) and A-NMC-x (c) and (d). | ||
Textural properties deduced from these isotherms are listed in Table 1. It is found that in the presence of nitrogen atoms, the volumes of both micropores and mesoporous increase sharply after KOH activation. It is also deduced from Table 1 that when x ≤ 1.0, the mesoporous volumes in NMC-x and A-NMC-x are about half of their total pore volumes, that is to say, these mesoporous ratios in both NMC-x and A-NMC-x are close to 50%. Likewise, the specific surface area after KOH activation is found to increase along with the increase of nitrogen. When x is increased up to 1.0, the specific surface area and pore volume of A-NMC-1.0 increases up to 2828.8 m2 g−1 and 1.27 cm3 g−1, which are almost twice of A-NMC-0.0. With the further increase of x, for example, x = 1.2, the specific surface, the mesoporous ratio and the pore volume start to decrease conversely. The evident increase in the surface area of carbons with nitrogen-doping after KOH activation have also been observed in previous result that the specific surface area of N-doped activated carbon sheets fabricated by using glucose as carbon source and melamine as nitrogen source after KOH activation, is as high as 1997.5 m2 g−1, much higher than both this carbon sheets before activation (125.8 m2 g−1) and this carbon sheets without nitrogen (1120.9 m2 g−1).30 These results might be ascribed that during activation process, the molten KOH is feasible to immerse into the mesoporous channels, as well as the presence of nitrogen atoms would seriously promote the etching of the carbon framework, the gasification of carbon and the expansion of carbon lattices, thus leading to the further formation of much more micropores and mesoporous on the surface of carbons. Additionally, the excess of nitrogen would seriously distort and collapse the pre-formed mesoporous channels in NMC-x, leading to the decrease of the mesoporous ratio of both NMC-1.2 and A-NMC-1.2. Likewise, during KOH activation, only the nitrogen atoms on the surface of the effective pores would contribute to the increase of both the specific surface area and the pore volume. In addition, the pore sizes of NMC-0.0, NMC-0.5 and NMC-1.0 shown in Table 1 are found to agree well with the results of TEM.
| Samples | SBET (m2 g−1) | Vtotal (cm3 g−1) | Vmirco (cm3 g−1) | Pore width (nm) |
|---|---|---|---|---|
| a SBET: BET surface area, Vtotal: total pore volume calculated by density functional theory (DFT) method, Vmicro: pore volume of micropores calculated using the t-plot method. | ||||
| NMC-0.0 | 453.5 | 0.27 | 0.15 | 1.52, 2.83, 3.82 |
| NMC-0.5 | 448.8 | 0.26 | 0.14 | 1.52, 3.96 |
| NMC-0.8 | 385.6 | 0.20 | 0.13 | 1.54, 3.95 |
| NMC-1.0 | 421.9 | 0.29 | 0.14 | 1.52, 2.83, 3.82 |
| NMC-1.2 | 384.5 | 0.25 | 0.12 | 1.52, 2.83, 3.82 |
| A-NMC-0.0 | 1244.6 | 0.79 | 0.43 | 1.23, 1.52, 1.87, 3.38 |
| A-NMC-0.5 | 1890.8 | 1.15 | 0.64 | 1.23, 1.53, 1.88, 3.83 |
| A-NMC-0.8 | 2218.4 | 1.13 | 0.55 | 1.23, 1.53, 1.88, 3.83 |
| A-NMC-1.0 | 2828.8 | 1.27 | 0.71 | 1.23, 1.53, 1.87, 2.21, 3.83 |
| A-NMC-1.2 | 1841.9 | 1.00 | 0.68 | 1.23, 1.53, 1.87, 2.29, 2.67, 3.41 |
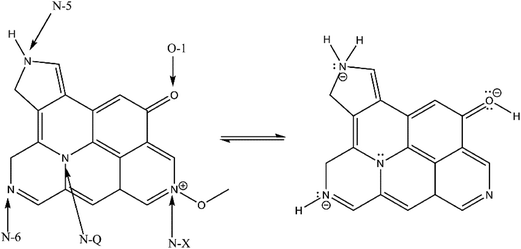
X-ray photoelectron spectroscopy (XPS) has been employed to clarify the relative surface concentrations and chemical environments in the carbon structures. One typical spectrum of NMC-1.0, including survey spectrum, C 1s, N 1s and O 1s spectra, is given in Fig. 5. The fractions of carbon atoms, four types of nitrogen atoms and three types of oxygen atoms in each sample (NMC-x) calculated from XPS analysis are summarized in Table 2. As listed in Table 2, the surface concentration of nitrogen increases as a function of the molar ratio of dicyandiamide to phenol, x. The nitrogen yields of NMC-x deduced by the surface concentration of nitrogen and the carbon yield, show that NMC-0.5 exhibits the highest nitrogen yield of 13.04%, and other NMC-x contain the nitrogen yield only close to 7.5%. In addition, the nitrogen yield of NMC-x fabricated by the DPF-x precursors in the present study is far higher than the previous report only by mechanically mixing the phenolic resins and dicyandiamide as the precursor.13 As shown in Fig. 5(b), three distinct peaks (284.3 eV, 285.0 eV and 287.8 eV) in the C 1s spectrum of NMC-1.0 correspond to the form of sp2 graphitic carbon, C–N and C![[double bond, length as m-dash]](https://www.rsc.org/images/entities/char_e001.gif) O, respectively. Four distinct peaks in the N 1s spectrum shown in Fig. 5(c) indicate pyridinic-N (N-6, 398.6 eV), pyrrolic-N (N-5, 400.0 eV), quaternary-N (N-Q, 400.9 eV) and pyridine-N-oxide (N-X, 403 eV). Pyridinic-N (N-6, 398.6 eV) which is sp2 bonded to two carbon atoms, donates one p electron to the aromatic system. Pyrrolic-N (N-5, 400.0 eV) associates with phenolic or carbonyl groups on the neighboring carbon atoms of the five membrane ring, while quaternary-N (N-Q, 400.9 eV) is bonded to three carbon atoms in the central or valley positions of the graphene layer. As shown in Fig. 5(d), oxygen atoms are assigned to C
O, respectively. Four distinct peaks in the N 1s spectrum shown in Fig. 5(c) indicate pyridinic-N (N-6, 398.6 eV), pyrrolic-N (N-5, 400.0 eV), quaternary-N (N-Q, 400.9 eV) and pyridine-N-oxide (N-X, 403 eV). Pyridinic-N (N-6, 398.6 eV) which is sp2 bonded to two carbon atoms, donates one p electron to the aromatic system. Pyrrolic-N (N-5, 400.0 eV) associates with phenolic or carbonyl groups on the neighboring carbon atoms of the five membrane ring, while quaternary-N (N-Q, 400.9 eV) is bonded to three carbon atoms in the central or valley positions of the graphene layer. As shown in Fig. 5(d), oxygen atoms are assigned to C![[double bond, length as m-dash]](https://www.rsc.org/images/entities/char_e001.gif) O quinine-type oxygen (O-1, 531 eV), C–OH phenol groups or C–O–C ether groups (O-2, 532 eV) and COOH chemisorbed oxygen or water (O-3, 533 eV).16 As reported previously,14 N-5, N-6 and N-X are responsible for the pseudo-capacitance, where N-Q can affect electron transfer through the carbon frameworks. Among oxygenous groups, only quinine-type oxygen (O-1) is electrochemically active in an acidic electrolyte.16 Scheme 3 presents the reaction mechanisms of N-5, N-6, N-X and O-1.
O quinine-type oxygen (O-1, 531 eV), C–OH phenol groups or C–O–C ether groups (O-2, 532 eV) and COOH chemisorbed oxygen or water (O-3, 533 eV).16 As reported previously,14 N-5, N-6 and N-X are responsible for the pseudo-capacitance, where N-Q can affect electron transfer through the carbon frameworks. Among oxygenous groups, only quinine-type oxygen (O-1) is electrochemically active in an acidic electrolyte.16 Scheme 3 presents the reaction mechanisms of N-5, N-6, N-X and O-1.
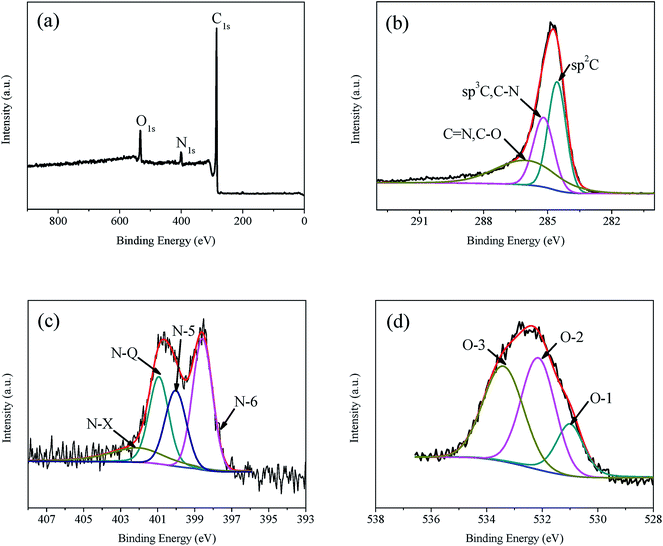 | ||
| Fig. 5 XPS spectra of NMC-1.0. (a) Survey spectrum, (b) C 1s spectrum, (c) N 1s spectrum, (d) O 1s spectrum. | ||
| Samples | Carbon content (at%) | Nitrogen content (at%) | Oxygen content (at%) | Composition of nitrogen (%) | Composition of oxygen (%) | Carbon yield (%) | Nitrogen yield (%) | |||||
|---|---|---|---|---|---|---|---|---|---|---|---|---|
| N-6 | N-5 | N-Q | N-X | O-1 | O-2 | O-3 | ||||||
| NMC-0.0 | — | — | — | — | — | — | — | — | — | — | 51.2 | — |
| NMC-0.5 | 87.49 | 3.93 | 8.58 | 29.26 | 49.67 | 21.07 | — | 8.30 | 45.10 | 46.60 | 52.4 | 13.04 |
| NMC-0.8 | 85.75 | 3.96 | 10.29 | 38.13 | 23.17 | 36.71 | 1.99 | 22.20 | 42.29 | 35.51 | 48.2 | 8.11 |
| NMC-1.0 | 86.24 | 4.09 | 9.67 | 36.84 | 22.59 | 26.08 | 14.49 | 17.84 | 40.97 | 41.19 | 46.4 | 6.78 |
| NMC-1.2 | 86.98 | 5.50 | 7.52 | 29.23 | 35.84 | 31.65 | 3.82 | 20.53 | 44.07 | 35.40 | 44.4 | 7.65 |
3.4 Electrochemical performance
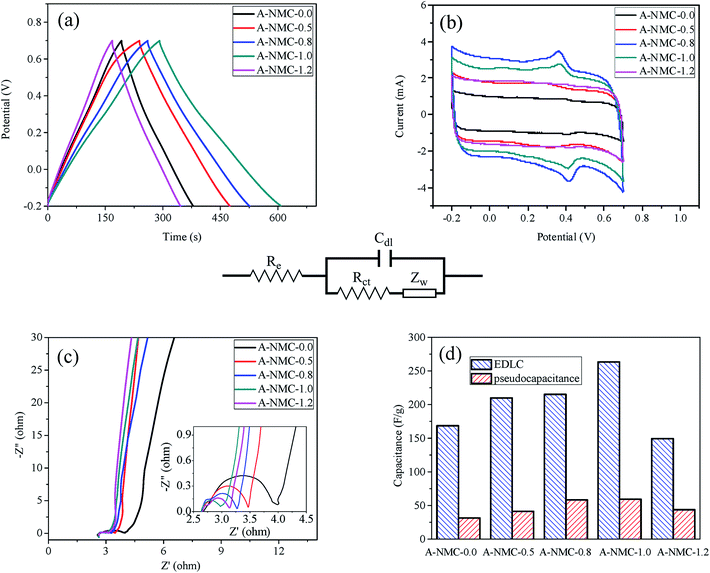
The galvanostatic charge/discharge curves of A-NMC-x are presented at a current density of 1.0 A g−1. It can be seen in Fig. 6(a) that all curves show little variations in slopes, different from typical linear and symmetrical triangle shapes (EDLCs). The specific capacitances of all A-NMC-x obtained from the galvanostatic discharge/charge curves, show that the specific capacitance of A-NMC-1.0 has the maximum value of 337.7 ± 14.0 F g−1, while A-NMC-0.0 in the absence of nitrogen attains the lowest capacitance of 205.8 ± 2.7 F g−1. Likewise, with the increase of x, as well as the nitrogen content in all samples, the specific capacitance of A-NMC-x increases, when x increases up to 1.0, the specific capacitance shows the maximum, and then with a further increase of x, the specific capacitance show slightly decrease. The dependence of the specific capacitance on the nitrogen content, x, is well consistent with the change of the specific surface area on x. It is therefore concluded that the more specific surface area, the more specific capacitance is.Fig. 6(b) shows the CV curves of A-NMC-x at a scan rate of 5 mV s−1. In the presence of nitrogen, the CV curves exhibit humps as well as rectangular shapes. The incorporated heteroatoms, N and O, would attribute to several redox reactions overlapping one to another, thus leading to a couple of broad current peaks.16 As such, electrical double layer formation and redox reactions are contributed to the capacitances of A-NMC-x. The capacitances as reported previously31 are divided into EDLCs and pseudocapacitance and are shown in Fig. 6(d). It is found that the EDLCs of A-NMC-0.0 is low to 166.8 F g−1, as well as the EDLCs of A-NMC-x is found to enhance along with the increase x. When x increases up to 1.0, A-NMC-1.0 achieves the EDLCs up to the maximum of 257.7 F g−1. This result is mainly due to the fact that A-NMC-1.0 possesses the largest specific surface area, moderate pore size, and inter-connected bridge structures. Similar change trends are observed for the dependence of the pseudocapacitance on x, but the pseudocapacitances of all A-NMC-x are less than 60 F g−1. Thus, the contributions of EDLCs, not the pseudocapacitance play important role in the specific capacitances of A-NMC-x. Likewise, the specific surface area of A-NMC-x contributed to the EDLCs, increases sharply as a function of nitrogen. Whereas, the N-5, N-6, N-X and O-1 functional groups which can provide pseudocapacitance through the faradic redox reactions, possess less contents in all NMC-x samples as deduced from the above XPS results. Therefore, carbons with large specific surface area could exhibit the outstanding electrochemical performance as supercapacitance electrodes.
Fig. 6(c) shows the Nyquist plots of A-NMC-x ranged from 10 mHz to 100 kHz. The impedance spectra of all curves are almost similar in the form of an arc at a higher frequency region and a spike at a lower frequency region. The measured impedance spectra are analyzed using the complex nonlinear least-squares (CNLS) fitting method32 in the light of the equivalent circuit shown in the middle of Fig. 6. At very high frequencies, the intercept at real part (Z′) indicates a resistance at the active material/current collector interface (Re). This value (Re) for all samples is close to 2.8 Ω due to these electrodes located at the same electrolyte. The semicircle in the high-frequency range corresponds to both the charge transfer resistance (Rct) caused by the faradic reactions and the double-layer capacitance (Cdl) on the grain surface.33 It is well known that the higher the charge-transfer resistance of the electrode, the lower the specific capacitance is. Rct of A-NMC-1.0 is approximately 0.46 Ω with the least value among those samples, whereas A-NMC-1.0 have the maximum values of both the double-layer capacitance (Cdl) and the specific surface area. In addition, the Warburg resistance (Zw) can obtained from the slope of the 45 degree portion of the curve. A-NMC-0.0 in the absence of nitrogen attains the least value of Zw, exhibiting typically double-layer capacitance.
Fig. 7(a) shows the first charge/discharge curves of A-NMC-1.0 at the current density varying from 0.5 to 10 A g−1. The specific capacitance of A-NMC-1.0 is found to decrease from 368.2 ± 19.8 F g−1 at 0.5 A g−1 down to 279.9 ± 8.7 F g−1 at 10 A g−1. The average capacitances of A-NMC-x obtained from five measurements are presented in Fig. 7(b) as a function of the current density. The capacitance of all samples are found to decrease as a function of the current density, but when the current density increases up to 20 A g−1, the capacitance of each sample almost keeps unchanged along with the further increase of the current density. In addition, it is found that when the current density increases from 0.5 to 50 A g−1, the specific capacitance of all samples possess a retention rate close to 70%, which is much higher than the previously reported results of nitrogen-doped porous carbons.16,18 The high retention rate in the high current density might be ascribed to the high mesoporous ratios of A-NMC-x. Additionally, the incorporation of dicyandiamide into phenolic resins cannot completely change the interconnected micropores/mesoporous structures. However, nitrogen functional groups are favorable to improve both the specific surface area and the interface wettability between the electrode and the electrolyte through the hydrophilic polar sites, giving the higher specific capacitance along with the increase of nitrogen atoms.
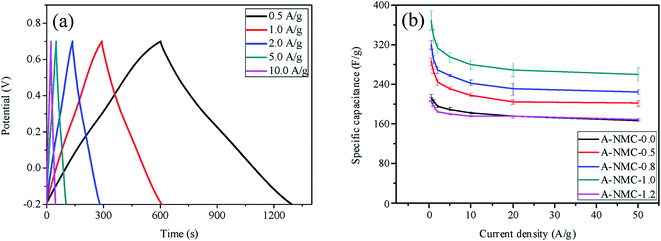 | ||
| Fig. 7 (a) The first charge–discharge curves of A-NMC-1.0 at different current densities, (b) the average specific capacitances of A-NMC-x at the current density ranged from 0.5 A g−1 to 50 A g−1. | ||
Fig. 8 presents the CV curves of A-NMC-0.0 (a) and A-NMC-1.0 (b) as a function of scan rates. Both A-NMC-0.0 and A-NMC-1.0 exhibits the typical capacitive behavior with several humps and rectangular shaped voltammetry characteristic from −0.2 to 0.7 V over a wide range of scan rates. Evidently, A-NMC-1.0 shows better rate capability than that of A-NMC-0.0 as far as the current responses at different scan rates are concerned.
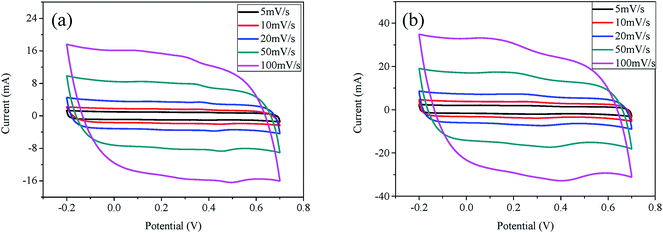 | ||
| Fig. 8 CV curves of A-NMC-0.0 (a) and A-NMC-1.0 (b) at different scan rates varying from 5 to 100 mV s−1. | ||
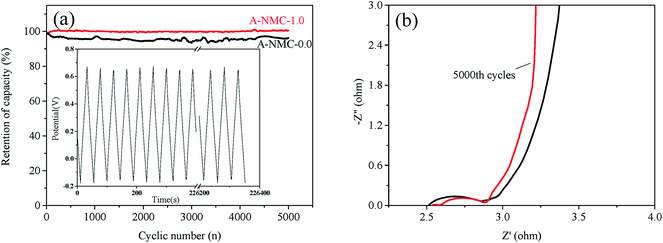
To investigate the cycle stability, 5000 consecutive cycles of charge–discharge are recorded for A-NMC-0.0 and A-NMC-1.0 at a current density of 10 A g−1, as shown in Fig. 9. In the inset of Fig. 9(a), the charge/discharge curves of A-NMC-1.0 remain better triangle shapes even up to 5000th cycle. After 5000 cycles, the capacitance retention of A-NMC-1.0 is close 100%, slightly higher than that of A-NMC-0.0 (about 95%). The impedance spectra of A-NMC-1.0 after 1st and 5000th cycle are shown in Fig. 9(b). It is found that the values of Re, Rct and Cdl all decreases slightly after 5000 cycles, and the Warburg resistance (Zw) attributed by the frequency dependence of ion diffusion/transport in the electrode surface decreases evidently from 0.35 to 0.038 Ω. Less Zw of the electrode indicates that due to the decrease of the diffusion and transfer of electrons/ions arisen from Faraday reactions, the electrode attains the typical double-layer capacitance. Therefore, the result indicates that after 5000 cycles, A-NMC-1.0 shows better double-layer capacitance, while the pseudocapacitance gradually disappears. Likewise, the presence of nitrogen would improve the wettability between electrode and aqueous electrolytes. This result also suggests that after 5000 cycles, the capacitance retention of A-NMC-1.0 could achieve close to 100%.
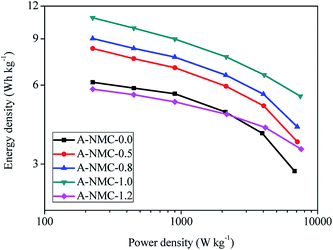
Fig. 10 presents the Ragone curves of A-NMC-x. The Ragone curves are obtained by E = C(ΔV)2/8 and P = E/Δt,34 where E is the energy density (W h kg−1), C is the specific capacitance (A h kg−1 V−1), ΔV is a potential range (V), the voltage drop (IR drop) is considered when the current density more than 2 A g−1. P is the power density (W kg−1), Δt is the discharge time (h). At the current density of 0.5 A g−1, the energy density of A-NMC-1.0 is up to 10.83 W h kg−1, and the corresponding power density is 225 W kg−1, while the energy density of A-NMC-0.0 is only 6.15 W h kg−1, and the power density is 225 W kg−1. When the current density increases up to 20 A g−1, the energy density of A-NMC-1.0 still remains 5.44 W h kg−1, and the power density is 7464 W kg−1. At this time, the energy density of A-NMC-0.0 decrease sharply to 2.82 W h kg−1, and the power density is 6775 W kg−1. The energy density of A-NMC-1.0 are larger than those reported previously in N-doped carbons.34–38 Therefore, the N-doped mesoporous carbons presented here has a very good application prospect as supercapacitor electrode materials.
4. Conclusions
In summary, we have demonstrated a solvent-evaporation-induced self-assembly (EISA) method to controllably prepare nitrogen-doped mesoporous carbons using a novel precursor in which dicyandiamide, phenol and formaldehyde are covalently linked together. At low content of nitrogen (x < 1.0), nitrogen-doped mesoporous carbons still keep the highly ordered hexagonal mesostructures. When x increases up to 1.0, the disordered strip-like mesostructures are observed and the inter-connected bridges are formed between these stripes. With the further increase of x, the strip-like mesostructures are further distorted and collapsed, as well as the isolated spheres are observed. During KOH activation process, much more micropores and mesopores are found to form on the surface of carbons, especially when the pore size and structures are suitable for the immersion of molten KOH. The specific surface area of A-NMC-x increases to the highest value of 2828.8 m2 g−1 when x increases from 0 to 1.0, and then gradually decreases with the further increase of x. The dependence of the specific capacitance of N-doped mesoporous carbons on x is similar with the specific surface area on x. At x = 1.0, the N-doped mesoporous carbons based supercapacitor electrodes exhibit the highest specific capacitance of 388 F g−1 at the current density of 0.5 A g−1. Likewise, these N-doped mesoporous carbons show good rate capability with 70% of the capacitance retained even at a high current density of 50 A g−1 and excellent capacitance retention with no obvious decay observed after 5000 cycles at the current density of 10 A g−1. It is therefore demonstrated that the synthesized N-doped mesoporous carbons could be used as one advanced carbon electrode materials for high performance supercapacitors.Acknowledgements
The financial supports of this work are provided by the National Natural Science Foundation of China (grant no. 21274038 and 21674034). Dr Chen thanks the support of the start-up funding provided by Hunan University (531107040982).References
- W. Li, J. Liu and D. Y. Zhao, Nat. Rev. Mater., 2016, 1, 16023 CrossRef CAS.
- C. D. Liang, Z. J. Li and S. Dai, Angew. Chem., Int. Ed., 2008, 47, 3696–3717 CrossRef CAS PubMed.
- Y. Meng, D. Gu, F. Q. Zhang, Y. F. Shi, L. Cheng, D. Feng, Z. X. Wu, Z. X. Chen, Y. Wan, A. Stein and D. Y. Zhao, Chem. Mater., 2006, 18, 4447–4464 CrossRef CAS.
- D. Feng, Y. Lv, Z. Wu, Y. Dou, L. Han, Z. Sun, Y. Xia, G. Zheng and D. Zhao, J. Am. Chem. Soc., 2011, 133, 15148–15156 CrossRef CAS PubMed.
- Y. Y. Lv, F. Zhang, Y. Q. Dou, Y. P. Zhai, J. X. Wang, H. J. Liu, Y. Y. Xia, B. Tu and D. Y. Zhao, J. Mater. Chem., 2012, 22, 93–99 RSC.
- X. C. Zhao, Q. Zhang, C. M. Chen, B. S. Zhang, S. Reiche, A. Q. Wang, T. Zhang, R. Schlögl and D. S. Su, Nano Energy, 2012, 1, 624–630 CrossRef CAS.
- J. P. Paraknowitsch and A. Thomas, Energy Environ. Sci., 2013, 6, 2839–2867 CAS.
- X. Q. Yang, D. C. Wu, X. M. Chen and R. W. Fu, J. Phys. Chem. C, 2010, 114, 8581–8586 CAS.
- N. D. Kim, W. Kim, J. B. Joo, S. Oh, P. Kim, Y. Kim and J. Yi, J. Power Sources, 2008, 180, 671–675 CrossRef CAS.
- H. Chen, M. Zhou, Z. Wang, S. Zhao and S. Guan, Electrochim. Acta, 2014, 148, 187–194 CrossRef CAS.
- G. Tian, L. Liu, Q. Meng and B. Gao, J. Power Sources, 2015, 274, 851–861 CrossRef CAS.
- M. J. Xie, Y. Xia, J. Liang, L. Chen and X. F. Guo, Microporous Mesoporous Mater., 2014, 197, 237–243 CrossRef CAS.
- J. Wei, D. D. Zhou, Z. K. Sun, Y. H. Deng, Y. Y. Xia and D. Y. Zhao, Adv. Funct. Mater., 2013, 23, 2322–2328 CrossRef CAS.
- Y. T. Hu, H. J. Liu, Q. Q. Ke and J. Wang, J. Mater. Chem. A, 2014, 2, 11753–11758 CAS.
- Y. F. Song, J. Yang, K. Wang, S. Haller, Y. G. Wang, C. X. Wang and Y. Y. Xia, Carbon, 2016, 96, 955–964 CrossRef CAS.
- Y. F. Song, L. Li, Y. G. Wang, C. X. Wang, Z. P. Guo and Y. Y. Xia, ChemPhysChem, 2014, 15, 2084–2093 CrossRef CAS PubMed.
- D. Liu, C. Zeng, D. Y. Qu, H. L. Tang, Y. Li, B. L. Su and D. Y. Qu, J. Power Sources, 2016, 321, 143–154 CrossRef CAS.
- M. Zhou, F. Pu, Z. Wang and S. Guan, Carbon, 2014, 68, 185–194 CrossRef CAS.
- L. Hadidi, E. Davari, M. Iqbal, T. K. Purkait, D. G. Ivey and J. G. C. Veinot, Nanoscale, 2015, 7, 20547 RSC.
- T. Yang, J. Liu, R. Zhou, Z. Chen, H. Xu, S. Z. Qiao and M. J. Monteiro, J. Mater. Chem. A, 2014, 2, 18139 CAS.
- Y. S. Yun, M. H. Park, S. J. Hong, M. E. Lee, Y. W. Park and H. Jin, ACS Appl. Mater. Interfaces, 2015, 7, 3684–3690 CAS.
- G. A. Ferrero, A. B. Fuertes and M. Sevilla, J. Mater. Chem. A, 2014, 3, 2914–2923 Search PubMed.
- Q. Liang, L. Ye, Z. Huang, Q. Xu, Y. Bai, F. Kang and Q. Yang, Nanoscale, 2014, 6, 13831 RSC.
- Z. Zhao, Y. Wang, M. Li and R. Yang, RSC Adv., 2015, 5, 34803–34811 RSC.
- T. Zhu, J. Zhou, Z. Li, S. Li, W. Si and S. Zhou, J. Mater. Chem. A, 2014, 2, 12545 CAS.
- A. Burke, J. Power Sources, 2000, 91, 37–50 CrossRef CAS.
- T. Otowa, R. Tanibata and M. Itoh, Sep. Purif. Technol., 1993, 7, 241–245 CrossRef CAS.
- M. Chen, L. L. Shao, Y. P. Liu, T. Ren and Z. Y. Yuan, J. Power Sources, 2015, 283, 305–313 CrossRef CAS.
- C. Goel, H. Bhunia and P. K. Bajpai, RSC Adv., 2015, 5, 46568–46582 RSC.
- Y. L. Wang, H. Q. Xuan, G. X. Lin, F. Wang, Z. Chen and X. P. Dong, J. Power Sources, 2016, 319, 262–270 CrossRef CAS.
- Z. Y. Lin, Y. Liu, Y. G. Yao, O. J. Hildreth, Z. Li, K. Moon and C. P. Wong, J. Phys. Chem. C, 2011, 115, 7120–7125 CAS.
- J. Yan, Z. J. Fan, T. Wei, W. Z. Qian, M. L. Zhang and F. Wei, Carbon, 2010, 48, 3825–3833 CrossRef CAS.
- G. J. Wang, Q. T. Qu, B. Wang, Y. Shi, S. Tian, Y. P. Wu and R. Holze, J. Power Sources, 2009, 189, 503–506 CrossRef CAS.
- Y. M. Tan, C. F. Xu, G. X. Chen, Z. H. Liu, M. Ma, Q. J. Xie, N. F. Zheng and S. Z. Yao, ACS Appl. Mater. Interfaces, 2013, 5, 2241–2248 CAS.
- G. Ma, F. Ran, H. Peng, K. Sun, Z. Zhang, Q. Yang and Z. Lei, RSC Adv., 2015, 5, 83129–83138 RSC.
- F. Miao, C. Shao, X. Li, K. Wang and Y. Liu, J. Mater. Chem. A, 2016, 4, 4180–4187 CAS.
- L. Wang, Z. Y. Gao, J. L. Chang, X. Liu, D. P. Wu, F. Xu, Y. M. Guo and K. Jiang, ACS Appl. Mater. Interfaces, 2015, 7, 20234–20244 CAS.
- L. F. Chen, Z. H. Huang, H. W. Liang, W. T. Yao, Z. Y. Yu and S. H. Yu, Energy Environ. Sci., 2013, 6, 3331–3338 CAS.
| This journal is © The Royal Society of Chemistry 2017 |

