 Open Access Article
Effect of dietary oxidized tyrosine products on insulin secretion via the oxidative stress-induced mitochondria damage in mice pancreas
Yin-Yi Ding a,
Xiang-Rong Chenga,
Zhu-Qing Lia,
Sha-Ji Wua,
Yuhui Yanga,
Yong-Hui Shiab and
Guo-Wei Le*ab
aFood Nutrition and Functional Factors Research Center, School of Food Science and Technology, Jiangnan University, Wuxi, 214122, China
bThe State Key Laboratory of Food Science and Technology, School of Food Science and Technology, Jiangnan University, Lihu Avenue 1800, Wuxi 214122, China. E-mail: lgw@jiangnan.edu.cn; Fax: +86 510 8591 7789; Tel: +86 510 8591 7789
First published on 19th May 2017
Abstract
Oxidized tyrosine products (OTPs) have been detected in commercial food and have been demonstrated to induce oxidative damage in vivo. The pancreas plays an important role in glucose metabolism, but its antioxidant capacity is low. The present study investigates the potential impact of dietary OTPs on the pancreatic function. Sprague Dawley (SD) rats (8 rats per group) were fed a diet containing OTPs for 24 weeks, and the blood glucose and plasma insulin levels were then measured. Elevated fasting blood glucose and decreased plasma insulin levels indicated dysfunction of the pancreatic islets. The rats fed the OTPs-containing diet also exhibited pancreatic oxidative stress, accompanied by inflammation. Furthermore, the expression of genes involved in the Nrf2/ARE pathway was down-regulated in the OTPs-treated groups. In addition, supplementation with lipoic acid (LA) significantly remitted the OTPs induced oxidative stress of the pancreas, and mitigated the effects of OTPs on the blood glucose and insulin synthesis. A gavage experiment was performed to explore whether dityrosine (Dityr), a major component of OTPs, was responsible for the injury induced by OTP. The OTPs, including Dityr, induced mitochondrial defects in cultured mice insulinoma MIN-6 cells and mice pancreas, as evidenced by less ATP production, loss of mitochondrial membrane potential, mitochondrial DNA (mtDNA) depletion, and alteration of the mRNA levels of genes involved in mitochondrial function. Moreover, the apoptosis of pancreatic islets and MIN-6 cells increased after exposure to OTPs/Dityr. The findings suggest that decreased insulin secretion triggered by OTPs may be mediated by oxidative stress and mitochondrial damage in pancreatic β cells.
1. Introduction
During food processing and storage, protein are targets for many oxidants such as radicals and non-radicals, under conditions of high temperature, extrusion, and shearing force.1,2 Tyrosine residues play a major role in several metabolic pathways, including insulin synthesis and insulin signaling sensibility.3,4 However, tyrosine is readily oxidized to dityrosine (Dityr),5 a typical oxidized tyrosine product. The Dityr is a cross-linking oxidized protein product with a stable structure that is resistant to acid hydrolysis and proteases.6,7 It has been proved that the accumulation of Dityr in tissues is associated with many diseases, including Parkinson's disease, asthma and Alzheimer's disease.8–10Dietary oxidized tyrosine products (OTPs) can also contribute to some metabolism disorders.11 The consumption of milk containing oxidized protein has negative effects on children, including lower growth rates, eczema and dry stool.12,13 In previous studies, we verified that long-term exposure to oxidized casein or oxidized tyrosine impaired the antioxidant defense system and induced hepatic and renal fibrosis.14,15 Previous research also suggested that Dityr could induce oxidative damage in the brain, leading to novel object recognition deficits.16
Given the findings of the aforementioned studies, examining the relationship between oxidized proteins and oxidative stress is presently a major research topic. Redox status is crucial for normal metabolism. However, the pancreas inherently contains only a fraction of the antioxidant enzymatic activities, in comparison to the liver.17 As result, the pancreas may be a major target of oxidative stress in the condition of diabetes. In patients with diabetes, the activities of antioxidant enzymes in the plasma are weaker than those of individuals without diabetes.18 The influence of oxidative damage induced by oxidized proteins on the bio-function of pancreatic β cells has not been fully explored.
The mitochondrion is a key organelle in β cells, which is crucial for ATP generation and other factors that link glucose metabolism to insulin secretion.19–21 However, mitochondria are susceptible to oxidative damage, and excessive generation of reactive oxygen species (ROS) can lead to mitochondrial dysfunction.22,23 The activities of antioxidant enzymes are largely responsible for the protection of mitochondria against ROS.24 Although a number of stimuli modulate the synthesis and release of insulin, mitochondrial oxidative metabolism is the most important factor in glucose-stimulated insulin secretion.25
In the present study, we investigate the effects of OTPs on insulin secretion and the redox status of the pancreas. Since Dityr accounts for 22% of OTPs,26 the potential role of Dityr in pancreatic injury induced by OTPs was studied in a 10 week gavage experiment involving C57BL/6 mice administered with OTPs or pure Dityr. This study also examines whether exposure to Dityr results in mitochondrial dysfunction, subsequently attenuated insulin secretion and ultimately, triggered hyperglycemia.
2. Materials and methods
2.1. Oxidized tyrosine products preparation
OTP was prepared by our laboratory according to the method of Kurahashi,27 with a little modification, as previously described.26 Briefly, L-tyrosine was dispersed in 0.05 M phosphate buffer (pH 7.4) with the concentration of 1 mg mL−1. The tyrosine solution was added to H2O2 (5 mM) and CuSO4 (0.05 mM) and mixed in sealed tubes. The mixtures were shaken at 60 rpm in a thermostatic bath at 45 ± 0.1 °C for 2 h. At the end of the reaction, Cu2+ was removed using cation exchange resin. Freeze-drying was applied to remove the remaining hydrogen peroxide and dry the OTPs sample. The major constituents of OTPs were assessed in the previous study in our lab and it was found that the OTPs sample mainly contained Dityr, the content of which was 22% (w/w).262.2. 24 week dietary OTPs experiment in SD rats
After 7 days of acclimatization, SD rats were divided into 5 groups (n = 8):
Control group (rats received the standard diet);
OTP1 group (rats received the standard diet together with 4 g kg−1 of OTPs);
OTP2 group (rats received the standard diet together with 8 g kg−1 of OTPs);
OTP + LA group (rats received 8 g kg−1 of OTPs and 2 g kg−1 of lipoic acid (LA)).
Tyr group (rats received the standard diet together with 8 g kg−1 of tyrosine).
The dose of OTPs we used in this experiment was consistent with the previous studies in our lab.26 All animal treatments were performed in accordance with the ethical standards laid down in the guidelines of National Institutes of Health Guide for the Care and Use of Laboratory Animals (China) and in the 1964 Declaration of Helsinki and its later amendments. All animal studies were approved by the Laboratory Animals Ethics Committee of Jiangnan University.
The activity of superoxide dismutase (SOD), catalase (CAT), glutathione peroxidation (GPx), and malondialdehyde (MDA) levels in the pancreas and total antioxidants (T-AOC), reduced glutathione (GSH), oxidized glutathione (GSSG) in the blood were assayed by corresponding kits (Jiancheng Bioengineering Institute, Nanjing, P. R. China). Total protein contents were determined by the method of Lowry et al.,28 using bull serum albumin (BSA) as the protein standard. The levels of tumor necrosis factor-α (TNF-α), interleukin-6 (IL-6) in the plasma, Dityr and 3-nitrotyrosine (3-NT) in the pancreas were measured using the rat ELISA kits (Huijia Biotechnology, Xiamen, P. R. China), according to the manufacturer's instructions.
2.3. 10 week gavage experiment using OTPs and Dityr in C57BL/6 mice
2.4. Cell experiment using mice MIN-6 cells
2.5. Mitochondrial DNA copy number analysis
Total DNA of cells and tissues was extracted with Trizol reagent according to the manufacturer's protocol (Applied Biosystems, Foster City, CA, USA). The concentration of total DNA in each sample was quantified using a NanoDrop Spectrophotometer (ND2000, Thermo, Waltham, MA, USA). Relative quantification of mt-ND2 (mitochondrial DNA, mtDNA) and control nβ2M (nuclear DNA, nDNA) was conducted in MIN-6 cells and the pancreas of C57BL/6 mice, based on a qRT-PCR protocol. The ratio of mtDNA/nDNA is the indicator of the mtDNA copy number.292.6. Determination of mitochondrial membrane potential
The mitochondrial membrane potential in MIN-6 cells and the pancreas of C57BL/6 mice was measured using 5,5′,6,6′-tetrachloro-1,1′3,3′-tetra-ethylimidacarbocyanine iodide fluorescent probe (JC-1) (Beyotime Biotechnology, Shanghai, P. R. China). The mitochondrial membrane potential loss was reflected by the increased green fluorescence from JC-1 monomers as well as the reduction of red fluorescence from JC-1 aggregates. The mitochondrial membrane potential in the pancreas of C57BL/6 mice was measured using a fluorescence spectrophotometer (FlourMax-4, HORIBA, Tokyo, Japan). The mitochondrial membrane potential in MIN-6 cells was measured using a cell sorter (BD FACSAria II, BD Biosciences, Sandra Jose, CA, USA).2.7. Protein extracts and western blot analysis
Protein was extracted from the mouse pancreas and MIN-6 cells using RIPA lysis buffer (P0013B), which was purchased from Beyotime Institute of Biotechnology (Shanghai, China). The lysis buffer mainly contained 50 mM of Tris (pH 7.4), 150 mM NaCl, 1% Triton X-100, 1% sodium deoxycholate, 0.1% SDS and protease inhibitors, including sodium orthovanadate, sodium fluoride, EDTA and leupeptin. According to the manufacturer's instructions, 1 mM (final concentration) phenylmethanesulfonyl fluoride (PMSF) was added to the lysis buffer before use. 200 mg of pancreas and cells were homogenized in 1.5 mL lysis buffer on ice. After complete lysis, the homogenate was centrifuged for 5 min at 12![[thin space (1/6-em)]](https://www.rsc.org/images/entities/char_2009.gif) 000g. Protein concentration in the supernatant was determined by the BCA assay kit from Nanjing Jiancheng Bioengineering Institute (Nanjing, China), according to the instructions of the manufacturer. All extracts were mixed with 5× loading buffer (50 mmol L−1 pH−1 6.8 Tris–HCl, 100 mm L−1 dithiothreitol, 2% SDS, 0.1% bromophenol blue, 10% glycerol and 5% β-mercaptoethanol) in the ratio of 4
000g. Protein concentration in the supernatant was determined by the BCA assay kit from Nanjing Jiancheng Bioengineering Institute (Nanjing, China), according to the instructions of the manufacturer. All extracts were mixed with 5× loading buffer (50 mmol L−1 pH−1 6.8 Tris–HCl, 100 mm L−1 dithiothreitol, 2% SDS, 0.1% bromophenol blue, 10% glycerol and 5% β-mercaptoethanol) in the ratio of 4![[thin space (1/6-em)]](https://www.rsc.org/images/entities/char_2009.gif) :
:![[thin space (1/6-em)]](https://www.rsc.org/images/entities/char_2009.gif) 1, and were then boiled at 95 °C for 10 min to denature the protein.
1, and were then boiled at 95 °C for 10 min to denature the protein.
Protein extracts were separated on 12% SDS-PAGE gel using 10 μg protein per sample and then transferred onto the NC membrane. The membrane was blocked in Tris-buffered saline (pH 7.4) with 5% BSA and 0.1% Tween 20. Afterwards, the blocked membrane was incubated with primary antibody, including rabbit MT-ND1 antibody (ab74257, Abcam, Shanghai, China) and rabbit β-actin antibody (ab8226, Abcam, Shanghai, China) at a dilution of 1![[thin space (1/6-em)]](https://www.rsc.org/images/entities/char_2009.gif) :
:![[thin space (1/6-em)]](https://www.rsc.org/images/entities/char_2009.gif) 1000 at 4 °C for 10 hours. Blots were incubated with secondary antibody (Sigma-Aldrich, U.S.A.) at a dilution of 1
1000 at 4 °C for 10 hours. Blots were incubated with secondary antibody (Sigma-Aldrich, U.S.A.) at a dilution of 1![[thin space (1/6-em)]](https://www.rsc.org/images/entities/char_2009.gif) :
:![[thin space (1/6-em)]](https://www.rsc.org/images/entities/char_2009.gif) 4000, and fluorescence images were obtained with the automatic chemiluminescence imaging analysis system (Tannon 5200, Shanghai, China).
4000, and fluorescence images were obtained with the automatic chemiluminescence imaging analysis system (Tannon 5200, Shanghai, China).
2.8. Total mRNA isolation and quantitative RT-PCR (qRT-PCR)
Total RNA of cells and tissues was extracted with Trizol reagent according to the manufacturer's protocol (Applied Biosystems, Foster City, CA, USA). The concentration of total RNA in each sample was quantified by NanoDrop Spectrophotometer (ND2000, Thermo, Waltham, MA, USA). A SYBR green based qRT-PCR kit was used according to the manufacturer's instructions in a 7900HT instrument (Applied Biosystems, Forster, CA, USA). The specificity of the product was assessed from melting curve analysis. Gene expressions were determined using the 2−ΔΔCt method. The primer's sequences for the genes are shown in Tables 1 and 2.| Gene | Forward (5′ to 3′) | Reverse (5′ to 3′) |
|---|---|---|
| Pdx-1 | TCTGCCTCTGGGACTCTTTC | TCGCCTGGTGGCTGTTAT |
| Mafa | TCCTCGCTCATTTGCTCTG | GGTAAGTTCCTCGGCTTCCT |
| Glut2 | TTTGGGTGTTCCTCTGGATG | CGTCTGGTGTCGTATGTGCT |
| Gck | TCACCTTCTCCTTCCCTGTG | ACGATGTTGTTCCCTTCTGC |
| Creb | GGAGTTGTTATGGCGTCCTC | TCTTGCTGCTTCCCTGTTCT |
| Nrf2 | TTCAGCCAGGCTATAAGTCAGG | GCTCAGGATTGGTGGTATGAGA |
| Ho-1 | AAGACTGCGTTCCTGCTCAAC | AAAGCCCTACAGCAACTGTCG |
| Gpx-1 | CAGTCGGTGTATGCCTTCTCG | GAGGGACGCCACATTCTCG |
| β-Actin | TGTCACCAACTGGGACGATA | GGGGTGTTGAAGGTCTCAAA |
| Gene | Forward (5′ to 3′) | Reverse (5′ to 3′) |
|---|---|---|
| Glut2 | ACCCCACTTACAGTCACACCA | CACAGACAGAGACCAGAGCATAG |
| Gck | AGGAGGCCAGTGTAAAGATGT | CTCCCAGGTCTAAGGAGAGAAA |
| TFAM | ATCCCCTCGTCTATCAGTCTTGTCT | TTCTGCTTCTGGTAGCTCCCTC |
| Citrate synthase | GGACAATTTTCCAACCAATCTGC | AGTCAATGGCTCCGATACTGC |
| ATP6 | AGGATTCCCAATCGTTGTAGCC | CCTTTTGGTGTGTGGATTAGCA |
| UCP2 | CACGCAGCCTCTACAATG | TCAGCACAGTTGACAATGG |
| OGDH | GTTTCTTCAAACGTGGGGTTCT | GCATGATTCCAGGGGTCTCAAA |
| Kir6.2 | TGGGTGGTAACGGCATCTTC | GGTGCAGGTCACTAGGAGC |
| Sur | CAAGGTGTCCTCAACAACGG | CCAGGTGCTATGGTGAATGTG |
| ND2 | CACGATCAACTGAAGCAGCAA | ACGATGGCCAGGAGGATAATT |
| β2M | TGTCAGATATGTCCTTCAGCAAGG | TGCTTAACTCTGCAGGCGTATG |
| Bax | CCAGGATGCGTCCACCAAGA | GCAAAGTAGAAGAGGGCAACCAC |
| Caspase 3 | CTGGAGAAATTCAAAGGACGGG | TGAGCATGGACACAATACACGG |
| Bcl-2 | TCTTTGAGTTCGGTGGGGTCAT | AGACAGCCAGGAGAAATCAAACAGA |
| β-Actin | TGTCACCAACTGGGACGATA | GGGGTGTTGAAGGTCTCAAA |
2.9. Statistical analysis
All measurement values were expressed as mean ± S.E.M. Significant differences between groups were determined by one-way analysis of variance using SPSS 20.0 software (SPSS Inc. Chicago IL., U.S.A.) for Windows. A difference was considered significant at the p < 0.05 level.3. Results
3.1. 24 week dietary OTP experiment in SD rats
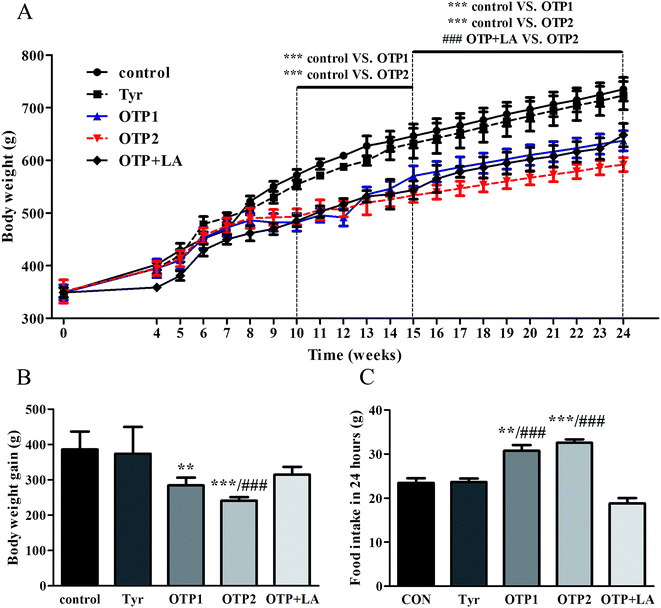
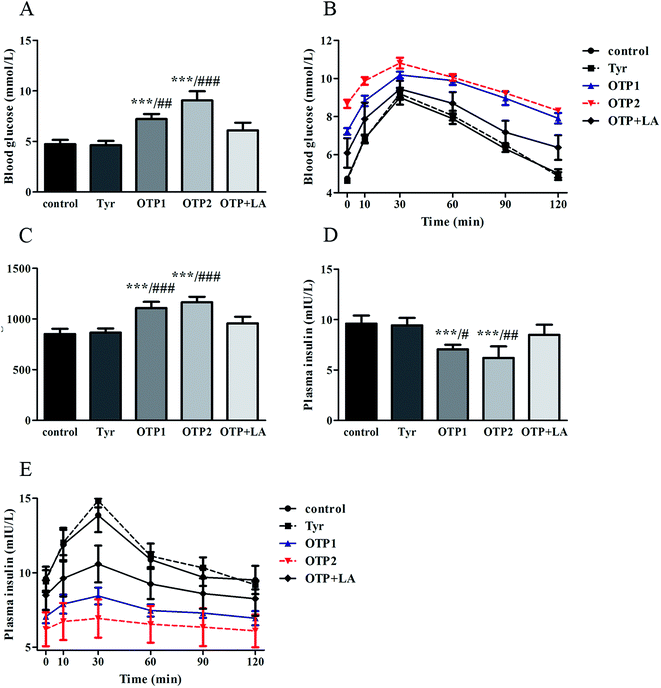
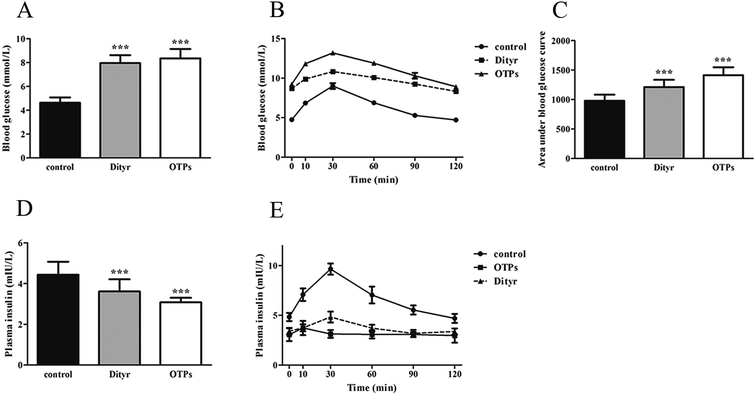
Dramatic changes in body weight and increased food intake are major risk factors for diabetes. The results of the glucose tolerance test are shown in Fig. 2. Blood glucose levels under fasting conditions (0 min) were higher in the OTPs-fed rats, compared to the control rats. Quantitatively, the area under the glucose curve was significantly increased in the OTPs-fed rats, as compared to that in the control rats. The plasma insulin level under fasting conditions (0 min) was decreased in the rats in the OTP groups. Thirty minutes after glucose administration, plasma insulin levels increased to the maximum value and decreased rapidly in the control rats. However, there was no time-dependent change in insulin content in the OTPs-fed rats.
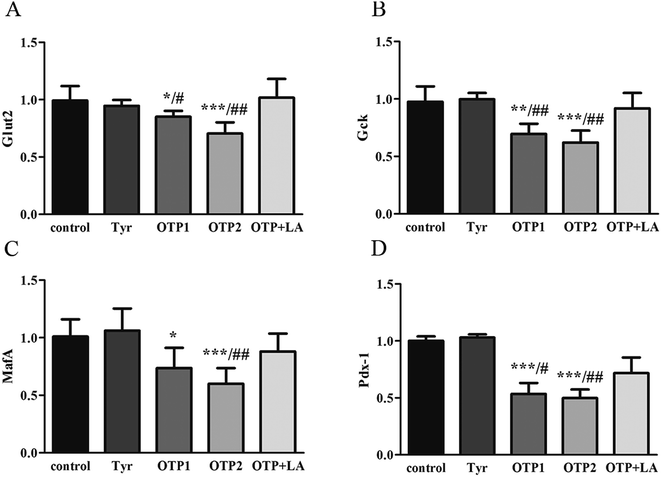
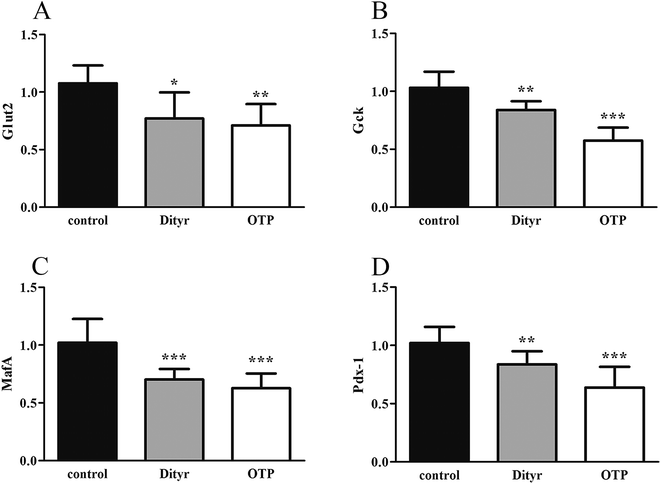
Fig. 3 shows the expression of genes (Glut2 and Gck) and transcription factors (Pdx-1 and MafA) involved in insulin biosynthesis in the pancreas were significantly lower in OTPs-treated rats when compared with rats in control group. LA mitigated the effect of OTPs on blood glucose and insulin synthesis. These data point to impaired glucose tolerance and reduced insulin secretion in the OTPs-fed rats.
3.2. 10 week gavage experiment with OTPs and Dityr in C57BL/6 mice
3.3. Dityr exposure experiment using mice MIN-6 cells
4. Discussion
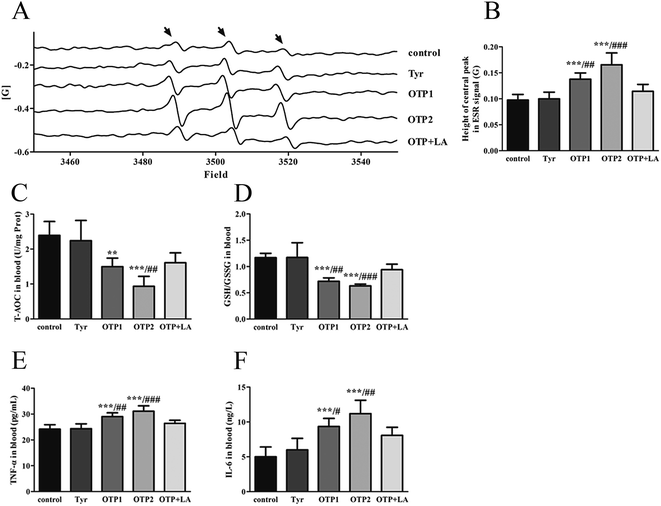
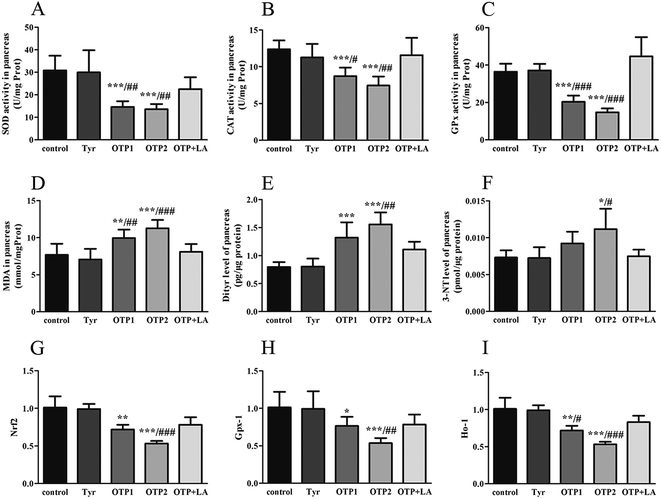
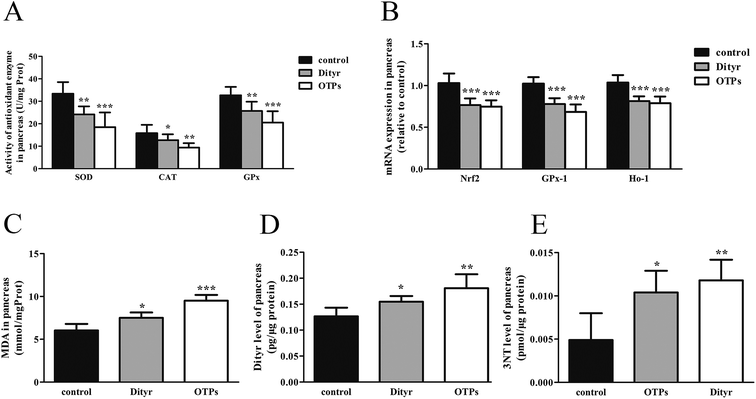
Tyrosine residues are susceptible to oxidation and nitration. The structures of oxidized tyrosine products (OTPs) are stable and not easily subjected to enzymatic hydrolysis; therefore, OTPs are widely detected in food systems, including meat and dairy products.30,31 We previously demonstrated that a diet high in OTPs resulted in oxidative injury and inflammation,32 which may be briefly associated with many metabolic disorders such as liver and renal fibrosis changes. The pancreas is particularly susceptible to oxidative stress, due to the weak activities of antioxidant enzymes,33 and it plays an important role in glucose metabolism; therefore, the pancreas may be attacked by the oxidative stress induced by OTPs. However, the impact of dietary OTPs on the pancreas is not clear.The elevated fasting blood glucose and impaired glucose tolerance found in this study suggest that OTPs consumption would lead to dysfunction of the pancreatic islets. The OTPs treatment apparently resulted in down-regulation of mRNA expressions of genes in the GSIS pathway (Glut2 and Gck), as well as down-regulation of transcription factors that bind to promoters of insulin genes (Pdx-1 and MafA). These findings confirmed that the consumption of OTPs impaired the GSIS pathway via the regulation of glucose uptake and glycolysis. Past research on the redox imbalance in diabetes reported that exposure of β cells to ROS suppressed insulin gene promoter activity and mRNA expression.34 In addition, ROS markedly reduced the binding of β cells-specific transcription factors (Pdx-1 and MafA) to the insulin gene promoter.35 In the present study, with increasing doses of OTPs, the generation of ROS and inhibition of antioxidant enzymes (SOD, CAT, and GPx) increased in rats, reflecting severe oxidative stress. It has been reported that glutathione plays an important protective role in combating the oxidative damage of biological molecules, and the ratio of GSH to GSSG often changes in the presence of oxidative stress.36 In the current study, we measured the levels of GSH and GSSG, and the results revealed a decline in the GSH level and a rise in the GSSG level. The GSH/GSSG ratio in the OTPs-fed rats decreased when compared to the controls. Excessive ROS generation plays a key role in chronic inflammation, ultimately resulting in increased levels of inflammatory cytokines, such as TNF-α, IL-6.37 Many previous studies revealed the co-effects of oxidative stress and chronic inflammation on the bio-function of the pancreas.38,39 In the present study, the co-effects of oxidative stress and increased expression of inflammatory cytokines could have led to the dysfunction of the pancreatic islets.
Oxidative damage is a complex pathophysiological process, which is implicated in a series of cellular and molecular events and signaling pathways. Among these, the Nrf2/ARE pathway has been identified as a potentially important pathogenesis mechanism in diabetes mellitus.40 The antioxidant response element (ARE) is located in the promoter region of some genes encoding antioxidant enzymes, including Gpx, glutathione S-transferases (Gst), heme oxygenase-1 (Ho-1), and γ-glutamylcysteine synthetase.41 Under normal conditions, Nrf2 binds to the Kelch-like ECH-associated protein-1 (Keap1) in the cytoplasm, in association with the actin cytoskeleton. In the presence of stress induced by electrophilic groups, Nrf2 dissociates from Keap1 and translocates to the nucleus. It then binds to ARE sequences, resulting in the transcriptional activation of antioxidant and phase II detoxifying genes.42 Nrf2 is activated under conditions of mild oxidative stress and inhibited under conditions of severe oxidative stress.43 In this study, the down-regulation of Nrf2 expression might have contributed to excessive ROS generation. The findings of the down-regulated Nrf2, Gpx1, and Ho-1 expression suggest that the OTP treatment induced oxidative stress in the pancreas through inhibition of the Nrf2/ARE pathway. In the present study, L-tyrosine was used as a source to prepare OTPs. As the OTPs contained some tyrosine residues, a tyrosine-only group was used as a negative control. The rats in the tyrosine-treated group exhibited no oxidative stress or abnormal glucose metabolism, as compared to the control group. All these findings confirmed that the oxidative damage that occurred after the 24 week OTP treatment was specifically induced by the treatment.
Many antioxidants, such as lipoic acid (LA), have been reported to prevent or at least attenuate the damage caused by oxidative stress.44 Numerous studies have demonstrated the therapeutic potential of LA in diabetes, reporting that LA provided protection against oxidative damage and reduced the levels of inflammatory cytokines.45–47 In this study, the rats fed the OTP diet supplemented with LA had normal blood glucose and insulin levels. LA significantly inhibited OTP-induced oxidative damage via down-regulation of oxidative stress and up-regulation of the activities of antioxidant enzymes. In addition, LA significantly increased the expression of Nrf2, Gpx-1 and Ho-1 in the pancreas of OTPs-treated rats. These findings strengthen our hypothesis that a diet rich in OTPs would affect insulin secretion in rats, associated with impaired antioxidant capacity. We also suggest that antioxidant supplements may be a feasible therapeutic response to oxidative stress induced by protein oxidation.
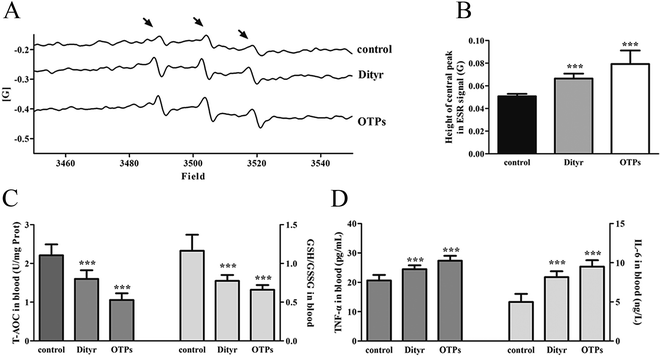
Dityr is the main component of OTPs, which is a very unusual molecule, linked not by peptide bonds but by covalent bonds. These bonds are resistant to proteolytic degradation and acid hydrolysis.48 Therefore, we assumed that Dityr might be responsible for OTPs-induced injury and we further performed a 10 week gavage to study the effect of Dityr. The gavage study showed that OTPs and pure Dityr led to similar oxidative injuries in islets. Furthermore, the oxidative injury in the OTPs/Dityr treated mice was consistent with that observed in the OTPs-fed rats. These results indicate that the administration of dietary OTPs induces oxidative stress and inflammation in the pancreas, thereby potentially promoting dysfunction of insulin synthesis in islets. The present study proved that Dityr, the main component of the OTPs mixture, has an important role in OTPs-induced oxidative stress.
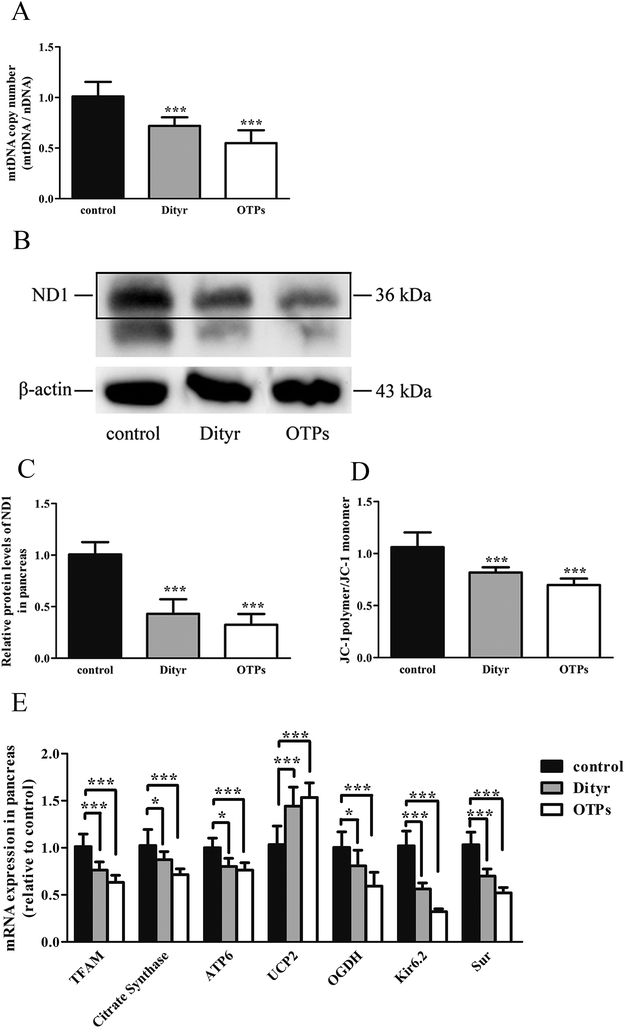
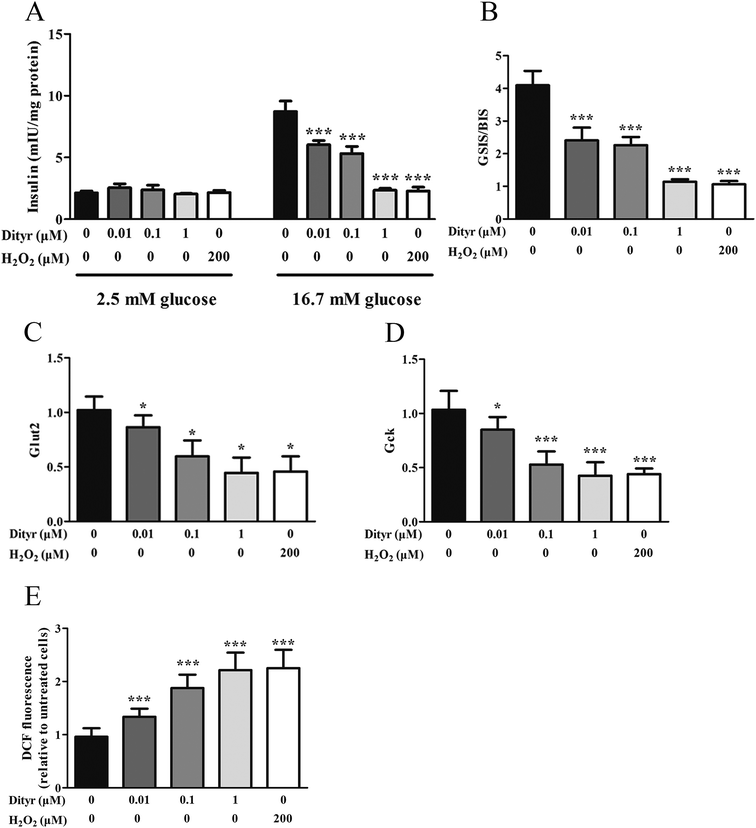
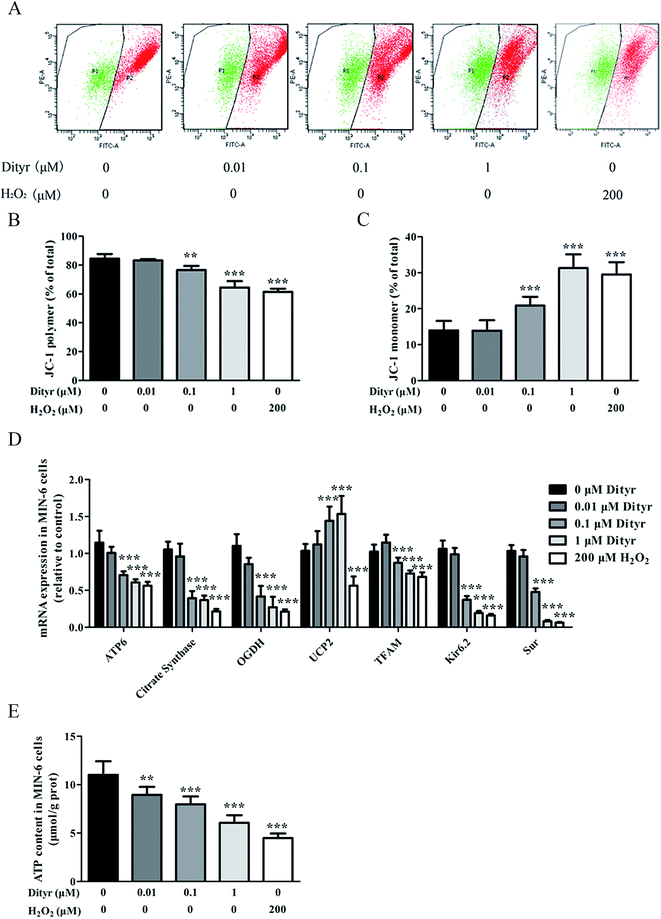
The mitochondrion plays an important role in energy metabolism.49 It is well established that the mitochondrial oxidative phosphorylation system generates free radicals and that the electron transport chain is vulnerable to ROS, with excessive generation of ROS leading to mitochondrial dysfunction.50 Mitochondrial defects in β cells disturb glucose-stimulated insulin synthesis (GSIS).19,25 In pancreatic β cells, glucose transporter 2 (Glut2), which is phosphorylated by glucokinase (Gck), is involved in glucose transportation and glycolysis. In mitochondria, pyruvate enters into the tricarboxylic acid (TCA) cycle and activates ATP generation, which induces the closure of ATP-sensitive K (KATP) channels and the depolarization of the plasma membrane, resulting in insulin release.51,52 Impaired GSIS can be induced by reduced glucose sensibility, disrupted mitochondrial metabolism and function, or a combination of both. As expected, in the present study, exposure to Dityr altered the mRNA level of Glut2 and Gck, both in MIN-6 cells and the mice pancreas. These results suggest that Dityr could impair the GSIS pathway by regulating the rate of glucose uptake and glycolysis. In addition, Dityr decreased the expression of the KATP channel subunits Kir6.2 and Sur, which might account for the inhibition of insulin secretion in both Dityr-treated mice and cells.51 This effect was accompanied by significant down-regulation of the mRNA level of subunit 6 of mitochondrial ATP synthase (ATP6). These findings indicate that Dityr-induced mitochondrial damage may play an important role in the onset of β cell dysfunction.
In the present study, the OTPs and Dityr treatments had adverse effects on several key events involved in the regulation of mitochondrial function and metabolism in the mice pancreas and MIN-6 cells. For example, the OTPs and Dityr altered the mRNA levels of genes that were central to mitochondrial function and metabolism. Citrate synthase is a rate-limiting enzyme in the TCA cycle, OGDH encodes rate-limiting enzymes in the mitochondrial TCA cycle, and UCP2 negatively regulates the sensitivity of insulin secretion to glucose stimulation and mitochondrial ATP production in β cells.53 The down-regulation of ATP6, citrate synthase, and OGDH, in addition to the up-regulation of UCP2, likely contributes to Dityr-induced defects in ATP generation and impaired GSIS. The mitochondrial transcription factor TFAM plays a role in mitochondrial biogenesis and respiration in response to environmental stimuli. As expected, in the present study, the TFAM mRNA level was reduced in the OTP/Dityr-treated mice and Dityr-exposed cells. Previous research showed that the expression of TFAM was specifically associated with the mtDNA copy number.54
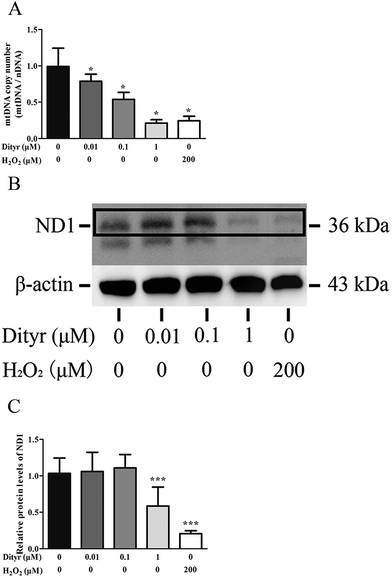
mtDNA depletion, which plays a major role in mitochondrial diseases, is another potential cause of mitochondrial dysfunction.55 mtDNA is prone to oxidative damage. In addition to mitochondrial dysfunction, previous research showed that an abnormal mtDNA copy number was associated with increased oxidative stress.56,57 Genetically altered mice lacking expression of the mitochondrial genome in β cells exhibited symptoms of diabetes and an impaired GSIS pathway in pancreatic islets.58 In the present study, the results of the western blot and mtDNA copy number assay showed that the OTP and Dityr treatments depleted mtDNA in the mice pancreas and MIN-6 cells. Increased ROS production is associated with mtDNA damage.21 In the current study, Dityr induced excessive ROS generation both in Dityr-treated mice and MIN-6 cells. Since H2O2 exposure also led to increased ROS levels and decreased mtDNA copy numbers in MIN-6 cells, it suggested that Dityr-induced oxidative stress would be responsible for the mtDNA depletion.
A deficiency in mitochondrial membrane integrity may be another confounding factor of mitochondrial dysfunction.59,60 The membrane potential is a marker of the integrity of the mitochondrial membrane. Many studies have revealed the relationship between the membrane potential and ATP production.61,62 In the present study, mitochondrial membrane depolarization was observed in the Dityr-exposed MIN-6 cells and in the pancreas of the OTPs/Dityr-treated mice. These results suggested that Dityr destroyed the structural integrity of the mitochondrion. The results also demonstrated that the OTPs and Dityr treatments had a negative effect on mitochondrial function.
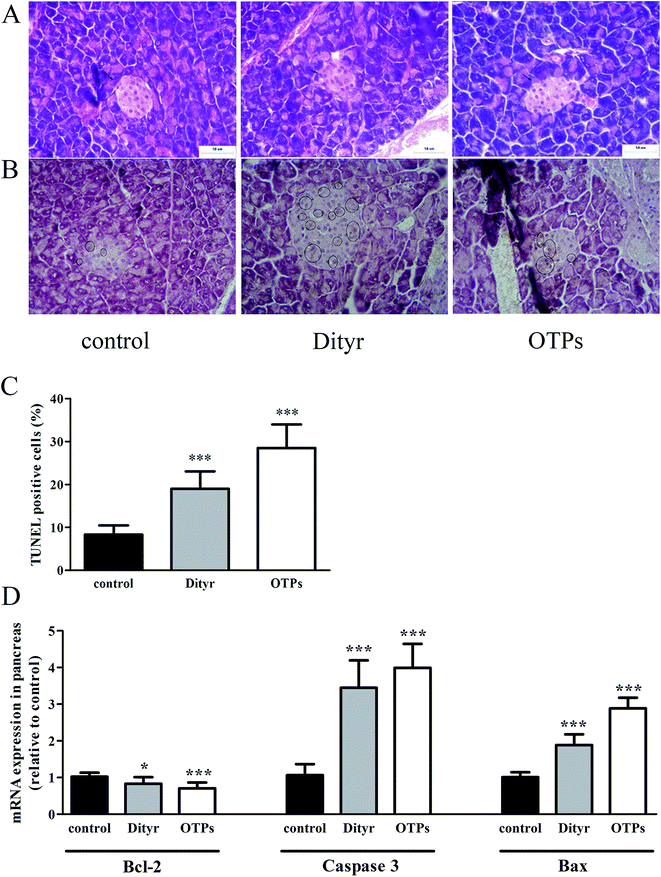
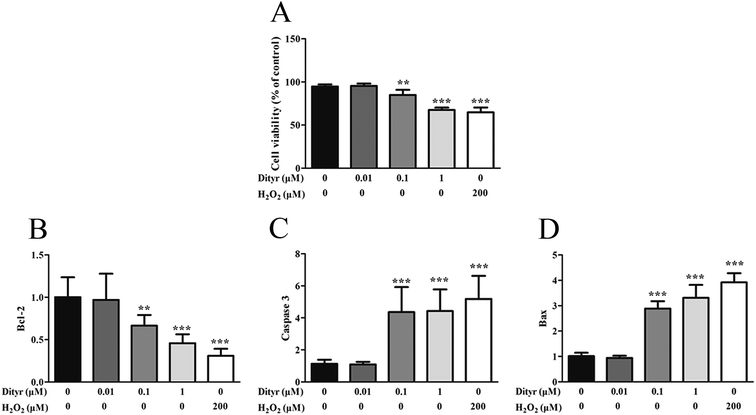
One potential result of oxidative stress-induced mitochondrial dysfunction is cell apoptosis. The apoptosis of pancreatic β cells is a critical component in the pathogenesis of diabetes mellitus.63,64 In the present study, both OTPs and Dityr induced cell death via activation of the mitochondrial apoptotic pathway, including the Bcl-2 and caspase families. Bcl-2 is an anti-apoptotic factor, which plays an essential role in maintaining the integrity of the mitochondrial outer membrane.65 Previous research reported that Bcl-2 was a central regulator of the mitochondrial-dependent apoptotic pathway.66 Bax is a pro-apoptotic protein, which has been shown to induce mitochondrial membrane depolarization and promote the release of apoptogenic factors from mitochondria, leading to cell death.66 The caspase family plays a critical role in the release of apoptotic signal.67 The findings of the present study demonstrate that OTPs and Dityr induced down-regulation of the Bcl-2 mRNA level, as well as up-regulation of Bax, causing altered mitochondrial membrane permeability and subsequent up-regulation of Caspase 3. All the findings indicate that the mitochondrial-mediated apoptotic signalling pathway, triggered by OTPs, is involved in the apoptotic process and that Dityr may be responsible for the injury induced by OTPs.
In conclusion, the results of the present study suggest that OTP induced oxidative injury in the pancreas potentially results in the disruption of glucose metabolism. Dityr, as the main oxidized product in OTPs, is responsible for OTPs-induced pancreatic injury. Therefore, we suggest that oxidative stress-induced mitochondrial dysfunction and mitochondrial-related apoptotic signals play an essential role in the OTPs/Dityr-induced functional insufficiency of pancreatic β cells.
Conflict of interest
The authors declare that there are no conflicts of interest.Acknowledgements
This work was supported by the Chinese Nature Science Foundation (31571841), Natural Science Foundation of Jiangsu Providence, China (BK20140147).References
- M. J. Davies, Biochim. Biophys. Acta, 2005, 1703, 93–109 CrossRef CAS PubMed.
- M. Estevez, Poult. Sci., 2015, 94, 1368–1378 CrossRef CAS PubMed.
- C. Hellmuth, F. F. Kirchberg, N. Lass, U. Harder, W. Peissner, B. Koletzko and T. Reinehr, J. Diabetes Res., 2016, 2016, 2108909 Search PubMed.
- B. Lu, P. Gu, Y. Xu, X. Ye, Y. Wang, H. Du and J. Shao, Minerva Endocrinol., 2016, 41, 1–9 Search PubMed.
- M. A. Malik, S. N. Basahel, A. Y. Obaid and Z. Khan, Colloids Surf., B, 2010, 76, 346–353 CrossRef CAS PubMed.
- Y. Fukuchi, Y. Miura, Y. Nabeno, Y. Kato, T. Osawa and M. Naito, J. Atheroscler. Thromb., 2008, 15, 185–192 CrossRef CAS PubMed.
- D. A. Malencik and S. R. Anderson, Amino Acids, 2003, 25, 233–247 CrossRef CAS PubMed.
- A. Tonelli, M. G. D'Angelo, R. Salati, L. Villa, C. Germinasi, T. Frattini, G. Meola, A. C. Turconi, N. Bresolin and M. T. Bassi, J. Neurol. Sci., 2006, 241, 13–17 CrossRef CAS PubMed.
- M. Abdolvahab, K. Behnaz, B. Sima and M. Teimoorian, J. Global Infect. Dis., 2010, 2, 198–199 CrossRef PubMed.
- D. A. Butterfield, M. Perluigi and R. Sultana, Eur. J. Pharmacol., 2006, 545, 39–50 CrossRef CAS PubMed.
- C. F. Lin, A. Asghar, J. I. Gray, D. J. Buckley, A. M. Booren, R. L. Crackel and C. J. Flegal, Br. Poult. Sci., 1989, 30, 855–864 CrossRef CAS PubMed.
- A. Beyerlein and R. von Kries, Am. J. Clin. Nutr., 2011, 94, 1772S–1775S CrossRef CAS PubMed.
- M. M. El-Shafei, N. S. Al-Amoudy and A. K. Said, Die Nahrung, 1988, 32, 559–564 CrossRef CAS PubMed.
- Z. L. Li, L. Mo, G. Le and Y. Shi, Food Chem. Toxicol., 2014, 64, 86–93 CrossRef CAS PubMed.
- L. Zhuqing Leslie, Y. Shi, G. Le, Y. Ding and Q. Zhao, Oxid. Med. Cell. Longevity, 2016, 1, 1–12 Search PubMed.
- Y. Ran, B. Yan, Z. Li, Y. Ding, Y. Shi and G. Le, Physiol. Behav., 2016, 164, 292–299 CrossRef CAS PubMed.
- X. G. Lei and M. Z. Vatamaniuk, Antioxid. Redox Signaling, 2011, 14, 489–503 CrossRef CAS PubMed.
- V. Ramakrishna and R. Jailkhani, Acta Diabetol., 2008, 45, 41–46 CrossRef CAS PubMed.
- B. B. Lowell and G. I. Shulman, Science, 2005, 307, 384–387 CrossRef CAS PubMed.
- J. Szendroedi, E. Phielix and M. Roden, Nat. Rev. Endocrinol., 2012, 8, 92–103 CrossRef CAS PubMed.
- P. Maechler and P. B. de Andrade, Biochem. Soc. Trans., 2006, 34, 824–827 CrossRef CAS PubMed.
- E. K. Fetisova, A. V. Avetisyan, D. S. Izyumov, M. V. Korotetskaya, B. V. Chernyak and V. P. Skulachev, FEBS Lett., 2010, 584, 562–566 CrossRef CAS PubMed.
- P. F. Wu, L. H. Long, J. H. Zeng, X. L. Guan, J. Zhou, Y. Jin, L. Ni, F. Wang, J. G. Chen and N. Xie, Food Chem. Toxicol., 2012, 50, 2729–2735 CrossRef CAS PubMed.
- R. Haenold, R. Wassef, N. Brot, S. Neugebauer, E. Leipold, S. H. Heinemann and T. Hoshi, Free Radical Res., 2008, 42, 978–988 CrossRef CAS PubMed.
- P. Maechler and C. B. Wollheim, Nature, 2001, 414, 807–812 CrossRef CAS PubMed.
- Z. L. Li, Y. Shi, Y. Ding, Y. Ran and G. Le, Amino Acids, 2016, 1–20 Search PubMed.
- T. Kurahashi, A. Miyazaki, S. Suwan and M. Isobe, J. Am. Chem. Soc., 2001, 123, 9268–9278 CrossRef CAS PubMed.
- O. H. Lowry, N. J. Rosebrough, A. L. Farr and R. J. Randall, J. Biol. Chem., 1951, 193, 265–275 CAS.
- V. Venegas, J. Wang, D. Dimmock and L. J. Wong, et al., Current protocols in human genetics/editorial board, L. Jonathan Haines, 2011, Ch. 19, Unit 19 17 Search PubMed.
- T. K. Dalsgaard, J. H. Nielsen, B. E. Brown, N. Stadler and M. J. Davies, J. Agric. Food Chem., 2011, 59, 7939–7947 CrossRef CAS PubMed.
- E. R. Stadtman, Annu. Rev. Biochem., 1993, 62, 797–821 CrossRef CAS PubMed.
- Z. L. Li, Y. Shi, G. Le, Y. Ding and Q. Zhao, Oxid. Med. Cell. Longevity, 2016, 2016, 3123294 Search PubMed.
- M. Tiedge, S. Lortz, J. Drinkgern and S. Lenzen, Diabetes, 1997, 46, 1733–1742 CrossRef CAS PubMed.
- V. Poitout and R. P. Robertson, Endocr. Rev., 2008, 29, 351–366 CrossRef CAS PubMed.
- N. Bashan, J. Kovsan, I. Kachko, H. Ovadia and A. Rudich, Physiol. Rev., 2009, 89, 27–71 CrossRef CAS PubMed.
- D. P. Jones, Methods Enzymol., 2002, 348, 93–112 CAS.
- S. Kwan Tat, M. Padrines, S. Theoleyre, D. Heymann and Y. Fortun, Cytokine Growth Factor Rev., 2004, 15, 49–60 CrossRef PubMed.
- S. M. Fathy and E. A. Drees, BMC Complementary Altern. Med., 2016, 16, 8 CrossRef PubMed.
- W. Yin, B. Li, X. Li, F. Yu, Q. Cai, Z. Zhang, M. Cheng and H. Gao, Food Funct., 2015, 6, 3065–3071 CAS.
- D. V. Chartoumpekis and T. W. Kensler, Curr. Diabetes Rev., 2013, 9, 137–145 Search PubMed.
- H. Motohashi and M. Yamamoto, Trends Mol. Med., 2004, 10, 549–557 CrossRef CAS PubMed.
- G. E. Mann, J. Niehueser-Saran, A. Watson, L. Gao, T. Ishii, P. de Winter and R. C. Siow, Acta Physiol. Sin., 2007, 59, 117–127 CAS.
- J. Ryu, R. Zhang, B. H. Hong, E. J. Yang, K. A. Kang, M. Choi, K. C. Kim, S. J. Noh, H. S. Kim, N. H. Lee, J. W. Hyun and H. S. Kim, PLoS One, 2013, 8, e71178 CAS.
- B. C. Scott, O. I. Aruoma, P. J. Evans, C. O'Neill, A. Van der Vliet, C. E. Cross, H. Tritschler and B. Halliwell, Free Radical Res., 1994, 20, 119–133 CrossRef CAS PubMed.
- L. Rochette, S. Ghibu, A. Muresan and C. Vergely, Can. J. Physiol. Pharmacol., 2015, 93, 1021–1027 CrossRef CAS PubMed.
- R. M. Ogborne, S. A. Rushworth and M. A. O'Connell, Arterioscler., Thromb., Vasc. Biol., 2005, 25, 2100–2105 CrossRef CAS PubMed.
- J. H. Choi, S. O. Cho and H. Kim, Yonsei Med. J., 2016, 57, 260–264 CrossRef CAS PubMed.
- B. Lipinski, Oncology, 2001, 60, 373 CrossRef CAS PubMed.
- P. F. Chinnery and E. A. Schon, J. Neurol., Neurosurg. Psychiatry, 2003, 74, 1188–1199 CrossRef CAS.
- A. Navarro and A. Boveris, Am. J. Physiol., 2007, 292, C670–C686 CrossRef CAS PubMed.
- J. C. Henquin, Diabetologia, 2009, 52, 739–751 CrossRef CAS PubMed.
- P. Rorsman and E. Renstrom, Diabetologia, 2003, 46, 1029–1045 CrossRef CAS PubMed.
- C. B. Chan, D. De Leo, J. W. Joseph, T. S. McQuaid, X. F. Ha, F. Xu, R. G. Tsushima, P. S. Pennefather, A. M. Salapatek and M. B. Wheeler, Diabetes, 2001, 50, 1302–1310 CrossRef CAS PubMed.
- M. I. Ekstrand, M. Falkenberg, A. Rantanen, C. B. Park, M. Gaspari, K. Hultenby, P. Rustin, C. M. Gustafsson and N. G. Larsson, Hum. Mol. Genet., 2004, 13, 935–944 CrossRef CAS PubMed.
- L. J. Wong, R. K. Naviaux, N. Brunetti-Pierri, Q. Zhang, E. S. Schmitt, C. Truong, M. Milone, B. H. Cohen, B. Wical, J. Ganesh, A. A. Basinger, B. K. Burton, K. Swoboda, D. L. Gilbert, A. Vanderver, R. P. Saneto, B. Maranda, G. Arnold, J. E. Abdenur, P. J. Waters and W. C. Copeland, Hum. Mutat., 2008, 29, E150–E172 CrossRef PubMed.
- S. Yamada, S. Nomoto, T. Fujii, T. Kaneko, S. Takeda, S. Inoue, N. Kanazumi and A. Nakao, Eur. J. Surg. Oncol., 2006, 32, 303–307 CrossRef CAS PubMed.
- A. N. Malik and A. Czajka, Mitochondrion, 2013, 13, 481–492 CrossRef CAS PubMed.
- J. P. Silva, M. Kohler, C. Graff, A. Oldfors, M. A. Magnuson, P. O. Berggren and N. G. Larsson, Nat. Genet., 2000, 26, 336–340 CrossRef CAS PubMed.
- A. Jelinek and H. P. Klocking, Exp. Toxicol. Pathol., 1998, 50, 472–476 CrossRef CAS PubMed.
- M. Darshi, V. L. Mendiola, M. R. Mackey, A. N. Murphy, A. Koller, G. A. Perkins, M. H. Ellisman and S. S. Taylor, J. Biol. Chem., 2011, 286, 2918–2932 CrossRef CAS PubMed.
- A. Vojtiskova, P. Jesina, M. Kalous, V. Kaplanova, J. Houstek, M. Tesarova, D. Fornuskova, J. Zeman, A. Dubot and C. Godinot, Toxicol. Mech. Methods, 2004, 14, 7–11 CrossRef CAS PubMed.
- F. Distelmaier, H. J. Visch, J. A. Smeitink, E. Mayatepek, W. J. Koopman and P. H. Willems, J. Mol. Med., 2009, 87, 515–522 CrossRef CAS PubMed.
- B. Faideau, E. Larger, F. Lepault, J. C. Carel and C. Boitard, Diabetes, 2005, 54(Suppl 2), S87–S96 CrossRef CAS PubMed.
- C. M. Filippi and M. G. von Herrath, Diabetes, 2008, 57, 2863–2871 CrossRef CAS PubMed.
- G. Kroemer and J. C. Reed, Nat. Med., 2000, 6, 513–519 CrossRef CAS PubMed.
- R. J. Youle and A. Strasser, Nat. Rev. Mol. Cell Biol., 2008, 9, 47–59 CrossRef CAS PubMed.
- W. C. Earnshaw, L. M. Martins and S. H. Kaufmann, Annu. Rev. Biochem., 1999, 68, 383–424 CrossRef CAS PubMed.
| This journal is © The Royal Society of Chemistry 2017 |

