 Open Access Article
Electrosorption of Pb(II) in water using graphene oxide-bearing nickel foam as the electrodes
Jun Zhengab,
Ling Xia*bc and
Shaoxian Song *ac
*ac
aSchool of Resources and Environmental Engineering, Wuhan University of Technology, Luoshi Road 122, Wuhan, Hubei 430070, China. E-mail: ssx851215@whut.edu.cn
bHubei Key Laboratory of Mineral Resources Processing and Environment, Luoshi Road 122, Wuhan, Hubei 430070, China. E-mail: xlyykx0502@163.com
cHubei Provincial Collaborative Innovation Center for High Efficient Utilization of Hubei, 430070, China
First published on 28th April 2017
Abstract
The electrosorption of Pb(II) from water with graphene oxide-bearing nickel foam (GO/NF) as the electrodes was studied in this work in order to develop a more effective method for Pb(II) removal. The GO/NF was synthesized via vacuum impregnation method. The characterization of the materials was performed through atomic force microscopy, adsorption capacity, zeta potential and X-ray photoelectron spectroscopy measurements. The experimental results have shown that a very large adsorption capacity (3690 mg g−1) and high adsorption rate were achieved for electrosorption. The adsorption fitted the Langmuir isotherm and was in good agreement with a pseudo-second-order kinetics model. The mechanism might be attributed to electrosorption and chemisorption, in which the oxygen containing functional groups of graphene oxide offered a large amount of lone pair electrons for complexation with Pb(II) ions and thus enhanced the hydrophilicity of GO/NF electrodes. It has been demonstrated that electrosorption with GO/NF as the electrode could be a very promising process for removing Pb(II) from water.
1. Introduction
With the increasing awareness of potential hazards for human health and the environment, heavy metal pollution has received more and more attention in recent years. Among various kinds of heavy metals, lead is one of the common contaminants existing in the waste streams of many industries, such as, battery manufacturing, acid metal plating, dying, glass printing industries and other associated manufacture.1,2 It is non-biodegradable and can be accumulated in living systems. Lead poisoning also causes various health hazards, such as damage to nervous, digestive, blood, endocrine and reproductive systems.3 Accordingly, the World Health Organization (WHO) standard limit for lead in potable water is less than 0.01 mg L−1.4Various methods have been developed to remove lead from water, including ion-exchange, evaporation and concentration, chemical precipitation, reverse osmosis, adsorption, electrodialysis and so on.5 Electrosorption is a novel water treatment technology and has recently received a great attention due to its superior advantages such as green processing, low energy consumption, high efficiency and easy solid–liquid separation.6 However, it is limited to the adsorption capacity for heavy metals when common activated carbons are used as the electrode.7,8 There is a great significance to use new materials as the electrodes in electrosorption process for eliminating lead from water.
Graphene oxide (GO), or functional grapheme is a two-dimension material (2D) with huge surface area and hydrophilic polar groups (–OH, –COOH, epoxy groups, etc.). The polar groups might chemically react with heavy metals, resulting in the chemical adsorption of Pb(II) on GO surfaces.9,10 Therefore, GO being electrodes might greatly improve the electrosorption of Pb(II). However, because of the low conductivity and hydrophilicity,11 GO is not satisfactory for direct use as the electrodes. On the other hand, nickel foam (NF), a kind of excellent three-dimension (3D) materials with good corrosion resistance, has been widely used in the field of battery electrode materials and catalyst materials.12 Accordingly, therefore, it could be a good strategy to coat GO on NF to prepare GO/NF electrodes for the electrosorption of Pb(II).
In this study, a vacuum impregnation method using negative pressure and capillary action for GO coating on NF was introduced instead of traditionally using binders to prepare a binder-free GO/NF electrode, which was environmental-friendly and avoided pore blocking. Afterwards, experiments of adsorption isotherms and kinetics were conducted to investigate the performances of Pb(II) removal by electrosorption using the prepared GO/NF electrodes. XPS analysis were further carried out for approaching into the mechanism of Pb(II) adsorbed onto the electrode.
2. Materials and methods
2.1. Materials
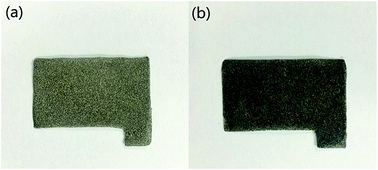
The natural amorphous graphite with a purity of 90% (Yongan, Fujian, China) was used as the raw materials to synthesize GO. Nickel foam (1.0 mm, 110 PPI, 350 g m−2, 0.2–0.5 mm, 97.2%; Fig. 1a) were purchased from Changde Lyrun Material Co Ltd. All chemical reagents including potassium permanganate (KMnO4), sodium hydroxide (NaOH), ammonia (NH4OH), sodium nitrate (NaNO3), 30% hydrogen peroxide aqueous solution (H2O2), plumbous nitrate (Pb(NO3)2), sulfuric acid (H2SO4), nitric acid (HNO3) and hydrochloric acid (HCl) were obtained from Xinyang chemical reagent Ltd (China) and of analytical grade. Ultrapure Milli-Q water was used throughout the experiments.2.2. Preparation of GO/NF electrode
GOs were prepared with a modified Hummers method.13 Firstly, amorphous graphite was oxidized by concentrated H2SO4 and KMnO4. Afterwards, H2O2 aqueous solution was added to the mixture to neutralize the residual KMnO4 until no bubble appeared, and then graphite oxide powder was obtained by freeze-dried. Next up, the graphite oxide powder was dispersed in deionized water and ultrasonically exfoliated by a Cole Parmer ultra-sonic processor (750 W and 20 kHz) with 50% amplitude for 10 min. Then, the colloidal suspension was centrifuged at 2520 × g for 20 min to get the supernatant solution, and the GO solution was prepared.For electrode preparation, NF was cut into sheets of the same size (20 mm × 40 mm) and pretreated by washing with acetone, followed hydrochloric acid and deionized water. The NF sheets were immersed in as-prepared GO solution (5 mg mL−1) under vacuum conditions for 2 h at 40 °C, and the composite was washed with copious amounts of deionized water. After drying at the vacuum oven for 4 h, the GO/NF electrodes were obtained (Fig. 1b). At last, the GO/NF electrodes were stored in a desiccator.
2.3. Electrosorption test
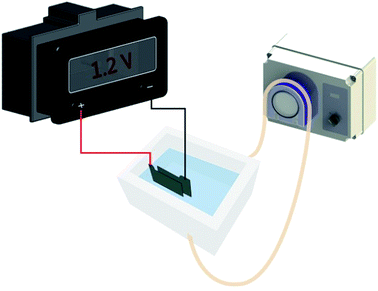
The electrosorption tests were performed with a system as shown in Fig. 2. The system consisted of an electric adsorption tank, a peristaltic pump and an external supply. The GO/NF electrodes were installed in the tank with 100 mL Pb(NO3)2 solution, and the distance between electrode sheets was set as 2 mm so that Pb(NO3)2 solution can flow properly. Various working parameters were pretested, and it was found that the optimum flow rate and electrical voltage were 28 mL min−1 and 1.2 V (less than hydrolysis voltage), respectively. Thus, the sorption conditions in this study were set as 28 mL min−1 of flow rate and 1.2 V of voltage.The influence of pH on electrosorption performances was conducted within a pH range from 2.0 to 6.0 at an initial Pb(II) concentration of 400 mg L−1 at 25 °C. The kinetics experiments were studied for a predetermined time intervals (5, 10, 15, 20, 25, 30, 40, 50, 60 min) with three different initial Pb(II) concentrations of 160, 400 and 1350 mg L−1 at pH 5.0 under 25 °C. The electrosorption isotherm experiments were obtained with a Pb(II) concentration range from 100 to 1800 mg L−1 at pH 5.0 under 25 °C. The concentration of the Pb(II) in the solution at a given time was measured by atomic absorption spectroscopy (Zeenit700, Analyjena, Germany). Adsorption capacity (%) was calculated as following eqn (1):
 | (1) |
2.4. Measurements
AFM images of GO were taken by using a Bruker MultiMode 8 AFM with peak force tapping-mode. The sample was obtained by dropping GO solution on the surface of a freshly cleaved mica, and the mica substrate with GO was dried in an automatic thermostatic blast air oven for 2 h at 50 °C.The specific surface area of GO was measured by a gas adsorption analyzer (F-sorb 3400, Gold Aipu Technology Co., Ltd.,China) with nitrogen as the adsorbate.
Zeta potential of GO was obtained by a Zeta Probe analyzer (Nano-ZS90, Malvern, UK). The pH value of the GO solution was monitored continuously at 25 °C, and the range of pH was set as 2.0–6.0, adjusting by dilute HNO3 or NH4OH aqueous solutions.
The surface elemental composition and the surface functional groups analyses of NG/GO before and after Pb(II) loaded were proposed based on the XPS spectra Q5 (PHI-3056, PerkinElmzr, Waltham, MA, US).
3. Results and discussion
3.1. Characterization of electrode
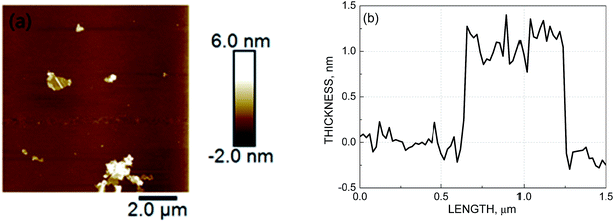
GO was firstly characterized by the AFM. As showed in Fig. 3, mica surface with deposition of the as-prepared GO and the cross-section analysis along with the line in AFM images of individual sheets were observed. The thickness of GO was less than 2 nm (approximately 1–2 layers). The result proved that GO was synthesized successfully. It was widely accepted that the smaller the thickness of GO, the larger the specific surface area and the more conductive to adsorption.14 Thus, the prepared GO in this study had enormous surface area (314.50 m2 g−1), which can contribute to the adsorption efficiency and capacity of heavy metals largely.For preparing the electrodes, GO was beared onto the NF, and the NF has turned from slivery to dark grey with dispersing GO (Fig. 1).
3.2. Adsorption of Pb(II) ions on GO/NF
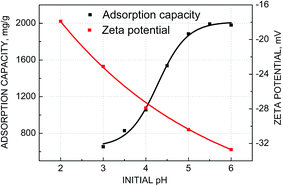
From Fig. 4, it could be seen that electrosorption capacity increased continuously with the decreasing acidity initially. It was noted that when pH was above 5, the adsorption capacity remained constant almostly, and further increase of pH did not exhibit any increase in adsorption capacity. Thus, pH 5.0 can be a good condition for electrosorption of Pb(II) ions. The inhibition of Pb(II) adsorption capacity at lower pH might be due to competitive adsorption between H+ ions and Pb(II) ions on the GO/NF electrode surface. While with the increase of pH, the competitive effection of H+ ions was weaken and Pb(II) ions occupied more adsorption sites of adsorbent, leading to increasing the adsorption capacity of Pb(II). In addition, the net negative zeta potential value increased with the increasing of pH, implied that the surface charge of GO was more negative at high pH, resulting in the adsorption of Pb(II) more easily. In summary, pH 5.0 was chosen as the experimental condition for the subsequent adsorption studies.
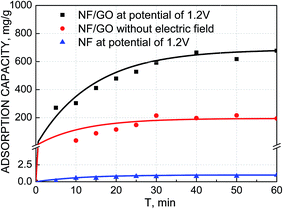 | ||
| Fig. 5 Adsorption performance using NF electrodes at a voltage of 1.2 V and GO/NF electrodes at a voltage of 1.2 V and 0 V at an initial Pb(II) concentration of 100 mg L−1 at 25 °C. | ||
GO had negative surface and owed many oxygenous functional groups, which favored Pb(II) adsorbed onto the GO/NF surface even without applying any electric field. As showed in Fig. 5, the adsorption capacity of Pb(II) on GO/NF was 193.5 mg g−1 at initial Pb(II) concentration of 100 mg L−1 in the open circuit. As expected, the adsorption capacity of GO/NF electrodes obviously enhanced by applying a voltage of 1.2 V with the equal initial concentration of 100 mg L−1 with a value of 663 mg g−1, which was over 3 times higher than that in the open circuit. It proves the significance of the external electric field, which drives more Pb(II) ions adsorbed onto the GO/NF.
 | (2) |
| qe = kFce−n | (3) |
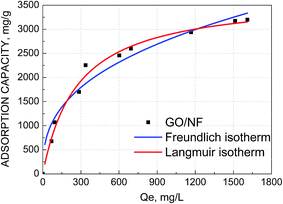 | ||
| Fig. 6 Adsorption isotherms of Pb(II) on GO/NF electrodes, the data were fitted with the Langmuir model and Freundlich model. | ||
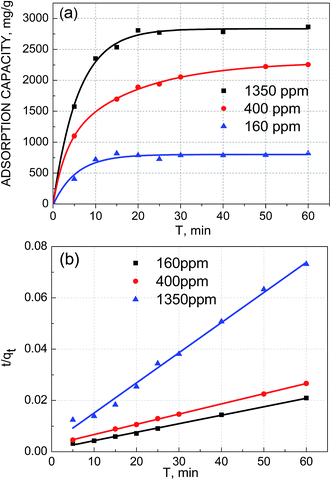 | ||
| Fig. 7 (a) Kinetics of Pb(II) removal by GO/NF. (b)The pseudo-second-order adsorption kinetics curves fitted with experimental data. | ||
As presented, the adsorption experimental data of Pb(II) fitted the Langmuir model better with the higher regression correlation (R2 = 0.9795) and the maximum adsorption capacity of Pb(II) on GO/NF was as high as 3690.37 mg g−1. In order to estimate the efficiency of the process using GO/NF electrodes for electrosorption of Pb(II), a comparison with other adsorbents applying in adsorption of Pb(II) was summarized in Table 1. The GO/NF showed extremely higher adsorption capacity than almost all other adsorbents. Therefore, the electrosorption process with GO/NF electrodes developed in present study has great potential for application in Pb(II) removal from aqueous solution.
| Absorbent | pH | Adsorption capacity (mg g−1) | References |
|---|---|---|---|
| Titanium dioxide/carbon nanotube | 6 | 137.0 | 15 |
| Azadirachta indica leaf powder | 4.5–5.5 | 300 | 16 |
| Magnetic activated carbon incorporated | 5.2 | 104.2 | 17 |
| Copper oxide nanostructures | 6.5 | 125 | 18 |
| Orange peel xanthate | 5 | 204.50 | 19 |
| Montmorillonite | 4.5 | 57.0 | 20 |
| Activated carbon prepared from polygonum orientale linn | 5 | 99.01 | 21 |
| Graphene oxide | 5 | 766.8 | 22 |
| GO/NF | 5 | 3663.4 | This study |
ln(qe − qt) = ln![[thin space (1/6-em)]](https://www.rsc.org/images/entities/char_2009.gif) qe − k1 × t qe − k1 × t
| (4) |
 | (5) |
| qt = c + knt0.5 | (6) |
The pseudo-second-order kinetics results of electrosorption were illustrated in Fig. 7b, and the electrosorption kinetics of Pb(II) on GO/NF could be better fitted by the pseudo-second-order model with the higher correlation coefficient (R2 = 0.9923, 0.9996, 0.9970, respectively) than the pseudo-first-order kinetic (R2 = 0.6534, 0.9085, 0.9894. Respectively) and intra-particle diffusion model (R2 = 0.6516, 0.8779, 0.7116, respectively) no matter at any initial concentration. What's more, the values of experimental adsorption capacity (qe,exp) of the three different initial Pb(II) concentrations (820, 2254.33, 2863.28 mg L−1) could match better with the theoretical adsorption capacity (qe,cal) values calculated from the pseudo-second-order moedel (854.70, 2513.71, 3026.96 mg L−1) than that calculated from the pseudo-first-order kinetic model (344.05, 2204.09, 2020.92 mg L−1). The adsorption kinetics results indicated that the electrosorption process of Pb(II) accompanied chemisorption likely.
Furthermore, the vast majority of adsorption regenerated by using acid, alkali and other chemicals, but electrosorption through opening circuit or reserving electrodes for future generation. In this study, the desorption experiment was carried out by means of opening circuit, showing that after one adsorption–desorption cycles, the adsorption efficiency of the electrode decreased by 11.3% (data not shown). It indicated that most of the Pb(II) ions was adsorbed on the surface by relatively weak electrostatic adsorption, and the rest might be held through strong chemisorptive or complexation type of binding. This provides a good theoretical basis for the recycling of electrodes.
3.3. Adsorption mechanism
To further confirm the mechanism of electrosorption of Pb(II), the GO/NF electrodes after adsorption were analyzed by XPS. Fig. 8a showed the main characteristic peaks were C 1s, Ni 2p3 and O 1s before Pb loaded, while after adsorption, a new Pb 4f peak appeared at 138.3 eV (Fig. 8b),23 suggesting that Pb was successfully adsorption on GO/NF. The binding energy at 142.4 eV and 137.5 eV can be assigned to Pb 4f5/2 and Pb 4f7/2, respectively. It was worth mentioning that the relative amounts (%) of the atoms, O and C, were obviously changed after adsorption as showed in Table 2. In particularly, the amount of C atom decreased from 60.26% to 36.70%, hence a detailed analysis of the changes was given below.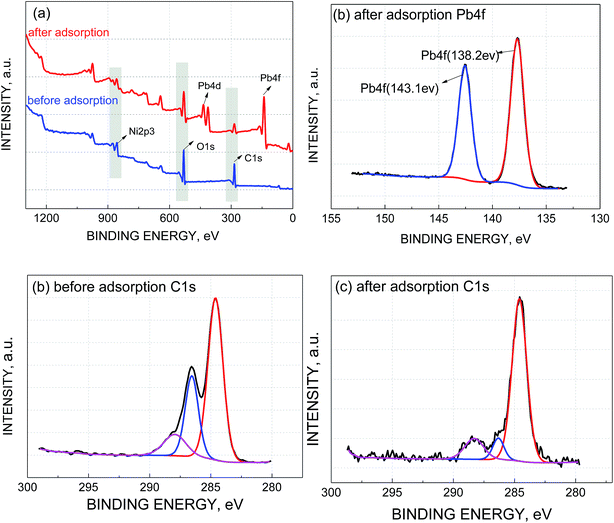 | ||
| Fig. 8 (a) XPS spectra of GO/NF before and after adsorption, (b) XPS spectra of the Pb 4f after adsorption, XPS spectra of the C 1s before (c) and after adsorption (d). | ||
| Sample | Atomic ratios (%) | ||||
|---|---|---|---|---|---|
| C 1s | O 1s | Ni | Pb | Others | |
| Before adsorption | 60.26 | 32.40 | 4.4 | 0 | 2.94 |
| After adsorption | 36.70 | 42.03 | 4.32 | 9.33 | 7.62 |
As shown in Fig. 8c, before adsorption, three peaks situated at 283.6, 285.5 and 287.0 eV are assigned to C–C/C![[double bond, length as m-dash]](https://www.rsc.org/images/entities/char_e001.gif) C in the aromatic rings, C–OH (hydroxyl) and O–C
C in the aromatic rings, C–OH (hydroxyl) and O–C![[double bond, length as m-dash]](https://www.rsc.org/images/entities/char_e001.gif) O (carboxyl) groups, respectively. After adsorption, it still included three peaks with binding energies of 283.9 eV (C–C), 285.72 (C–OH) and 287.9 eV (O–C
O (carboxyl) groups, respectively. After adsorption, it still included three peaks with binding energies of 283.9 eV (C–C), 285.72 (C–OH) and 287.9 eV (O–C![[double bond, length as m-dash]](https://www.rsc.org/images/entities/char_e001.gif) O)24 (Fig. 8d). However, the proportion of C–C/C
O)24 (Fig. 8d). However, the proportion of C–C/C![[double bond, length as m-dash]](https://www.rsc.org/images/entities/char_e001.gif) C, C–OH and O–C
C, C–OH and O–C![[double bond, length as m-dash]](https://www.rsc.org/images/entities/char_e001.gif) O changed after adsorption. As listed in Table 3, the peak associated with the C–OH bonds decreased, while the relative area ratio of C–OH reduced from 26.98% to 7.98%, however, the percentage of O–C
O changed after adsorption. As listed in Table 3, the peak associated with the C–OH bonds decreased, while the relative area ratio of C–OH reduced from 26.98% to 7.98%, however, the percentage of O–C![[double bond, length as m-dash]](https://www.rsc.org/images/entities/char_e001.gif) O increased from 11.92 to 13.05. This suggested that adsorption of Pb(II) onto GO/NF can be attributed to hydroxyl groups.25 Owing to the hydrogen bond of carboxyl group being more stable than that of hydroxyl group, Pb(II) ion reacted preferentially with hydroxyl group so that the relative area ratio of C–OH reduced more. In summary, the following reactions may occur during the adsorption of Pb(II):
O increased from 11.92 to 13.05. This suggested that adsorption of Pb(II) onto GO/NF can be attributed to hydroxyl groups.25 Owing to the hydrogen bond of carboxyl group being more stable than that of hydroxyl group, Pb(II) ion reacted preferentially with hydroxyl group so that the relative area ratio of C–OH reduced more. In summary, the following reactions may occur during the adsorption of Pb(II):
| –OH + Pb2+ → –OPb+ + H+ |
| –COOH + Pb2+ → –COOPb+ + H+ |
| –COOH + Pb2+ + –OH → –COOPbO– + 2H+ |
| –2OH + Pb2+ → –OPbO– + 2H+ |
| –2COOH + Pb2+ → –COOPbOOC– + 2H+ |
![[double bond, length as m-dash]](https://www.rsc.org/images/entities/char_e001.gif) C, C–OH and O–C
C, C–OH and O–C![[double bond, length as m-dash]](https://www.rsc.org/images/entities/char_e001.gif) O distribution from the C 1s peak of the GO/NF electrodes before and after adsorption
O distribution from the C 1s peak of the GO/NF electrodes before and after adsorption
| Sample | Peak | Binding energy (eV) | Percent (%) |
|---|---|---|---|
| Before adsorption | C–C/C![[double bond, length as m-dash]](https://www.rsc.org/images/entities/char_e001.gif) C C |
284.6 | 61.10 |
| C–O | 286.5 | 26.98 | |
O–C![[double bond, length as m-dash]](https://www.rsc.org/images/entities/char_e001.gif) O O |
287.9 | 11.92 | |
| After adsorption | C–C/C![[double bond, length as m-dash]](https://www.rsc.org/images/entities/char_e001.gif) C C |
284.6 | 78.97 |
| C–O | 286.32 | 7.98 | |
O–C![[double bond, length as m-dash]](https://www.rsc.org/images/entities/char_e001.gif) O O |
288.30 | 13.05 |
Based on the aforementioned analysis, the probable adsorption mechanisms during the reaction process may include: complexation adsorption and electrostatic attraction. The GO may cover evenly as mono or several layers onto the skeleton of NF so that increasing the effective specific area of the GO/NF electrode, which not only provided more adsorption sites, but also increased more space for double layer of electrosorption, leading to the higher adsorption capacity of Pb(II) during the process.
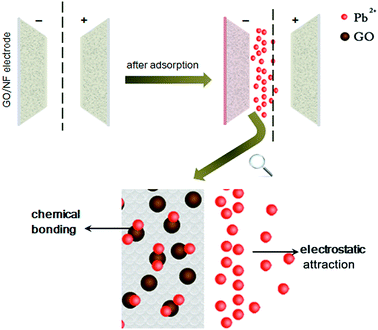
Fig. 9 shows the schematic diagram of the electrosoption of Pb(II) on GO/NF. When an direct current electricfied was applied to the GO/NF electrodes, the Pb(II) ions in the solution moved toward the negative electrode, and adsorpted on the cathode. Meanwhile, the increasing concentration of Pb(II) ions on the cathode surface led to the better performances of complexation reaction between Pb(II) and GO/NF. It should not be neglected that the significance of the functional groups (such as single bond COO–, single bond O–, etc.) on the surfaces of GO. On one hand, the groups provided a lot of lone pair electrons to Pb(II) ions for participating in Pb(II) binding. On the other hand, the groups enhanced the hydrophilicity of GO/NF electrodes which inhibited the gas diffusion on the electrode, then the contact area between electrode and solution increased,26 which further favored the electrosorption.
To further prove this conjecture that complexation reaction occurred in the electrosorption process, the adsorption equilibrium data was fitted with Dubinin–Radushkevich (D–R) adsorption equation. The mean free energy of the adsorption and the process mechanism onto a heterogeneous surface was determined:27
ln![[thin space (1/6-em)]](https://www.rsc.org/images/entities/char_2009.gif) qe = ln qe = ln![[thin space (1/6-em)]](https://www.rsc.org/images/entities/char_2009.gif) qm − kDR × R2 × T2 × ln(1 + 1/ce) qm − kDR × R2 × T2 × ln(1 + 1/ce)
| (7) |
 | (8) |
If E is less than 8 kJ mol−1, then physical sorption occurs, while between 8 and 16 kJ mol−1, chemisorptions occurs.29 Through the calculation by D–R equation, the value of E was 13.44 kJ mol−1 in this study, which proved that complexation reaction occurred in the electrosorption process assuredly.
4. Conclusions
(1) The GO/NF electrode was successfully prepared, and showed much higher efficiency of Pb(II) removal, in terms of higher maximum adsorption capacity of 3690 mg g−1 at pH 5.0. The adsorption capacity of GO/NF electrodes was over 3 times higher than that in the open circuit, and the adsorption was better fitted by pseudo-second-order kinetic model. The Langmuir isotherm model showed that the current research work provides further insight into the applications of GO/NF materials as electorsorption electrodes for removal of Pb(II).(2) The mechanism of the adsorption might be attributed to that Pb(II) ions firstly entered the electrical double layer of GO/NF through electrosorption, followed by the chemisorption of Pb(II) on the surfaces, leading to the great improvement of the adsorption capacity.
Acknowledgements
The financial supports to this work from the National Natural Science Foundation of China under the projects No. 51604207 and 61475454 and the China Postdoctoral Science Foundation (Grant No. 2015M580671; 2016T90738) were gratefully acknowledged.References
- A. Reşat, E. Tütem, M. Hügül and J. Hizal, Water Res., 1998, 32, 430–440 CrossRef.
- S. S. Ahluwalia and D. Goyal, Bioresour. Technol., 2007, 98, 2243–2257 CrossRef CAS PubMed.
- A. T. Paulino, L. B. Santos and J. Nozaki, React. Funct. Polym., 2008, 68, 634–642 CrossRef CAS.
- M. Ahmaruzzaman and V. K. Gupta, Ind. Eng. Chem. Res., 2011, 5013589–5013613 Search PubMed.
- A. R. Kul and H. Koyuncu, J. Hazard. Mater., 2010, 179, 332–339 CrossRef CAS PubMed.
- K. K. Park, J. B. Lee, P. Y. Park, S. W. Yoon, J. S. Moon and H. M. Eum, Desalination, 2007, 206, 86–91 CrossRef CAS.
- H. H. Jung, S. W. Hwang, S. H. Hyun, K. H. Lee and G. T. Kim, Desalination, 2007, 216, 377–385 CrossRef CAS.
- L. Zou, G. Morris and D. Qi, Desalination, 2008, 225, 329–340 CrossRef CAS.
- B. Yu, Z. H. Huang, X. L. Yu and F. Kang, Colloids Surf., A, 2014, 444, 153–158 CrossRef.
- G. Zhao, J. Li, X. Ren, C. Chen and X. Wang, Environ. Sci. Technol., 2011, 45, 10454–10462 CrossRef CAS PubMed.
- Y. Zou, X. Wang, Y. Ai, Y. Liu, J. Li, Y. Ji and X. Wang, Environ. Sci. Technol., 2015, 50, 7290–7304 CrossRef PubMed.
- W. S. Hummers and R. E. Offeman, J. Am. Chem. Soc., 1958, 80, 1339 CrossRef CAS.
- Y. Oren, Desalination, 2008, 228, 10–29 CrossRef CAS.
- A. Ban, A. Schafer and H. Wendt, J. Appl. Electrochem., 1998, 28, 227–236 CrossRef CAS.
- X. Zhao, Q. Jia, N. Song, W. Zhou and Y. Li, J. Chem. Eng. Data, 2010, 55, 4428–4433 CrossRef CAS.
- K. G. Bhattacharyya and A. Sharma, J. Hazard. Mater., 2004, 113, 97–109 CrossRef CAS PubMed.
- R. Fu, Y. Liu, Z. Lou, Z. Wang, S. A. Baig and X. Xu, J. Taiwan Inst. Chem. Eng., 2016, 62, 247–258 CrossRef CAS.
- A. A. Farghali, M. Bahgat, A. E. Allah and M. H. Khedr, Beni-Seuf Univ. J. Appl. Sci., 2013, 2, 61–71 Search PubMed.
- S. Liang, X. Guo, N. Feng and Q. Tian, J. Hazard. Mater., 2009, 170, 425–429 CrossRef CAS PubMed.
- S. Q. Zhang and W. G. Hou, Colloids Surf., A, 2008, 320, 92–97 CrossRef CAS.
- L. Wang, J. Zhang, R. Zhao, Y. Li, C. Li and C. Zhang, Bioresour. Technol., 2010, 101, 5808–5814 CrossRef CAS PubMed.
- W. Peng, H. Li, Y. Liu and S. Song, Appl. Surf. Sci., 2015, 364, 620–627 CrossRef.
- I. E. M. Carpio, J. D. Mangadlao, N. N. Hang, R. C. Advincula and D. F. Rodrigues, Carbon, 2014, 77, 289–301 CrossRef.
- Y. Sun, D. Shao, C. Chen, S. Yang and X. Wang, Environ. Sci. Technol., 2013, 47, 9904–9910 CrossRef CAS PubMed.
- D. Xu, X. Tan, C. Chen and X. Wang, J. Hazard. Mater., 2008, 154, 407–416 CrossRef CAS PubMed.
- E. Cox, Ind. Eng. Chem. Res., 2002, 46, 432–437 Search PubMed.
- Y. K. Tovbin, Russ. Chem. Bull., 1998, 47, 637–643 CrossRef CAS.
- M. Islam, P. C. Mishra and R. Pate, Chem. Eng. J., 2011, 166, 978–985 CrossRef CAS.
- K. Babaeivelni and A. P. Khodadoust, J. Colloid Interface Sci., 2013, 394, 419 CrossRef CAS PubMed.
| This journal is © The Royal Society of Chemistry 2017 |

