 Open Access Article
Creative Commons Attribution 3.0 Unported Licence
ZnS quantum dots impregnated-mesoporous TiO2 nanospheres for enhanced visible light induced photocatalytic application†
S. Harisha,
M. Sabarinathana,
A. Periyanayaga Kristyb,
J. Archanab,
M. Navaneethan *a,
H. Ikedaa and
Y. Hayakawa
 *a
*a
aResearch Institute of Electronics, Shizuoka University, 3-5-1 Johoku, Naka-ku, Hamamatsu, Shizuoka 432-8011, Japan. E-mail: mpnavaneethan@yahoo.co.in; royhaya@ipc.shizuoka.ac.jp; Fax: +81 53 4781338; Tel: +81 53 4781338
bSRM Research Institute, Department of Physics and Nanotechnology, SRM University, Kattankulathur, Chennai, 603203, Tamil Nadu, India
First published on 17th May 2017
Abstract
ZnS quantum dots were impregnated on the surface of TiO2 mesospheres by a soft template-assisted solvothermal approach. XRD and elemental analysis confirmed the presence of ZnS in the TiO2 nanostructures. Morphological analysis showed that the ZnS quantum dots were firmly immobilized on the TiO2 mesospheres, which improved electron and hole pair separation at the TiO2/ZnS interface. The photocatalytic activity of the mesoporous nanostructures was assessed by photodegradation of methylene blue (MB) as a model pollutant under visible light irradiation. Impregnation with ZnS quantum dots enhanced reaction activity remarkably compared with mesoporous TiO2. The maximum degradation efficiency was observed for 0.025 M of ZnS impregnated on TiO2. The MB-related absorption peak completely disappeared after 32 min of irradiation. Photo-charge scavenger analysis indicated that hydroxyl radicals played a pivotal role in the photodegradation mechanism. The mesoporous photocatalyst was stable and can be used repeatedly under visible irradiation.
Introduction
Removal of hazardous inorganic heavy metal pollutants is vital in water purification.1–3 The search continues for an economic and efficient method to remove such pollutants from wastewater and reduce negative environmental impacts. Heterogeneous photocatalysis is a popular technique with great potential in degradation of organic pollutants, and has proven to be effective in environmental remediation.4 A photocatalysis semiconductor can be used to generate electron–hole pairs by absorbing light with photonic energy, which simultaneously initiates oxidation and reduction with surface species before recombination.5–7 The organic compounds are decomposed into the less toxic materials CO2 and water.2,8 TiO2 is one of the best photocatalysts for the self-cleaning environmental applications because of its relatively high efficiency, low cost and its availability. TiO2 has been widely used as a photocatalyst for removal of hazardous organic substances and as an electrode material for dye-sensitized solar cells9,10 because of its strong oxidizing and reducing ability under UV light irradiation.Mesoporous TiO2 is an interesting structure for photocatalytic applications because of its continuous particle framework, which is beneficial for catalyst recovery when compared with nanoparticles.11 The photocatalytic activity of mesoporous TiO2 is affected by larger surface area that increases the reaction rate, while the existence of amorphous phases promotes e− and h+ recombination, which in turn decreases photocatalytic activity. Additionally, in the photocatalytic field, the pores of nanostructures can serve as channels for charge carriers to penetrate the interior and reduce the recombination rate, thus enhancing the activity.12 To exploit its excellent photocatalytic performance, much effort has been devoted to synthesis of mesoporous TiO2 in recent years. Attempts have been made to control the crystallization and to make more crystalline material with maintenance of mesoscale order.13 Da Silva et al.14 prepared truncated bipyramidal Wulff-shape mesoporous TiO2 by nonaqueous sol–gel synthesis, and this exhibited superior photocatalytic activity. Liu et al.15 synthesized spindle-shaped mesoporous TiO2 using an aqueous peroxotitanium solution with polyacrylamide. However, in recent years, development of visible light active photocatalysts has received major attention because of potential applications for indoor self-cleaning and self-sterilizing surfaces such as glass and ceramic tiles.16–18 Several strategies have been adopted for preparation of such visible light active photocatalysts. Metal doping of mesoporous TiO2 structures is thought to be a good way to enhance the photocatalytic activity, while the coupling of TiO2 with another semiconductor is another widely used approach.19–24
Semiconducting metal sulphides have light absorbing ability in the visible and near-infrared region, which makes them promising as visible-light driven photocatalysts.25–29 In particular, ZnS has been studied in many applications as it is an environmentally friendly material and is constituted by earth-abundant elements.30 ZnS is an important II–VI semiconductor exhibiting a wide direct optical band gap (3.6 eV), making it a very attractive material for optical applications, especially in its nanocrystalline form. Photocatalytically active TiO2/ZnS composites show better photostability and activity than do their individual components. Vaclav et al.31 synthesized a TiO2/ZnS nanocomposite by homogeneous hydrolysis in an aqueous solution of thioacetamide. The prepared composite showed better photocatalytic activity compared with bare TiO2 and ZnS nanoparticles. Xiaodan et al.32 prepared photoactive ZnS/TiO2 nanocubes via a microemulsion-mediated solvothermal method. The photocatalytic activity of ZnS/TiO2 composites was enhanced compared with pure anatase TiO2 under visible light irradiation. Srinivasa Rao et al.33 synthesized a TiO2/ZnS photo-anode on fluorine-doped tin oxide (FTO), which accumulated a large number of photo-injected electrons in the conduction band (CB) and achieved lower recombination rate compared with bare TiO2. Franco et al.34 synthesized a distinct nanocrystalline TiO2-capped ZnS using a chemical vapour deposition method. The TiO2-capped ZnS increased the catalyst photoactivity compared with bare TiO2. However, all these reports are related to the TiO2 nanoparticles and ZnS – any interaction between the ZnS nanoparticles and TiO2 nanoparticles is not discussed. Therefore, research is required into the ZnS included TiO2 mesoporous network, with the aim of to extending charge separation and ultrafast degradation under visible light irradiation. To date, no research has been reported on mesoporous TiO2/ZnS nanospheres.
The present study describes a soft template route to synthesize ZnS quantum dot impregnated mesoporous TiO2 spheres with enhanced photocatalytic activity. The effect of metal sulphide concentration on the phase and morphology was investigated. The functional properties of mesoporous TiO2 spheres were investigated using X-ray diffraction (XRD), field-emission scanning electron microscopy (FESEM), transmission electron microscopy (TEM) and X-ray photoelectron spectroscopy (XPS). The photocatalytic activity of the synthesized materials was characterized by quantifying the rate of methylene blue (MB) degradation in the aqueous suspension under visible light irradiation. The photostability and photocatalytic mechanism of mesoporous TiO2 is proposed.
Experimental method
All chemicals were purchased from Wako Chemicals (Japan) and used without further purification. Three steps were followed for preparation of mesospheres TiO2/ZnS mesoporous nanostructures.Formation of titania glycolate spheres
1 mL of titanium tetraisopropoxide was added to 50 mL ethylene glycol. The solution was stirred at room temperature, and then added to an acetone bath (150 mL) containing trace water. The solution was stirred for 2 h to form a white suspension, which was collected by centrifugation, thoroughly washed with distilled water and ethanol to remove impurities, and dried at 100 °C for 10 h.Formation of mesoporous TiO2 spheres
The titania glycolate spheres were dispersed in an equal volume of water and ethanol (30 mL), and stirred for 2 h. The white solution was transferred to a 100 mL Teflon-lined stainless steel autoclave, and heated at 150 °C for 12 h. The resulting product was collected and annealed at 300 °C for 2 h.Formation of mesoporous TiO2/ZnS nanocomposites
The mesoporous TiO2 spheres were dispersed in 50 mL of water and different mole concentrations of zinc acetate (0.025, 0.050, 0.075 and 0.1 M) and thioacetamide (0.025, 0.050, 0.075 and 0.1 M) were added. Pyridine was added as a capping ligand. The reaction was stirred for 12 h. The white solution was transferred to a 100 mL Teflon-lined stainless steel autoclave, and heated at 150 °C for 15 h. The resulting product was collected and dried at 100 °C for 10 h. The sample were termed as Ti for pure mesoporous TiO2, TiZ-1 for 0.025 M of ZnS, TiZ-2 for 0.050 M of ZnS, TiZ-3 for 0.075 M of ZnS and TiZ-4 for 0.1 M of ZnS, respectively.Characterization
Surface morphologies were observed using JEOL JSM 7001F field-emission scanning electron microscopy (FESEM). Transmission electron microscopy (TEM) images were recorded using a JEOL JEM 2100F microscope at an accelerating voltage of 200 kV. Crystalline phases were obtained by X-ray diffraction (XRD), using a Rigaku diffractometer (RINT-2200, Japan, CuKα radiation) with a 0.02° s−1 scan rate. Raman spectra were obtained using a JASCO NR-1800 spectrometer. Ultraviolet-visible (UV-vis) absorption spectra were measured using a Shimadzu 3100 PC spectrophotometer (Japan). X-ray photoelectron spectroscopy (XPS) were recorded by a Shimadzu ESCA 3400.Photocatalytic studies
The photocatalytic activity of the synthesized samples was evaluated at room temperature under a xenon light source (MAX-303, Asahi Spectra) as a source of visible-light irradiation. In a typical reaction, the dye concentration was fixed at 10 ppm and a known dosage (50 mg L−1) of photocatalyst was added to the dye solution. The suspension was stirred to achieve an absorption–desorption equilibrium state of the solution, which was kept in the dark before light irradiation.35,36 The reaction mixture was irradiated with stirring under the halogen lamp positioned at 21 cm above the reaction mixture. The reaction vessel consisted of an external jacket for water circulation to maintain the reaction mixture at room temperature. At regular time intervals, 3 mL of the suspension was collected, centrifuged, and analyzed using a UV-vis spectrometer. The MB degradation was estimated from the decrease in the intensity of the associated characteristic band absorption at 664 nm. The photodegradation percentage of MB was calculated using the following equation:37
 | (1) |
Result and discussion
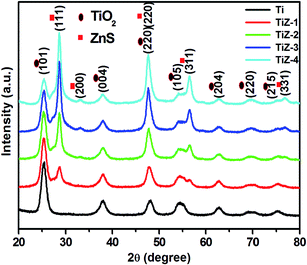
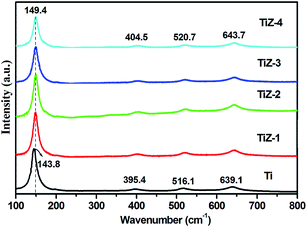
X-ray diffraction measurements were performed to investigate the crystal structure of the TiO2 and TiO2/ZnS nanostructures (Fig. 1). All the diffraction peaks corresponded to anatase phase TiO2 and were in good agreement with standard JCPDS card no. 21-1272. Peaks at 25.36°, 37.85°, 47.64°, 54.06°, 62.72°, 69.53° and 76.83° corresponded to the (101), (004), (220), (105), (204), (220) and (215) planes, respectively. A new diffraction peak of ZnS appeared at 28.70° for the TiZ-1 sample. This is attributed to formation of TiO2/ZnS quantum dots on TiO2. Furthermore, on increasing the ZnS amount from 0.050 to 0.1 M, diffraction peaks of ZnS were observed at 28.70°, 33.01°, 47.64°, 56.44° and 76.72° which corresponded to (111), (200), (220), (311) and (331) planes, respectively, matching well with cubic ZnS (JCPDS card no. 65-5476). Other peaks were in good agreement with the anatase structure of TiO2 (JCPDS card no. 84-1286). No peaks were observed related to other phases. The decrease in the peak intensity of TiO2 mainly resulted from impregnation of ZnS quantum dots on the TiO2.33Raman spectra of the mesoporous TiO2 and TiO2/ZnS mesoporous nanostructures are shown in Fig. 2. The peaks at 143.8, 395.4, 516.1 and 639.1 cm−1 corresponded to the Eg, B1g, B1g and Eg modes of anatase phase of mesoporous TiO2, respectively.38–40 When ZnS was in mesoporous TiO2, the peaks were shifted to 149.4, 404.5, 520.7 and 643.7 cm−1. The shift of the peak position and the decrease of the peak intensities indicated that ZnS quantum dots influenced TiO2. Hence, significant peak shift was observed.32
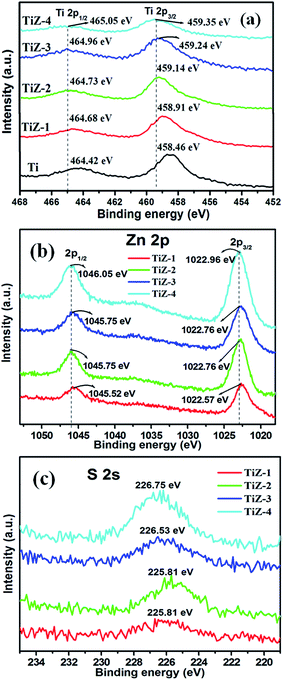
XPS was performed to further analyze the chemical states of elements in the as-prepared TiO2 and TiO2/ZnS mesoporous nanostructures. Fig. 3 and 4 show the high resolution XPS spectra of Ti 2p, Zn 2p, S 2s and O 1s states, respectively. In Fig. 3(a), the high resolution Ti 2p spectra presented two peaks at binding energies of 458.46 eV (Ti 2p3/2) and 464.42 eV (Ti 2p1/2), which were assigned to Ti4+ in anatase titanium.41,42 The separation between the Ti 2p3/2 and Ti 2p1/2 was 5.9 eV, consistent with the reported value of TiO2.43 The binding energies of sample TiZ-1 were shifted to 458.91 eV and 464.68 eV from 458.46 eV and 464.42 eV compared with mesoporous TiO2. Furthermore, increasing the concentration of ZnS caused the peaks to shift to 459.14 eV and 464.73 eV for sample TiZ-2, 459.24 eV and 464.96 eV for sample TiZ-3 and 459.35 eV and 465.05 eV for sample TiZ-4. The binding energy of Ti 2p shifted to higher energy with increasing ZnS concentration.44
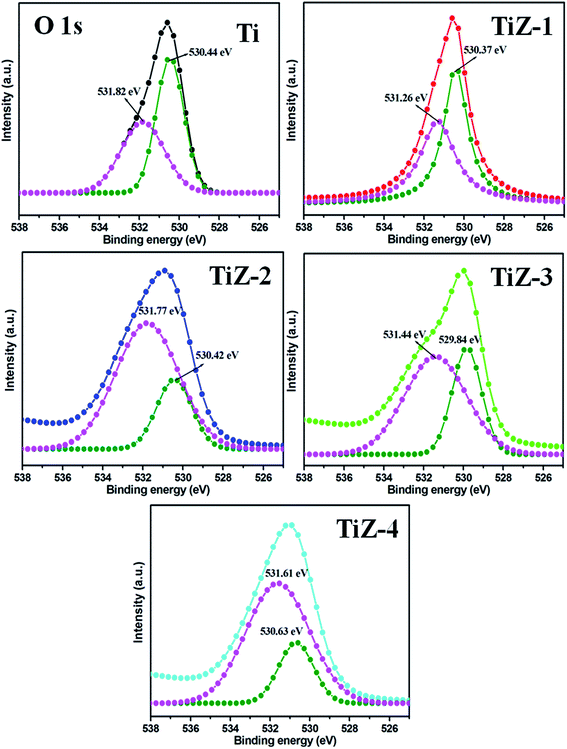
The Zn 2p3/2 and 2p1/2 peaks were located at 1022.57 and 1045.52 eV, respectively [Fig. 3(b)], illustrating formation of ZnS.45 The difference between the two binding energies was 22.95 eV, which is in good agreement with the standard value of 22.97 eV.46 The position of peaks in sample TiZ-4 shifted from 1022.57 eV to 1022.96 eV and from 1045.52 eV to 1046.05 eV compared with sample TiZ-1. As the ionic radius of Zn2+ is slightly larger than that of Ti4+, substituting the Zn atom in the TiO2 crystal structure could slightly distort the anatase crystal.47,48 These observations indicated possible diffusion of Zn in mesoporous TiO2. The peak at 225.81 eV corresponded to S 2s state [Fig. 3(c)], consistent with the reported value.49 A similar shift of peak from 225.81 eV to 226.75 eV was observed with increasing Zn content. According to the high-resolution scan spectra, the binding energies of Ti 2p, Zn 2p, S 2s and O 1s shifted to higher values as the concentration of Zn increased in the composites, suggesting changes in the chemical environment. Binding energy was dependent on shielding effect caused by the electron density around atoms. Hence, the increase in the binding energy of Ti 2p and Zn 2p could be attributed to the enhanced electron density around Ti and Zn atoms with strong interaction. The binding energies of O 1s of TiO2 and TiO2/ZnS mesoporous nanostructures are shown in Fig. 4. The peaks are deconvoluted into two peaks centred at 530.44 and 531.82 eV (Ti sample) by Gaussian fitting, which corresponded to the contributions from the surface adsorbed hydroxyl groups50,51 and Ti–O,52,53 respectively. The peaks of composite samples shifted to 530.37 and 531.26 eV for sample TiZ-1, 530.42 and 531.77 eV for sample TiZ-2, 529.84 and 531.44 eV for sample TiZ-3 and 530.63 and 531.61 eV for sample TiZ-4. On the basis of the above analyses, it can be concluded that there was strong interaction between ZnS and TiO2 in TiO2/ZnS composites. The interaction significantly modified the original chemical states and electronic properties in the nanocomposite.
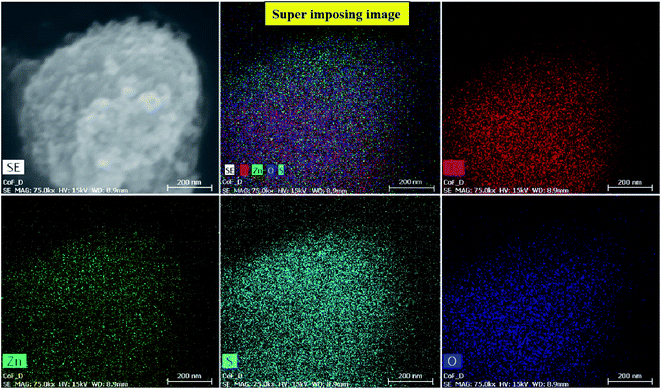
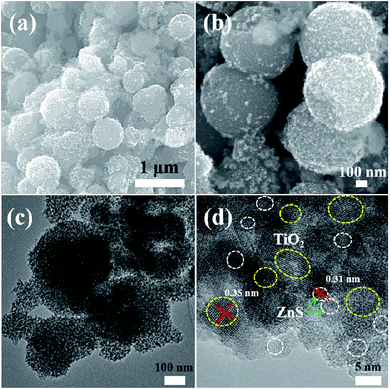
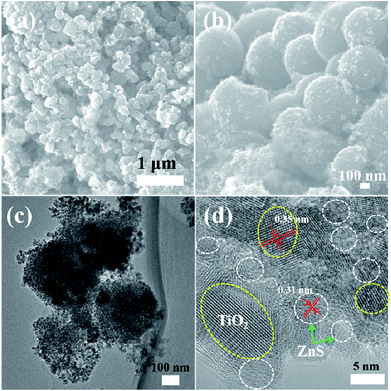
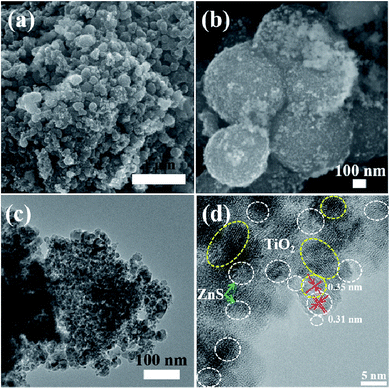
Fig. 5–9 show the FESEM, TEM and HRTEM images of mesoporous TiO2 and TiO2/ZnS quantum dots. Fig. 5(a) shows typical FESEM images of the titania glycolate spheres, which exhibited an average size of 400–500 nm with smooth surfaces. Porous TiO2 spheres were formed after solvothermal treatment as shown in Fig. 5(b). A TEM image of the porous TiO2 spheres is shown in Fig. 5(c). In addition, the presence of lattice fringes of mesoporous TiO2 can be clearly observed in the HRTEM image, as shown in Fig. 5(d). Lattice fringe spacing is 0.35 nm and is in good agreement with the (101) lattice plane of anatase TiO2. When the ZnS concentration was 0.025 M, ZnS quantum dot was impregnated on the mesoporous TiO2, as shown in Fig. 6(a). As the ZnS concentration increased to 0.050, 0.075 and 1.0 M, the morphology of the products became densely covered mesoporous TiO2. The morphology of TiZ-1 was further analyzed by TEM, as shown in Fig. 6(c). The surface of the spheres was rough with surface decoration. At higher concentration, the surface of TiO2 was densely covered with ZnS nanoparticles. Fig. 6(d) displays the representative HRTEM image of the TiO2/ZnS mesospheres, with the white dashed line corresponding to ZnS quantum dots and the yellow dashed line corresponding to anatase TiO2. The lattice fringe spacing of TiO2 (101) and ZnS (111) is 0.35 nm and 0.31 nm, respectively. The HRTEM images make evident that the TiO2 nanocrystals are in close contact with the ZnS nanocrystals. The formation of a heterojunction (pink dashed line) enhanced transport of photogenerated electrons and holes between TiO2 and ZnS. The ZnS nanoparticles were about 2–5 nm for TiZ-1, 2–6 nm for TiZ-2, 2–6 nm for TiZ-3 and 3–6 nm for TiZ-4, as shown in Fig. S1.† High resolution TEM images showed the good crystalline nature. Fig. 10 shows the elemental mapping of the Ti, Zn, O and S in the TiZ-1 sample. It is clearly evident that the Zn signal originated in a similar spatial area to that of the corresponding Ti signal. From the elemental mapping, it is confirmed that a composite distribution was formed in TiO2/ZnS mesoporous nanostructure.
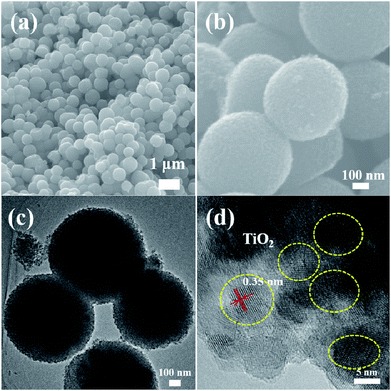 | ||
| Fig. 5 (a) and (b) FESEM images of mesoporous TiO2 spheres. (c) and (d) TEM and HRTEM images of mesoporous TiO2 spheres. | ||
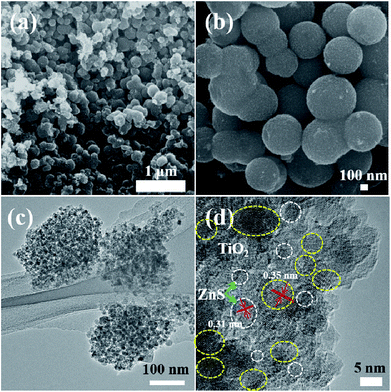 | ||
| Fig. 6 (a) and (b) FESEM images of mesoporous TiO2/ZnS spheres. (c) and (d) TEM and HRTEM images of mesoporous sample TiZ-1. | ||
 | ||
| Fig. 7 (a) and (b) FESEM images of mesoporous TiO2/ZnS spheres. (c) and (d) TEM and HRTEM images of mesoporous sample TiZ-2. | ||
 | ||
| Fig. 8 (a) and (b) FESEM images of mesoporous TiO2/ZnS spheres. (c) and (d) TEM and HRTEM images of mesoporous sample TiZ-3. | ||
 | ||
| Fig. 9 (a) and (b) FESEM images of mesoporous TiO2/ZnS spheres. (c) and (d) TEM and HRTEM images of mesoporous sample TiZ-4. | ||
Photocatalysis
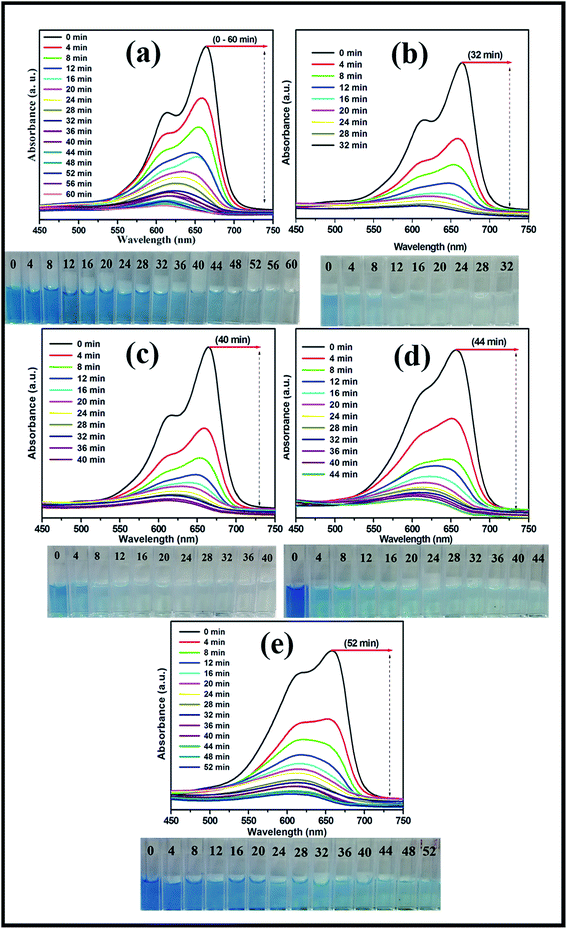
The photocatalytic activities of the mesoporous TiO2 and TiO2/ZnS quantum dots were evaluated by examination of MB dye degradation under visible light irradiation. The photocatalytic activities of prepared samples were tested by examining the degradation of organic pollutants (MB) as a function of time. The decrease in relative concentration of the MB was estimated by measuring the relative intensity of the peak at 664 nm from the optical absorbance spectra. Fig. 11(a) shows the time-dependent UV absorption spectra of mesoporous TiO2 catalyst, which completely decomposed with irradiation time of 60 min. The effect of addition of different concentrations of TiO2 as TiZ-1, TiZ-2, TiZ-3 and TiZ-4 is shown in Fig. 11(b–e). Fig. 11(b) shows a rapid decrease in the initial absorbance of the peak, which disappeared completely after 32 min of irradiation. As the concentration of Zn was increased to 0.050, 0.075 and 0.1 M, photodegradation time increased to 40, 44 and 52 min, as shown in Fig. 11(c)–(e). Pure TiO2 (Ti) exhibited the lowest photocatalytic activity, with TiO2/ZnS composite showing higher photocatalytic activity. Thus, it can be concluded that introduction of a very small amount of ZnS to the TiO2 surface resulted in improved performance of dye degradation.Fig. 12(a) shows the effect of mesoporous TiO2 and TiO2/ZnS nanocomposite on MB degradation. MB decolonization in the absence of catalyst was also evaluated. Less than 10% of the MB in the solution disappeared after 60 min of photolysis. The degradation rate of mesoporous TiO2/ZnS catalysts decreased with increasing ZnS content from 0.025 M to 0.1 M. Sample TiZ-1 had the highest activity of all samples. As the photocatalytic reaction is dependent on the surface atomic arrangement at the interface between the catalyst surface and organic pollutants,54,55 the optimum content of ZnS is an important factor in the photocatalytic activity of the TiO2/ZnS photocatalyst. Fig. 12(b) shows the schematic representation and pore size distribution of the mesoporous TiO2 and TiO2/ZnS photocatalyst. Addition of ZnS at different concentrations affected the structure of mesoporous TiO2. At lower mole concentration (0.025 M and 0.050 M), the ZnS initiated growth of nanoparticles on the mesoporous TiO2. Increasing the concentration of ZnS caused the number of ZnS nuclei to increase and the nanoparticles were grown completely on the mesoporous spheres. Thus, ZnS concentration has an important role in formation of heterojunctions between TiO2/ZnS nanocomposites. It results in inhibition of electron/hole pair recombination.56,57 Average pore size distribution was calculated using the Barrett–Joyner–Halenda (BJH) method and the values were 9.79, 9.31, 8.98, 8.88 and 6.82 nm for Ti, TiZ-1, TiZ-2, TiZ-3 and TiZ-4, respectively. Such pore size analysis revealed that higher concentration of ZnS reduces the pore size of mesoporous spheres by occupying pores of the network. This significantly suppresses the interaction of organic pollutants with the photocatalyst.
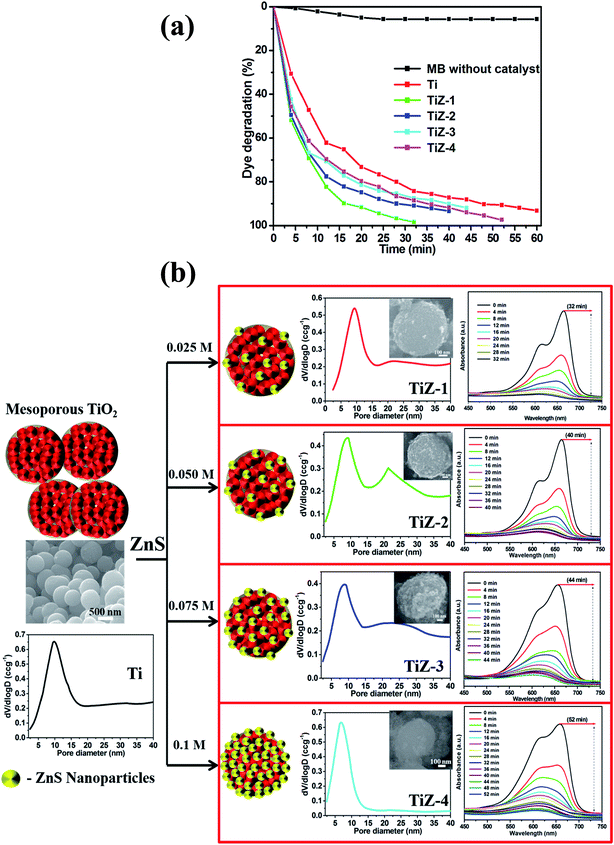 | ||
| Fig. 12 Effect of dye degradation efficiency. (a) Time (min) vs. dye degradation (%) and (b) growth mechanism of TiO2/ZnS mesoporous nanostructures. | ||
To elucidate the photocatalytic process under visible light, active species generated during the reaction were identified by free radical and hole scavenging experiments. Hydroxyl radicals (˙OH), holes (h+) and superoxide anions (O2−˙) are possible active species in photodegradation of organic pollutants.37,44 To detect the active species during the photocatalytic reaction, benzoic acid (BA), the sodium salt of ethylenediamine tetraacetate (EDTA) and potassium persulphate (K2S2O8) were introduced into the catalyst solution as scavengers, respectively, of hydroxyl radicals, holes and superoxide radical anion.41,47 Fig. 13(a) presents the photodegradation of MB catalysed by TiO2/ZnS (TiZ-1) in the presence of these various scavengers under visible light illumination. Compared with the scavenger-free system, the dye degradation efficiency in the presence of O2−˙ scavenger was 91.93%. In contrast, the reaction with the addition of h+ scavenger EDTA, was almost inhibited with 38% of MB degradation after 32 min. To further determine the degradation mechanism, another experiment was performed using the BA scavenger. The photocatalytic activity was greatly reduced in the presence of the O2−˙ scavengers, with 54% MB degraded in 32 min. These results strongly suggest that hydroxyl radicals, holes and superoxide radical anions all contribute to photodegradation, but that the hole is a key intermediate as trapping – it totally inhibited photodegradation. It can be concluded that hole (h+) radical is the major oxidative species responsible for photooxidative conversion of MB.58
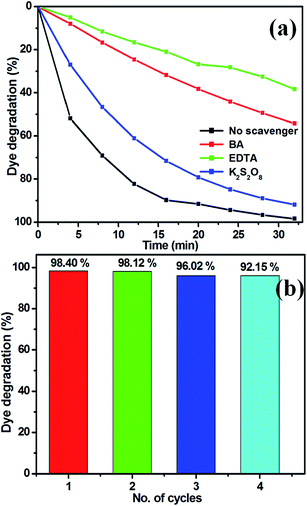 | ||
| Fig. 13 (a) Effect of MB degradation over TiO2/ZnS in the presence of various scavengers and (b) reusability of sample TiZ-1 under visible light irradiation. | ||
The stability of a photocatalyst is important for practical applications, thus the TiO2/ZnS composite photocatalyst was recycled under the same conditions. Fig. 13(b) shows the reusability of TiZ-1 photocatalyst for degradation of MB examined over three cycles of 32 min under visible light irradiation. After the photocatalysis experiments, the catalyst was separated from the reaction mixture by centrifugation and the concentration of the dye solution was adjusted to its initial value. Photocatalysts were reused for three cycles and the obtained degradation values were 90.90, 90.64 and 89.92% for the first, second and third cycles, respectively. The photocatalytic efficiency of the TiO2/ZnS composites did not decline significantly, suggesting that the catalyst has good stability and sustainability. Fig. S2† shows the XRD patterns of the TiO2/ZnS composites before and after four runs of photocatalytic activity under the visible light irradiation for degradation of MB. It can be clearly observed that the phase and structure of the TiO2/ZnS composite were unchanged after the photocatalytic cycles; suggesting that the sample was stable under the present photocatalytic degradation process. In addition, the photocatalytic structural stabilities and photocatalytic loss of TiO2/ZnS composites were investigated using XPS spectra, as shown in Fig. S2.† The binding energies of Zn 2p, Ti 2p, O 1s and S 2p of the recycled TiO2/ZnS showed no peak-shift compared with those of the fresh sample, inferring that the chemical states of Zn, Ti, O and S elements in TiO2/ZnS did not change during the reaction process.
Kinetic study
The rate of photocatalytic reduction of the nanocomposites can be described by pseudo-first-order kinetics, so plots of ln(C0/Ct) versus irradiation time for the adsorption and degradation of MB on TiO2/ZnS nanocomposites were examined. The ln(C0/Ct) curves versus irradiation time were linear, indicative of good correlation to first-order kinetics (Fig. 14(a)). The apparent rate constant K was calculated to be 0.0428, 0.1199, 0.0675, 0.0591 and 0.0526 min−1 for Ti, TiZ-1, TiZ-2, TiZ-3 and TiZ-4, respectively. K value decreased with addition of ZnS at concentrations from 0.025 M to 0.1 M (0.1199 min−1 to 0.0526 min−1). The K for the TiO2/ZnS sample was 0.1199 min−1, 2.5 times higher than that of pure TiO2 (0.0428 min−1). The kinetic data obtained using the pseudo-first order model such as apparent rate constants (Kapp), corresponding correlation coefficients (R2) and maximum dye degradation in the presence of TiO2/ZnS nanostructures are presented in Table 1. Introduction of ZnS quantum dots into the mesoporous TiO2 was in favour of high increased photocatalytic activity and suppressed the recombination of photogenerated electron/hole pairs.59,60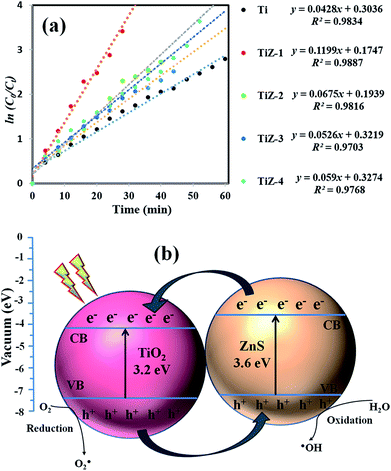 | ||
| Fig. 14 (a) Plots of ln(C0/Ct) as a function of time (min) for the photodegradation of MB over the TiO2/ZnS nanocomposites, and (b) photocatalytic mechanism of TiO2/ZnS nanocomposites. | ||
| Sample | Kapp (TiO2/ZnS) | R2 | Maximum degradation (%) | Time taken for maximum degradation (min) |
|---|---|---|---|---|
| Ti | 0.0428 | 0.9834 | 84.27 | 60 |
| TiZ-1 | 0.1199 | 0.9887 | 98.40 | 32 |
| TiZ-2 | 0.0675 | 0.9816 | 93.42 | 40 |
| TiZ-3 | 0.0590 | 0.9768 | 91.89 | 44 |
| TiZ-4 | 0.0526 | 0.9703 | 97.36 | 52 |
Schematic representation of photocatalytic activity of mesoporous TiO2/ZnS nanocomposites is shown in Fig. 14(b). When the light is irradiated, the visible light provides the photons required to generate electron and hole pairs. The conduction band (CB) of TiO2 lies at a more positive potential than that of ZnS, while the valence band (VB) of ZnS is more negative than that of TiO2. From the energy band diagram, it was found that an electron from the bottom of the CB of ZnS quickly transferred to the CB of TiO2. Meanwhile, the photogenerated hole transfer could take place from the VB of TiO2 to the VB of ZnS, suggesting that the photogenerated electrons and holes were efficiently separated.61 Such band structure facilitates separation of the excited electrons and hole pairs, and facilitates redox reactions where electrons reduce dissolved molecular oxygen to produce superoxide radical anions (˙O2−), while holes oxidize H2O molecular to yield hydroxyl radicals (HO˙) on the TiO2/ZnS surfaces. Organic dye pollutants (MB) are eventually oxidized by these highly active species to CO2 and H2O products.62
Conclusion
Assessment of photocatalytic degradation of organic compounds using the TiO2/ZnS mesoporous nanostructures revealed a remarkably higher reaction rate under visible light irradiation compared with that of pure mesoporous TiO2. Impregnation of ZnS quantum dots was confirmed by XPS and elemental analysis. The investigation of photocatalytic activity indicated that the TiO2/ZnS nanocomposites possessed higher photocatalytic activity compared with mesoporous TiO2 for degradation of MB under visible light irradiation. The maximum degradation efficiency was observed for 0.025 M of ZnS, where the MB related absorption peak completely disappeared after 32 min of irradiation. Photogenerated holes (h+) over TiO2/ZnS supported photocatalysts in the photodegradation of organic pollutants. After four cycles of reuse, the catalyst showed significant capacity for dye degradation.Acknowledgements
This work was financially supported by (1) a Grant-in-Aid for Scientific Research (Chosenteki Houga) (16K14229) from the Ministry of Education, Culture, Sports, Science and Technology (MEXT) of Japan, (2) the cooperative research projects of the Research Institute of Electronics, Shizuoka University.References
- X. Yu, Z. Zhao, J. Zhang, W. Guo, L. Li, H. Liu and Z. L. Wang, CrystEngComm, 2017, 19, 129–136 RSC.
- S. Harish, J. Archana, M. Sabarinathan, M. Navaneethan, K. D. Nisha, S. Ponnusamy, C. Muthamizhchelvan, M. Shimomura, H. Ikeda, D. K. Aswal and Y. Hayakawa, Appl. Surf. Sci., 2016 DOI:10.1016/j.apsusc.2016.12.082.
- S. Vadivel, D. Maruthamani, A. Habibi-Yangjeh, B. Paul, S. S. Dhar and K. Selvam, J. Colloid Interface Sci., 2016, 480, 126–136 CrossRef CAS PubMed.
- S. Harish, M. Navaneethan, J. Archana, A. Silambarasan, S. Ponnusamy, C. Muthamizhchelvan and Y. Hayakawa, Dalton Trans., 2015, 44, 10490–10498 RSC.
- X. Lang, W. Ma, C. Chen, H. Ji and J. Zhao, Acc. Chem. Res., 2014, 47, 355–363 CrossRef CAS PubMed.
- K. Sunada, X. G. Ding, M. S. Utami, Y. Kawashima, Y. Miyama and K. Hashimoto, J. Agric. Food Chem., 2008, 56, 4819–4824 CrossRef CAS PubMed.
- Y. Lu, H. Yu, S. Chen, X. Quan and H. Zhao, Environ. Sci. Technol., 2012, 46, 1724–1730 CrossRef CAS PubMed.
- R. Richter, T. Ming, P. Davies, W. Liu and S. Caillol, Prog. Energy Combust. Sci., 2017, 60, 68–96 CrossRef.
- J. Archana, M. Navaneethan and Y. Hayakawa, J. Power Sources, 2013, 242, 803–810 CrossRef CAS.
- J. Archana, S. Harish, M. Sabarinathan, M. Navaneethan, S. Ponnusamy, C. Muthamizhchelvan, M. Shimomura, H. Ikeda, D. K. Aswal and Y. Hayakawa, RSC Adv., 2016, 6, 68092–68099 RSC.
- S. Chen, H. Wang, L. Zhu, J. Li and J. Sun, Appl. Surf. Sci., 2014, 321, 86–93 CrossRef CAS.
- Z. Lianjie, L. Kun, L. Hongbin, S. Youguang and Q. Mo, Solid State Sci., 2013, 20, 8–14 CrossRef.
- L. Wei, W. Zhangxiong, W. Jinxiu, A. A. Elzatahry and Z. Dongyuan, Chem. Mater., 2014, 26, 287–298 CrossRef.
- R. O. Da Silva, R. H. Galves, D. G. Stroppa, A. J. Ramirez and E. R. Leite, Nanoscale, 2011, 3, 1910–1916 RSC.
- X. Liu, Y. Gao, C. Cao and H. Luo, Langmuir, 2010, 26, 7671–7674 CrossRef CAS PubMed.
- A. Fujishima, T. N. Rao and D. A. Tryk, J. Photochem. Photobiol., C, 2000, 1, 1–21 CrossRef CAS.
- A. Fujishima, X. Zhang and D. A. Tryk, Int. J. Hydrogen Energy, 2007, 32, 2664–2672 CrossRef CAS.
- M. Yan, L. Yuanzhi, M. Mingyang, H. Jingtao, Z. Min and Z. Xiujian, J. Mater. Chem. A, 2015, 3, 5509–5516 Search PubMed.
- G. Weiyin, W. Minqiang, R. Chenxin, Y. Xi, Y. Honghui, L. Jing, H. Delong and B. Jinbo, Nanoscale, 2014, 6, 5498–5508 RSC.
- S. Harish, M. Sabarinathan, J. Archana, M. Navaneethan, K. D. Nisha, S. Ponnusamy, V. Gupta, C. Muthamizhchelvan, D. K. Aswal, H. Ikeda and Y. Hayakawa, Appl. Surf. Sci., 2016 DOI:10.1016/j.apsusc.2017.01.164.
- H. Choonyian, C. Weesiong, S. A. Rahman, P. Khiew, S. Radiman, R. A. Shukor, M. A. A. Hamid and N. Ghazali, New J. Chem., 2016, 40, 1124–1136 RSC.
- H. Luyang, Z. Yumin, Z. Shanmei and L. Benxia, RSC Adv., 2016, 6, 43098–43103 RSC.
- M. Zalfani, B. Schueren, H. Zhi-Yi Hu, J. C. Rooke, R. Bourguiga, M. Wu, Y. Li, G. V. Tendeloo and S. Bao-Lian, J. Mater. Chem. A, 2015, 3, 21244–21256 CAS.
- F. Xin, Z. Wendong, S. Yanjuan, H. Hongwei and D. Fan, Environ. Sci.: Nano, 2017, 4, 604–612 RSC.
- C. Mondal, M. Ganguly, J. Pal, A. Roy, J. Jana and T. Pal, Langmuir, 2014, 30, 4157–4164 CrossRef CAS PubMed.
- F. Xin, Z. Wendong, D. Hua, N. Zilin, D. Fan and Z. Yuxin, J. Hazard. Mater., 2017, 322, 223–232 CrossRef PubMed.
- Y. Kim, S. J. Kim, C. Sung-Pyo, B. H. Hong and J. Du-Jeon, Sci. Rep., 2015, 5, 12345–12353 CrossRef CAS PubMed.
- C. Wang, Y. Ao, P. Wang, J. Hou, J. Qian and S. Zhang, Mater. Lett., 2010, 64, 439–441 CrossRef CAS.
- Y. Guo, L. Wang, L. Yang, J. Zhang, L. Jiang and X. Ma, Mater. Lett., 2011, 65, 486–489 CrossRef CAS.
- Y. C. Zhang, Z. N. Du, S. Y. Li and M. Zhang, Appl. Catal., B, 2010, 95, 153–159 CrossRef CAS.
- S. Vaclav, B. Snejana, M. Nataliya, H. Vendula and L. Kamil, Microporous Mesoporous Mater., 2008, 110, 370–378 CrossRef.
- Y. Xiaodan, W. Qingyin, J. Shicheng and G. Yihang, Mater. Charact., 2006, 57, 333–341 CrossRef.
- S. Srinivasa Rao, D. Punnoose, C. V. Tulasivarma, C. H. S. S. Pavan Kumar, C. V. V. M. Gopi, S. K. Kim and H. J. Kim, Dalton Trans., 2015, 44, 2447–2455 RSC.
- A. Franco, M. C. Nevew, M. M. L. Ribeiro Carrott, M. H. Mendonca, M. I. Pereira and O. C. Monteiro, J. Hazard. Mater., 2009, 161, 545–550 CrossRef CAS PubMed.
- X. Chen, F. Zhang, Q. Wang, X. Han, X. Li, J. Liu, H. Lin and F. Qu, Dalton Trans., 2015, 44, 3034–3042 RSC.
- C. Mondal, A. Singh, R. Sahoo, A. K. Sasmal, Y. Negishi and T. Pal, New J. Chem., 2015, 39, 5628–5635 RSC.
- M. Sabarinathan, S. Harish, J. Archana, M. Navaneethan, H. Ikeda and Y. Hayakawa, RSC Adv., 2016, 6, 109495–109505 RSC.
- T. Ohsaka, J. Phys. Soc. Jpn., 1980, 48, 1661–1668 CrossRef CAS.
- B. Karunagaran, K. Kim, D. Mangalraj, J. Yi and S. Velumani, Sol. Energy Mater. Sol. Cells, 2005, 88, 199–208 CrossRef CAS.
- Y. Li, Y. Duan and W. Li, Spectrosc. Spectral Anal., 2000, 20, 699–701 CAS.
- L. Kong, Z. Li, S. Huang, J. Jia and L. Li, Appl. Catal., B, 2017, 204, 403–410 CrossRef CAS.
- H. Yu, W. Chen, X. Wang, Y. Xu and J. Yu, Appl. Catal., B, 2016, 187, 163–170 CrossRef CAS.
- R. Sanjines, H. Tang, H. Berger, F. Gozzo, G. Margaritondo and F. Levy, J. Appl. Phys., 1994, 75, 2945–2951 CrossRef CAS.
- Z. Jingxin, Z. Shule, C. Wei and Q. Zhong, Appl. Surf. Sci., 2013, 268, 535–540 CrossRef.
- C. V. Reddy, J. Shima and M. Cho, J. Phys. Chem. Solids, 2017, 103, 209–217 CrossRef CAS.
- S. Ameen, M. Shaheer and H. S. Shin, J. Chem., 2013, 29, 837–860 CAS.
- Z. Ali, S. N. Cha, J. I. Sohn, I. Shakir, C. Yan, J. M. Kim and D. J. Kang, J. Mater. Chem., 2012, 22, 17625–17629 RSC.
- Y. Zhao, C. Li, X. Liu, F. Gu, H. L. Du and L. Shi, Appl. Catal., B, 2008, 79, 208–215 CrossRef CAS.
- L. V. Garciaa, M. I. Mendivila, G. Garcia Guillena, J. A. Aguilar Martineza, B. Krishnana, D. Avellanedaa, G. A. Castilloa, T. K. Das Roya and S. Shajia, Appl. Surf. Sci., 2015, 336, 329–334 CrossRef.
- D. A. Zatsepin, D. W. Boukhvalov, N. V. Gavrilov, A. F. Zatsepin, V. Y. Shur, A. A. Esin, S. S. Kim and E. Z. Kurmaev, Appl. Surf. Sci., 2017, 400, 110–117 CrossRef CAS.
- NIST XPS Database (Web-version), rev. 4.1, http://srdata.nist.gov/xps/, called 2016-07-21.
- C. He, Y. Yu, X. Hu and A. Larbot, Appl. Surf. Sci., 2002, 200, 239–247 CrossRef CAS.
- Y. L. Lin, T. J. Wang and Y. Jin, Powder Technol., 2002, 123, 194–198 CrossRef CAS.
- L. Zheng, Y. Zheng, C. Chen, Y. Zhan, X. Lin, Q. Zheng, K. Wei and J. Zhu, Inorg. Chem., 2009, 48, 1819–1825 CrossRef CAS PubMed.
- M. R. Hoffmann, S. T. Martin, W. Choi and D. W. Bahnemann, Chem. Rev., 1995, 95, 69–72 CrossRef CAS.
- A. A. Ismail and D. W. Bahnemann, J. Mater. Chem., 2011, 21, 11686–11707 RSC.
- M. Faisal, A. A. Ibrahim, F. A. Harraz, H. Bouzid, M. S. Al-Assiri and A. A. Ismail, J. Mol. Catal. A: Chem., 2015, 397, 19–25 CrossRef CAS.
- Y. Xia, Q. Li, K. Lv and M. Li, Appl. Surf. Sci., 2017, 398, 81–88 CrossRef CAS.
- H. Jia, W. He, W. G. Wamer, X. Han, B. Zhang, S. Zhang, Z. Zheng, Y. Xiang and Y. Jun-Jie, J. Phys. Chem. C, 2014, 118, 21447–21456 CAS.
- M. Vautier, C. Guillard and J. M. Herrmann, J. Catal., 2001, 201, 46–59 CrossRef CAS.
- Q. Xiaofei, H. Yuchen, W. Chengpeng, D. Fanglin and C. Lixin, RSC Adv., 2015, 5, 5307–5311 RSC.
- Z. Yunlong, Z. Haijiao, C. Longli, M. Yu, H. Le, D. Guoji, J. Zheng, B. Lifeng, N. Manhtai and Z. Guanghong, Eur. J. Inorg. Chem., 2015, 2895–2900 Search PubMed.
Footnote |
| † Electronic supplementary information (ESI) available. See DOI: 10.1039/c7ra03061d |
| This journal is © The Royal Society of Chemistry 2017 |

