 Open Access Article
Immobilization of tyrosinase on polyacrylonitrile beads: biodegradation of phenol from aqueous solution and the relevant cytotoxicity assessment
Qiao Wu,
Zhiqun Xu,
Yunjian Duan,
Yincan Zhu,
Minrui Ou and
Xiaoping Xu *
*
College of Chemistry and Chemical Engineering, Fuzhou University, Fuzhou 350108, China. E-mail: xu@fzu.edu.cn
First published on 26th May 2017
Abstract
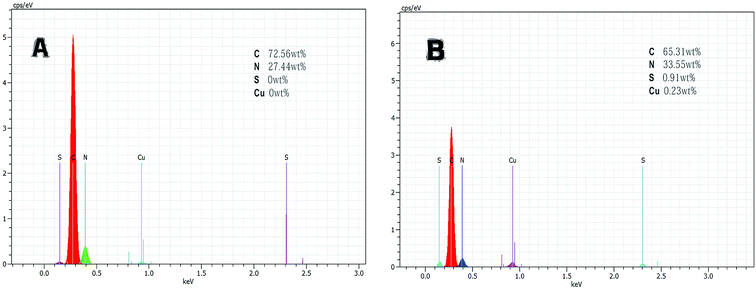
An economical and stabilized immobilized-enzyme method was developed for the removal of phenol in wastewater. Tyrosinase was immobilized on the PAN-based beads with glutaraldehyde as was confirmed successfully by a series of characterizations involving Fourier transform infrared spectroscopy (FTIR), scanning electron microscopy (SEM), and energy dispersive X-ray spectroscopy (EDS). The biodegradation of phenol was investigated by using the immobilized beads and compared to free tyrosinase. The optimum pH and temperature were determined to be 7.0 and 40 °C, respectively. Experiments showed that the immobilized tyrosinase was much more stable than the free tyrosinase in storage and that the immobilized tyrosinase could even retain about 78% of its original activity after repeated use 6 times in a batch system. Furthermore, the comparative in vitro cytotoxicity of phenol/treated solutions were evaluated in LO2 and HepG2 cells by using the CCK-8 assay for cell viability along with flow cytometry detection for apoptosis. The results showed that the toxicity of the phenol solutions only exerted toxicity on cells in a certain concentration range (>0.5 mM for LO2 and HepG2 cells) and that the toxicity of the phenol solutions was greatly decreased after treatment with the tyrosinase-immobilized beads. Thereby, the results confirm that we have established a suitable strategy with promising application to remove phenol economically and efficiently, which could even lower the toxicity of phenol at the cellular level.
1. Introduction
Phenolic compounds, including phenol and phenolic derivatives, are regarded as very common environmental pollutants as a consequence of their pervasive application in the manufacturing of papers, metals, resins, plastics, pesticides, and pharmaceuticals.1,2 Most phenols are highly toxic and poorly degradable substances that will probably exert carcinogenesis on humans even at low concentration.3,4 The US Environmental Protection Agency (EPA) regulations call for the discharge concentration of phenol content in the wastewater to not exceed 1 mg L−1, since this aromatic compound could cause adverse effects on the digestive system, nervous system, and respiratory system.5,6 Studies have also indicated that phenol can inhibit the growth of renal epithelial cells. Also, its mutagenic effects cannot be underestimated.7 Therefore, the removal of phenols is a crucial environmental issue and is directly related to human health.There are several conventional methods, such as activated carbon adsorption, photocatalytic degradation, solvent extraction, and ion exchange, for removing phenols from aqueous solutions.8,9 However, some of these techniques suffer from serious drawbacks, such as high cost and the production of hazardous byproducts.10 For example, the use of effective commercial activated carbons based on relatively expensive starting materials (such as wood or coal) is unjustified for most pollution control applications.11 In recent years, enzymatic biocatalysis has gradually become a green alternative to the physical and chemical treatment of phenolic wastewater. Compared to conventional methods, enzymatic treatment can offer not only operation over a wide range of pH and temperature but also a high efficacy of removal. Furthermore, the degradation process is more simple to control than conventional methods.12 To improve the activity recovery and reusability of enzymes, enzyme immobilization has been developed.13–15 Studies have shown that both of the two key factors mentioned above in immobilization as well as other important enzymatic properties, such as thermal stability and storage stability, are affected by the source of enzymes, the selection of the appropriate support and so on.16–19
The enzyme tyrosinase is a copper-containing enzyme that is widely distributed in bacteria, fruits, and vegetables.2,20 It can catalyze the conversion of phenolic substance to o-diphenols and then their oxidation to o-quinones. Also, o-quinones can undergo a non-enzymatic polymerization easily to form water-insoluble aggregates that can be removed by sedimentation or filtration.21 In contrast to dephenolization mediated by horseradish peroxidase and laccase, tyrosinase has its own advantages, including low cost and simplicity, as it uses atmospheric oxygen as an oxidant with no need for additional substances.22 According to some research reports, it has been proved to be an efficient enzyme in immobilization for removing phenol.23,24 In addition to this, the type of support affects the practical application of the immobilized enzyme.25,26
Polyacrylonitrile (PAN) has attracted much attention due to its variety of characteristics over the years.27,28 As a support, PAN-based beads can offer great advantages for enzyme immobilization. They can integrate efficient functions with the immobilized enzyme in one structure and can combine with reactive groups of the enzyme on its surface easily and tightly.29 Recently, using a mesoporous material as a support is another research orientation for researchers. Although it can greatly improve the activity of enzymes, the slack combination of PAN in immobilization can easily result in the loss of enzymes.30 In addition, the matrix surface can be facilely tailored to adjust the microenvironment of enzyme catalysis.29 As a kind of synthetic polymer, this support can offer higher strength and higher microbiological corrosion resistance than common natural polymer carriers, such as chitosan and alginate, where, for instance, the structure of wettish chitosan is easy to collapse after drying, while alginate is unstable in electrolyte solutions with a high concentration. A few methods for the immobilization of enzymes on PAN have been reported. For example, polyacrylonitrile was used as a support for the immobilization of lipase.10,31,32
Although various strategies with respect to phenol removal have been continuously mentioned and extensively discussed over the past few years, few researchers have investigated the degradation rate and cytotoxicity of phenol together. As is known, phenol is a kind of poison and shows a very clear dose–response relation;33 therefore, it is significant to define the range of toxic effects of phenol when a study involves degrading this compound. The detection of cell viability can directly be reflected at the cellular level. For the substitution of 3-(4,5-dimethyl-2-thiazolyl)-2,5-diphenyl-2H-tetrazolium bromide (MTT), the Cell Counting Kit-8 (CCK-8) assay was used to evaluate cell viability because of its high sensitivity and simplicity.34 Moreover, apoptosis is often used to further explain the reason for the inhibition of cell viability, and for this Annexin-V/PI staining is a very versatile method that us globally used for apoptosis detection.35
In the present work, we combined the advantages of a tyrosinase, polyacrylonitrile, and glutaraldehyde cross-linking method to develop a novel strategy for the degradation of phenol. The performances of enzyme-immobilized beads on phenolic compounds removal were investigated, as well as some optimal operational conditions (pH, temperature, time). Furthermore, several important enzymatic properties, such as storage stability and reusability, were evaluated. On this basis, we utilized a cytotoxicity assay and apoptosis assay to evaluate the toxicity of phenol and its intermediates in immobilization. We further explored the relationship between the degradation rate and cytotoxicity for LO2 and HepG2 cell lines. According to our results in this study, a suitable strategy with promising application to remove phenol could be established. Furthermore, as far as we know, until now, there has not been any report concerned with such a strategy.
2. Materials and methods
2.1 Materials
Tyrosinase [EC 1.14.18.1; >600 U per mg solid] and L-3,4-dihydroxyphenylalanine (L-DOPA), which was used as received, were purchased from Fuzhou Dingguo Co., (China). Polyacrylonitrile (PAN) was obtained from Heowns Biochem Technologies LLC (China). The other regents, such as phenol, N,N-dimethylformamide (DMF), sodium hydroxide (NaOH), hydrochloric acid, ethylenediamine, and glutaraldehyde, were all supplied by Aladdin Reagent co. All the chemicals were analytical grade and used without further purification. The deionized water used in the experiments was produced by Fuzhou University.2.2 Preparation of the PAN-based beads
The phase inversion technique was used to prepare the PAN-based beads. Here, 2.0 g PAN was immersed into DMF (8.0 g) solution to form a homogeneous gel after stirring at 60 °C for 4 h. Then, the obtained homogeneous solution was kept at 37 °C for 12 h to completely release any air bubbles. Utilizing a peristaltic pump, the PAN–DMF homogeneous gel turned into solid beads from the liquid phase in a glass culture dish with deionized water, where the dropping height was about 8 cm and the glass culture dish was shaken lightly to avoid the forming beads adhering with each other. The irregular spherical beads were picked up to remove them, then the rest of the beads were washed with distilled water 3–4 times. After that, the obtained PAN beads were transferred into a baker to store them for further utilization.2.3 Amine modification of the PAN-based beads
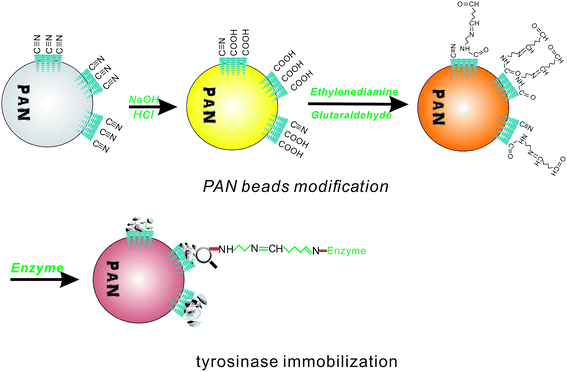
To introduce an aldehyde group to covalently bond to the amino group of the enzyme, the PAN beads were first modified to fit the conditions for aldimine condensation. The amine modification process is shown in Fig. 1, which shows that the PAN-based beads were treated with NaOH aqueous solution (10%, 50 °C, 1 h), hydrochloric acid (1 mol L−1, room temperature, 2 h), and ethylenediamine (100 mL, 10 wt%, room temperature, 1 h) in sequence.36 After this, the obtained beads turned brown from an initial white color. Then, the rest of the ethylenediamine was washed with deionized water.2.4 Glutaraldehyde activation and tyrosinase immobilization
According to the aldimine condensation, the amino group of the PAN beads could react with glutaraldehyde to formed a Schiff base, and then covalently coupled with tyrosinase. The aminated beads were transferred to a beaker containing 10 wt% glutaraldehyde, and the reaction was covered with a plastic wrap and allowed to rest at 4 °C for 1 h. After the reaction period, the residual glutaraldehyde on the surface of the activated PAN beads was washed off with deionized water.Two different pH PBS solutions were prepared for the immobilization of tyrosinase. The tyrosinase solution was prepared in a phosphate buffer (10.0 mL, 0.1 M, pH 8.0, containing 1 mg per mL protein). The beads were added into the solution and reacted for 20 h at 20 °C. After that, the tyrosinase-immobilized beads were washed thoroughly with another PBS (0.1 M, pH 7.0) solution, and this PBS solution was also used to store the immobilized tyrosinase at 20 °C. Compared to the initial PAN-based beads, the appearance of the tyrosinase-immobilized beads showed almost no change, except for the color, which became brown red.
2.5 Characterization of the beads
2.6 Assays of protein loading and tyrosinase activity
The amount of immobilized protein on the beads was determined by the Bradford method.38 The concentration of tyrosinase was calculated by the following equation:where m is the total immobilized protein on the beads (mg g−1); c1 and c2 are the initial and final concentrations of the enzyme (mg mL−1) in the immobilization medium; V is the reaction volume (mL); and W is the weight of the activated beads (g).
Tyrosinase is a copper-dependent enzyme that catalyzes two different reactions treated with pure oxygen. According to Fling,39 the enzyme activity of tyrosinase can be determined by a colorimetric assay using L-DOPA as a substrate. Briefly, before reaction, the phosphate buffer (5 mL, 0.1 M, pH 7.0) with 5 mM L-DOPA was saturated with pure oxygen for 2 min. Then, the experiment was started by adding 0.1 mL of enzyme solution containing 1.0 mg tyrosinase per mL. For the determination of immobilized-tyrosinase activity, a change of the solution color for the free and immobilized tyrosinase at 475 nm was recorded every 5 min. The intensity of the color is proportional to the concentration of the forming dopachrome from L-DOPA, whereby one unit of enzyme activity is defined as the amount of enzyme required for the generation of 1.0 μmol of dopachrome min mL−1 at 35 °C. The experiment was repeated three times.
2.7 Determination of the kinetic constants
The kinetic constants, Km, and Vmax values of the free and the immobilized tyrosinase were determined by measuring the initial rates of dopachrome formation using L-DOPA as a substrate at 35 °C. Km and Vmax values were calculated from Lineweaver–Burk plots according to the equation:where Km is the Michaelis constant, [S] is the concentration of substrate, and v and Vmax represent the initial and maximum rate of reaction. The Y-intercept in Lineweaver–Burk plots is referred to as the inverse of Vmax.
2.8 Studies on the removal of phenol
In order to investigate the optimum contact time for the degradation of phenol and the efficiency of removal, experiments were performed to measure the free/immobilized tyrosinase degradation rate from aqueous solutions. The tyrosinase-immobilized PAN beads (50 mg) were incubated in phosphate buffer (5.0 mL, 0.1 M, pH 7.0) at 35 °C and the concentration of the test phenol solutions was set as 1 mM, 3 mM, and 5 mM. Before the reaction initiation, the solutions were saturated with purging pure oxygen for 15 min. Then, the contents of each beaker were combined with the enzyme mixture and incubated for 12 h with shaking at 100 rpm. The absorbance of the solutions at 270 nm was measured by UV-vis spectrophotometer every 1.5 h and the data above was used to calculate the residual phenol concentration. To compare the efficacy of the removal, tests with the equivalent free tyrosinase was repeated in the same way for the concentration of 0.18 mg mL−1 and each sample was performed in triplicate to determine the mean value.The degradation of phenol (1 mM) at various pH conditions was studied by changing the pH from 4 to 9 at 35 °C for free tyrosinase and at 40 °C for the immobilized tyrosinase. The sample solutions with different pH were achieved by the addition of acetate buffer (5.0 mL, pH 4.0–5.0) and phosphate buffer (5.0 mL, pH 6.0–9.0).
By changing the reaction temperature from 20 °C to 50 °C, the enzymatic degradation of phenol was also accessed. The sample solutions were disposed by free/immobilized tyrosinase in phosphate buffer (pH 7.0).
2.9 Storage stability of the free and immobilized tyrosinase
To study the storage stabilities of the free and immobilized tyrosinase, the relevant enzymes were stored in phosphate buffer (0.1 M, pH 7.0) at 4 °C and the activity measurements were carried out for 60 days. Every 10 days, the residual activity of free and immobilized tyrosinase was measured. The relative activity was calculated from the ratio of residual activity to the initial activity of each sample.2.10 Reusability of the immobilized beads
The reusability of the immobilized-tyrosinase beads was determined by using the same immobilized beads to carry out the degradation experiment 8 times. The enzyme-immobilized beads were removed and washed with phosphate buffer (0.1 M, pH 7.0) in each cycle, and, before reaction initiation, the solution was fed oxygen to reach saturation for the purpose of speeding up the reaction. Then, the residual activity of the immobilized beads was measured by a UV-vis spectrophotometer. The native activity was set as 100% and the follow ups were defined as the ratio of the initial absolute activity.2.11 Cytotoxicity assay
3. Results and discussion
3.1 Characterization studies
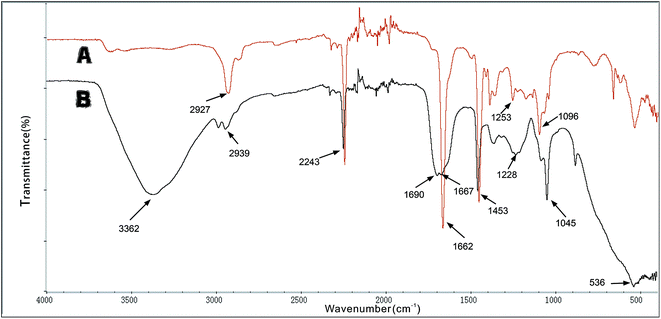
![[double bond, length as m-dash]](https://www.rsc.org/images/entities/char_e001.gif) N. This indicates that the aldehyde ammonia condensation reaction has occurred between glutaraldehyde and amine polyactylonitrile. These characteristic bands confirm that the beads were activated successfully by glutaraldehyde.
N. This indicates that the aldehyde ammonia condensation reaction has occurred between glutaraldehyde and amine polyactylonitrile. These characteristic bands confirm that the beads were activated successfully by glutaraldehyde.
3.2 Immobilization of tyrosinase onto the activated beads
The activated amino groups of the aminated PAN microbeads were achieved by the reaction with glutaraldehyde under 4 °C conditions. Then, the tyrosinase (1 mg mL−1) could be fixed to the beads with aldimine condensation. As seen in Table 1, the efficiency of protein loading and the activity performance of the tyrosinase beads were different in different immobilization times. The immobilized tyrosinase amount reached a constant (18 mg g−1 beads) at 20 h and then had little change over this time. This might suggest that the aldimine condensation reached equilibrium at 20 h and that the aldehyde groups for tyrosinase had achieved saturation.42 Furthermore, the relative activity of the immobilized enzyme was lower than that of the free enzyme, which only had 75% of the activity of the latter, corresponding to 9732 U per g beads. This phenomenon may be caused by the variation of the active center, which is attributed to the changing of the three-dimensional (3D) structure of the enzyme after immobilization.43| Immobilization time (h) | Protein loading (mg g−1) | Retained activity (%) |
|---|---|---|
| 8 | 10.3 ± 0.12 | 75.3 |
| 12 | 12.7 ± 0.16 | 73.1 |
| 16 | 15.9 ± 0.11 | 73.7 |
| 20 | 18.1 ± 0.13 | 72.9 |
| 24 | 18.1 ± 0.11 | 75.5 |
The effect of the concentration of tyrosinase on enzyme loading was also investigated at 35 °C. According to the results in Table 2, the enzyme loading reached a peak value (18.3 mg g−1) with the concentration of 1 mg mL−1. Then, when the concentration went beyond this point, it started to show a decline trend. The excessive enzyme molecules take up all of binding sites on the beads, which causes an increase in electrostatic repulsion between the tyrosinase molecules. It is supposed that this weakens the effects of the immobilization.44
| Concentration of tyrosinase (mg mL−1) | Protein loading (mg g−1) | Retained activity (%) |
|---|---|---|
| 0.7 | 12.2 ± 0.21 | 76.2 |
| 0.8 | 14.8 ± 0.18 | 75.1 |
| 0.9 | 16.9 ± 0.25 | 73.5 |
| 1.0 | 18.3 ± 0.23 | 74.3 |
| 1.1 | 17.8 ± 0.13 | 75.9 |
| 1.2 | 17.5 ± 0.09 | 72.8 |
| 1.3 | 16.7 ± 0.25 | 73.3 |
3.3 Kinetics studies
The kinetics parameters Km and Vmax were obtained from the Lineweaver–Burk plot using L-DOPA as a substrate. As shown in Table 3, the Km value of the immobilized enzyme (2.41 mM) was about 3.1 times that for the free Tyr (0.78 mM). This increase is caused by the conformational changes of the enzyme in the immobilization, which result in a lower affinity for substrate contact. Also, the lower accessibility of the substrate to the active site of the immobilized enzyme by the increased diffusion limitation also contributes to this phenomenon.45 The Vmax of tyrosinase decreased from 22.73 U per mg protein to 18.61 U per mg protein upon covalent immobilization on the beads. However, it still maintained 82% of the Vmax value of free tyrosinase, suggesting that the present immobilization system can provide efficient catalytic ability similar to that of free enzyme.| Immobilized tyrosinase | Km (mM) | Vmax (U mg−1) |
|---|---|---|
| Free enzyme | 0.78 | 22.73 |
| Immobilized enzyme | 2.41 | 18.61 |
3.4 Removal of phenol from aqueous solutions using immobilized tyrosinase
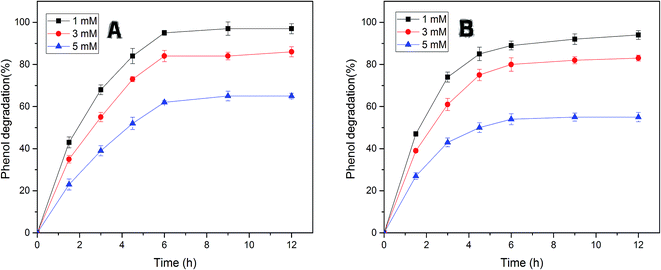
The efficiency of free and immobilized tyrosinase by contact time was tested in the removal of phenol, since tyrosinase is a well-known enzyme with the capability to degrade mono-phenols in aqueous solution. As illustrated in Fig. 5, the removal percentage of phenol by immobilized tyrosinase was nearly equal to the free one and was a little more than it with the concentration of 1 mM and 3 mM. In the two conditions, both of the two enzymes could degrade over 95% and 80% of the pollutant after 12 h, respectively. However, it is obvious that the immobilized tyrosinase could degrade more pollutants in 5 mM phenol solutions. For immobilized tyrosinase, this phenomenon suggests that the process of immobilization exerts some sort of protective effect on Tyr against the inactivation/inhibition effects. Furthermore, it is supposed that the introduction of polyacrylonitrile minimizes this inactivation.46Fig. 6A reveals the effects of pH on removing phenol with free tyrosinase (F-Tyr) and immobilized tyrosinase (I-Tyr). In the pH range of 6.0 to 8.0, both of the two enzymes showed high efficiency for the removal of phenol, and the degradation rate was almost over 80%. For immobilized and free tyrosinase, this figure reached 96% and 92%, respectively, at the optimum pH of 7.0. However, when the pH went beyond the range, the removal efficiency declined rapidly. It is considered that the influence of the pKa value of phenol helped the formation of the phenol-conjugated base, and then caused the decrease.47
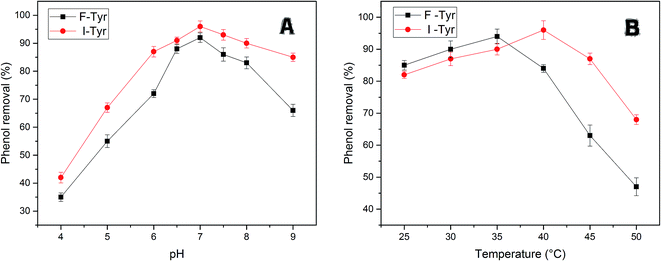 | ||
| Fig. 6 (A) The efficiency of phenol removal at various pH at 35 °C for free tyrosinase and at 40 °C for immobilized tyrosinase. (B) The efficiency of phenol removal at various temperatures at pH 7.0. | ||
The enzymatic degradation of phenol at different temperatures is illustrated in Fig. 6B. From the figure, the temperature range from 20–40 °C had little influence on the efficacy of removal, whereas it caused a huge drop in the range of 45–50 °C. The decrease in degradation rates can be due to the loss of the immobilized-enzyme activity at high temperature.48 The optimum temperature conditions for the two enzymes were different: the free tyrosinase could remove 94% percentage phenol at 35 °C, while the immobilized tyrosinase could remove 96% phenol at 40 °C. In addition, the degradation rate by immobilized enzyme decreased more slowly for the free one. For the temperatures 45 °C and 50 °C, the degradation rates were 87% and 68%, which were much more than the removal efficiency (63%, 47%) of free tyrosinase. This could be because the immobilization enhances the resistance of the enzyme to heat and further improves its capacity for phenol removal.
3.5 Storage stability of the free and immobilized tyrosinase
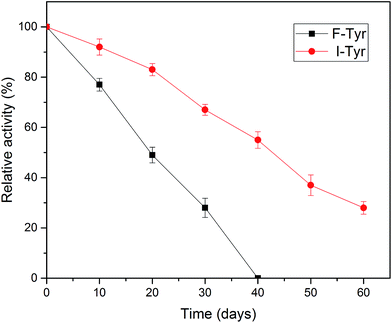
One of the most important parameters to be considered in enzyme immobilization is the storage stability. In general, the storage of enzymes in solution will make them unstable and lead to a decline in activity.48 As illustrated in Fig. 7, compared to the free tyrosinase, the activity of the immobilized tyrosinase decreased more slowly. After 40 days, the free tyrosinase lost all of its activity, whereas the immobilized tyrosinase only lost about 40% during the same period. It is obvious that the immobilization can prevent the loss of the activity of the enzyme to a great extent, which is in accord with some research in the literature.49,50 This phenomenon may be caused by two reasons: the covalent immobilization holds the enzyme in a stable position in comparison to the free counterpart;51 the modified PAN support could provide a stabilization effect, minimizing possible distortion effects imposed from the aqueous medium on the active site of the immobilized enzyme.463.6 Reusability of the tyrosinase-immobilized on PAN beads
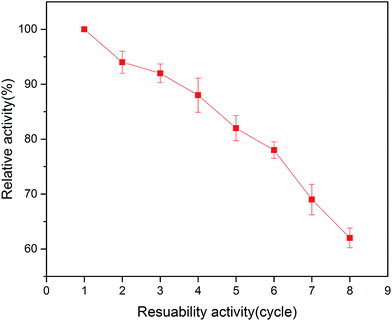
In the area of immobilized enzymes, reusability is another important property due to its advantage of reducing the cost of operation. As shown in Fig. 8, the relative activity of the immobilized enzyme in this study decreased with the increase in the number of reuses. The immobilized tyrosinase retained around 80% of its original activity after 6 times repeated use in the batch system. These results indicated that the tyrosinase-immobilized on PAN beads has good reusability, which is ideal for applications in biotechnology.3.7 Toxicity assay
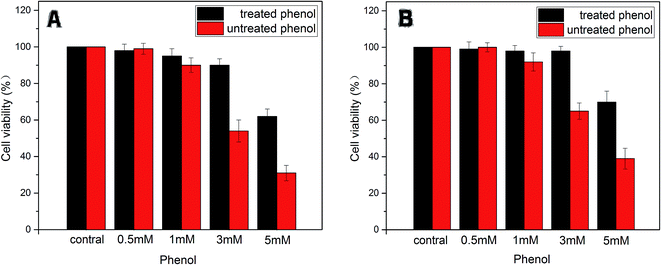 | ||
| Fig. 9 The cell viability of LO2 (A) and HepG2 (B) treated with phenol (0.5, 1, 3, 5 mM) and degradative phenol by the immobilized enzyme. | ||
In addition, on the contrary to the corresponding phenol solutions (1 mM, 3 mM, 5 mM) above, expect for the treated group of 5 mM phenol, the other groups gave much lower toxicity effects on LO2 and HepG2 cells. This phenomenon indicated that the toxicity of the treated phenol solutions was greatly reduced due to the tyrosinase-immobilized beads treatment. According to the efficacy of the removal as mentioned above, it was considered that the limitation of the catalysis ability of the enzyme caused this exception.
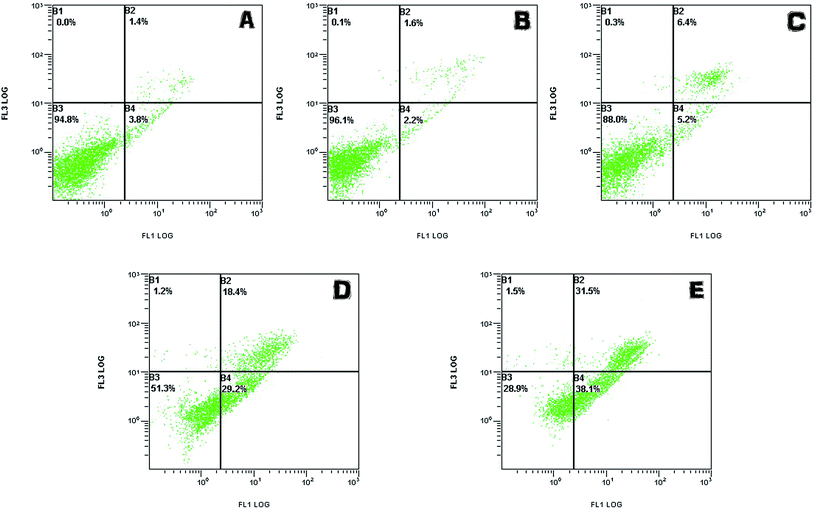
All the results suggested that phenol of a definite concentration could be removed significantly by immobilized tyrosinase and that the disposed solution had no residue of highly toxic substances. At the same time, the toxicity of the phenol solutions only exerted toxicity on the cells in a certain concentration range (>0.5 mM for LO2 and HepG2 cell lines).
4. Conclusion
In this study, tyrosinase was successfully immobilized on PAN-based beads with glutaraldehyde and was further used for degrading phenol significantly. The optimum conditions of degradation, including the effect of pH and temperature, were found to be 7.0 and 40 °C, respectively. Compared to the free enzyme, tyrosinase-PAN was proved to enhance the storage stability and could retain over 50% activity of the initial condition after being stored for 40 days. In addition, the reusability experiments showed that the immobilized beads could be used up to six cycles without a serious decrease in their relative activity, which could provide an economic advantage for large-scale biotechnological applications. The results of the CCK-8 assay and apoptosis assay confirmed that phenol is toxic to cells and that the degradation product of phenol with enzyme treatment has low toxicity. According to these assays, the concentration of treatment phenol should be kept under 0.5 mM to make sure not to inhibit the proliferation of cells. In conclusion, this study makes a contribution to expounding the cytotoxicity of phenol as well as giving potential solutions for the efficient, continuous, and safe treatment of phenolic effluents.References
- H. H. P. Fang and O. C. Chan, Water Res., 1997, 31, 2229–2242 CrossRef CAS.
- K. Ikehata and J. A. Nicell, Bioresour. Technol., 2000, 74, 191–199 CrossRef CAS.
- L. Meijer, J. Weiss, M. Van Velzen, A. Brouwer, A. Bergman and P. J. J. Sauerf, Environ. Sci. Technol., 2008, 42, 3428–3433 CrossRef CAS PubMed.
- G. Zeng, Z. Yu, Y. Chen, J. Zhang, H. Li, M. Yu and M. Zhao, Bioresour. Technol., 2011, 102, 5905–5911 CrossRef CAS PubMed.
- F. A. Banat, B. Al-Bashir, S. Al-Asheh and O. Hayajneh, Environ. Pollut., 2000, 107, 391–398 CrossRef CAS PubMed.
- Y. M. Wu, K. E. Taylor, N. Biswas and J. K. Bewtra, Enzyme Microb. Technol., 1998, 22, 315–322 CrossRef CAS.
- J. Michalowicz and W. Duda, Pol. J. Environ. Stud., 2007, 16, 347–362 CAS.
- G. S. Chuang, A. C. Chao, P. Y. Ho and H. Y. Li, Biochem. Eng. J., 2004, 21, 161–170 CrossRef CAS.
- V. A. Angelini, J. Orejas, M. I. Medina and E. Agostini, J. Hazard. Mater., 2011, 185, 269–274 CrossRef CAS PubMed.
- G. Yordanova, D. Ivanova, T. Godjevargova and A. Krastanov, Biodegradation, 2009, 20, 717–726 CrossRef CAS PubMed.
- B. H. Hameed and A. A. Rahman, J. Hazard. Mater., 2008, 160, 576–581 CrossRef CAS PubMed.
- J. Karam and J. A. Nicell, J. Chem. Technol. Biotechnol., 1997, 69, 141–153 CrossRef CAS.
- M. Y. Arica and G. Bayramoglu, J. Mol. Catal. B: Enzym., 2006, 38, 131–138 CrossRef CAS.
- G. Bayramoglu, I. Gursel, M. Yilmaz and M. Y. Arica, J. Chem. Technol. Biotechnol., 2012, 87, 530–539 CrossRef CAS.
- L. Ensuncho, M. Alvarez-Cuenca and R. L. Legge, Bioprocess Biosyst. Eng., 2005, 27, 185–191 CrossRef CAS PubMed.
- K. Hernandez and R. Fernandez-Lafuente, Enzyme Microb. Technol., 2011, 48, 107–122 CrossRef CAS PubMed.
- G. Bayramoglu, A. Akbulut and M. Y. Arica, J. Hazard. Mater., 2013, 244, 528–536 CrossRef PubMed.
- C. Garcia-Galan, A. Berenguer-Murcia, R. Fernandez-Lafuente and R. C. Rodrigues, Adv. Synth. Catal., 2011, 353, 2885–2904 CrossRef CAS.
- D. A. Cowan and R. Fernandez-Lafuente, Enzyme Microb. Technol., 2011, 49, 326–346 CrossRef CAS PubMed.
- M. Y. Arica, G. Bayramoglu and N. Bicak, Process Biochem., 2004, 39, 2007–2017 CrossRef CAS.
- G. B. Seetharam and B. A. Saville, Water Res., 2003, 37, 436–440 CrossRef CAS PubMed.
- N. Liu, G. Liang, X. Dong, X. Qi, J. Kim and Y. Piao, Chem. Eng. J., 2016, 306, 1026–1034 CrossRef CAS.
- A. Tamura, E. Satoh, A. Kashiwada, K. Matsuda and K. Yamada, J. Appl. Polym. Sci., 2010, 115, 137–145 CrossRef CAS.
- N. Loncar and Z. Vujcic, J. Hazard. Mater., 2011, 196, 73–78 CrossRef CAS PubMed.
- R. C. Rodrigues, A. Berenguer-Murcia and R. Fernandez-Lafuente, Adv. Synth. Catal., 2011, 353, 2216–2238 CrossRef CAS.
- R. Fernandez-Lafuente, Enzyme Microb. Technol., 2009, 45, 405–418 CrossRef CAS.
- D. N. Tran and K. J. Balkus, ACS Catal., 2011, 1, 956–968 CrossRef CAS.
- C. C. Fu, T. C. Hung, J. Y. Chen, C. H. Su and W. T. Wu, Bioresour. Technol., 2010, 101, 8750–8754 CrossRef CAS PubMed.
- Z.-G. Wang, L.-S. Wan and Z.-K. Xu, J. Membr. Sci., 2007, 304, 8–23 CrossRef CAS.
- Z. Hu, L. Xu and X. Wen, J. Environ. Sci., 2013, 25, 181–187 CrossRef CAS.
- S. Wang, H. Fang, Y. Wen, M. Cai, W. Liu, S. He and X. Xu, RSC Adv., 2015, 5, 57286–57292 RSC.
- S.-F. Li, Y.-H. Fan, J.-F. Hu, Y.-S. Huang and W.-T. Wu, J. Mol. Catal. B: Enzym., 2011, 73, 98–103 CrossRef CAS.
- R. M. Bruce, J. Santodonato and M. W. Neal, Toxicol. Ind. Health, 1987, 3, 535–568 CrossRef CAS PubMed.
- H. Tominaga, M. Ishiyama, F. Ohseto, K. Sasamoto, T. Hamamoto, K. Suzuki and M. Watanabe, Anal. Commun., 1999, 36, 47–50 RSC.
- S. Chen, A.-C. Cheng, M.-S. Wang and X. Peng, World J. Gastroenterol., 2008, 14, 2174–2178 CrossRef CAS PubMed.
- K. Gabrovska, T. Nedelcheva, T. Godjevargova, O. Stoilova, N. Manolova and I. Rashkov, J. Mol. Catal. B: Enzym., 2008, 55, 169–176 CrossRef CAS.
- S.-F. Li, J.-P. Chen and W.-T. Wu, J. Mol. Catal. B: Enzym., 2007, 47, 117–124 CrossRef CAS.
- M. Y. Arica and G. Bayramoglu, J. Mol. Catal. B: Enzym., 2004, 27, 255–265 CrossRef.
- M. Fling, N. H. Horowitz and S. F. Heinemann, J. Biol. Chem., 1963, 238, 2045–2053 CAS.
- X. Huang, C. Chen, Y. Shang, Y. Zhong, G. Ren, Z. Yu and J. An, Chemosphere, 2016, 161, 251–258 CrossRef CAS PubMed.
- Y. Zheng, Y. Zhang, D. Chen, H. Chen, L. Lin, C. Zheng and Y. Guo, J. Agric. Food Chem., 2016, 64, 2541–2548 CrossRef CAS PubMed.
- O. Barbosa, R. Torres, C. Ortiz and R. Fernandez-Lafuente, Process Biochem., 2012, 47, 1220–1227 CrossRef CAS.
- P. Ye, Z. K. Xu, J. Wu, C. Innocent and P. Seta, Macromolecules, 2006, 39, 1041–1045 CrossRef CAS.
- J. Cheng, S. M. Yu and P. Zuo, Water Res., 2006, 40, 283–290 CrossRef CAS PubMed.
- M. Royvaran, A. Taheri-Kafrani, A. L. Isfahani and S. Mohammadi, Chem. Eng. J., 2016, 288, 414–422 CrossRef CAS.
- J. L. Gomez, A. Bodalo, E. Gomez, J. Bastida, A. M. Hidalgo and M. Gomez, Enzyme Microb. Technol., 2006, 39, 1016–1022 CrossRef CAS.
- M. A. Duarte-Vazquez, M. A. Ortega-Tovar, B. E. Garcia-Almendarez and C. Regalado, J. Chem. Technol. Biotechnol., 2003, 78, 42–47 CrossRef CAS.
- G. Bayramoglu and M. Y. Arica, J. Hazard. Mater., 2008, 156, 148–155 CrossRef CAS PubMed.
- G. Bayramoglu, B. Altintas, M. Yilmaz and M. Y. Arica, Bioresour. Technol., 2011, 102, 475–482 CrossRef CAS PubMed.
- C. Nicolucci, S. Rossi, C. Menale, T. Godjevargova, Y. Ivanov, M. Bianco, L. Mita, U. Bencivenga, D. G. Mita and N. Diano, Biodegradation, 2011, 22, 673–683 CrossRef CAS PubMed.
- S. Canofeni, S. Disario, J. Mela and R. Pilloton, Anal. Lett., 1994, 27, 1659–1669 CrossRef CAS.
- M. A. Malvindi, V. De Matteis, A. Galeone, V. Brunetti, G. C. Anyfantis, A. Athanassiou, R. Cingolani and P. P. Pompa, PLoS One, 2014, 9, e85835 Search PubMed.
- N. Singh, G. J. S. Jenkins, R. Asadi and S. H. Doak, Nano Rev., 2010, 1, 5358 CrossRef PubMed.
| This journal is © The Royal Society of Chemistry 2017 |

