 Open Access Article
Adsorption properties of NO molecules on the hexagonal LaCoO3 (0 0 1) surface: a density functional theory study†
Zhijie Liu,
Yanxin Wang and
Hongwei Gao *
*
Key Laboratory of Plant Resources, Chemistry in Arid Regions, Xinjiang Technical Institute of Physics and Chemistry, Chinese Academy of Sciences, Urumqi 830011, China. E-mail: gaohongw369@ms.xjb.ac.cn; Fax: +86-991-3858319; Tel: +86-991-3858319
First published on 11th July 2017
Abstract
Six types of adsorption configurations, together with two different adsorption sites for NO adsorption on LaCoO3, were investigated via density functional theory. There were two types of terminal configurations for the LaCoO3 (0 0 1) surface: CoO2- and LaO-terminated. We used the calculated adsorption energy, Mulliken and Hirshfeld charge analysis, the electron density difference and projected density of states analysis methods to determine the electronic and chemical properties of NO adsorbed on LaCoO3. We found that the Co-d and N-p orbitals played primary roles during electron transfer for NO adsorption on CoO2-terminated LaCoO3, and the O-p and N-p orbitals during the electron transfer for NO adsorption on LaO-terminated LaCoO3. Therefore, we assert that the optimal adsorption configuration is Co–NO (N-end of NO on adsorption CoO2–LaCoO3).
1. Introduction
With the rapid development of the science and technology of materials research, perovskites have received extensive attention1 for their unique properties, such as stable structure,2 electromagnetic characteristics,3 thermal stability,4 moderate price, widespread sources and gas sensitivity. In addition to the worsening environmental problems,5–12 the air pollution due to particles is of concern.13 Perovskites are sensitive to gas and act as gas sensing materials14–16 that can adsorb and detect a very large number of poisonous gases, e.g., CO, NOx, SO2 and VOCs.17 These gases have received a wave of attention from research communities studying environmental catalytic materials,18 and it can be seen that there is a lot of work to be done regarding the research on materials for environmental protection.Studies have approved perovskites as catalytic materials for gas sensors19,20 or locomotive tail gas processors to detect and adsorb the various harmful gases. Nunzio Russo et al. have expounded that the Li-substituted chromite catalyst, whose chemical formula is La0.8Cr0.9Li0.1O3, an alkali-metal-substituted perovskite compound, exhibits the highest activity in adsorbing poisonous gases, and they found that the catalyst had a great amount of weakly chemisorbed O− species that played key roles in the soot oxidation state.21 Y. Teraoka et al. also revealed that the La–K–Mn–O perovskites showed activity in getting rid of NOx and soot, and thought that the potassium content was crucial since the activity of the catalyst varied with potassium content.22 The nano-structured PrCrO3 on CeO2 was prefabricated by Debora Fino and Vito Specchia et al., who used the combustion synthesis technique, and then they adopted typical engine vibrations to test the catalytic activity.23 All of the above cases involved research into the treatment of the exhaust gases by perovskites; however, the research on gas sensitive materials is also quite extensive. Changmin Shi et al. used density functional theory (DFT) to investigate LaMnO3, which can be used to detect CO, and calculate the adsorption energy for the CO molecule adsorption on LaMnO3.24 Yongjia Zhang et al. also used DFT to study SrFeO3, but they selected the NO molecule to study the probable potential.25 LaCoO3 is a classical compound that has been widely studied and applied in various fields. Lihui Sun et al. used LaCoO3 as the gas sensing material for detecting the CO molecule.26 Beatriz Rivas-Murias et al. developed ferromagnetic insulating barriers of LaCoO3 for devising spin-filtering tunnels in spintronic applications, according to the magnetic properties of LaCoO3.27
NO gas has been, in recent years, recognized as a detriment to the atmospheric environment. In this study, we investigate the properties of LaCoO3 as a catalytic agent for wiping out NO. Studying the electronic structures of the adsorption configurations can provide theoretical guidance for relevant experimental research.
2. Theoretical methods and computational details
The system of NO adsorption on the LaCoO3 surface was investigated by the density functional theory (DFT) using the CASTEP28–33 package of Materials Studio (MS) 8.0. We did some optimization tests for the sake of determining the best optimized structure of the compound. We chose 14 types of orbital cutoff values (300, 350, 400, 450, 500, 550, 600, 650, 700, 750, 800, 850, 900 and 950 eV) in computer simulation, which are shown in Fig. S1 in the ESI† and tried to figure out the most suitable energy cutoff value. Fig. S1† shows that the orbital cutoff value of 600 eV is the best value. Based on this, the K-points were tested and the data are marked in Fig. S2.† Furthermore, in the process of geometry optimization, the functions were optimized under the LDA and GGA approximations to determine the best one. For these tests, we identified the orbital cutoff value as 600, K-points as 2 × 2 × 2, and the function as GGA with the PBEsol method to calculate the exchange and correlation energy. The constringency standards of optimal geometry, with respect to the maximum force, energy and maximum displacement, were 0.05 eV Å−1, 2.0 × 10⁻⁵ eV per atom and 0.002 Å, respectively, with ultrasoft pseudopotentials.34,35 The dipole correction was used to deal with the electric field gradients in three-dimensional periodic supercells, which can affect electronic densities and binding energies.In order to simulate the adsorption behavior of NO, the periodic supercell of 2 × 2 × 1 was constructed. This supercell for the CoO2-terminated surface of LaCoO3 (0 0 1) contains 120 atoms, and 180 atoms for the LaO-terminated surface. Based on the literature, the length of the N–O bond was set as lN–O = 1.17 Å.36 In our study, a NO molecule was attracted to the LaCoO3 surface and the adsorption energy Ead was defined as follows:
| Eads = Etotal − (ELaCoO3 + ENO) | (1) |
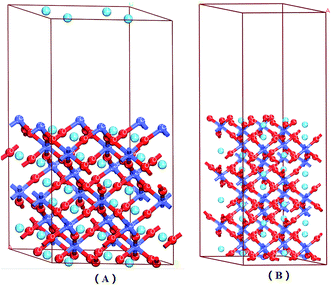 | ||
| Fig. 1 LaCoO3 (0 0 1) CoO2-terminated surface (A) and LaO-terminated surface (B) blue balls represent Co atoms, wathet balls represent La atoms and red balls represent O atoms. | ||
3. Results and discussion
3.1 Select functional, test orbital cutoff and K-points
LDA and GGA are two types of general exchange-correlation energy approximation methods used during the process of geometry optimization. The structural optimization of LaCoO3 using the 2 × 2 × 1 supercell was conducted by CA-PZ under LDA, and PW91, PBE, WC, RPBE, PBEsol under GGA. The specific computational conditions are shown in Table 1.| Lattice parameters (a) | Relative deviation (%) | Co–O (Å) | Relative deviation (%) | ||
|---|---|---|---|---|---|
| a Experimental values are from ref. 39 and 40. | |||||
| LDA | CA-PZ | 5.446 | −0.001 | 1.925 | −0.001 |
| GGA | PBE | 5.581 | 0.025 | 1.976 | 0.024 |
| RPBE | 5.633 | 0.035 | 1.998 | 0.036 | |
| PW91 | 5.577 | 0.024 | 1.975 | 0.024 | |
| WC | 5.511 | 0.012 | 1.949 | 0.010 | |
| PBEsol | 5.505 | 0.011 | 1.947 | 0.009 | |
| Exp.a | 5.444 | 1.929 | |||
By comparing the obtained results with experimental values, we found that LDA approximation methods were more applicable for calculating bonds lengths39 and lattice parameters.40 The Co–O bond length was 1.925 Å and the lattice parameter was 5.446 Å as calculated by CA-PZ, which approached the experimental values (1.929 Å and 5.444 Å); however the electron distributions were strongly restricted by LDA approximation, and the absolute value of the forbidden band width and the system binding energy were not suitable for analysis by LDA. Generally, the metal band gap calculated by GGA was closer to the experimental value than that calculated by LDA.
Relative deviations (%) of the optimized crystal parameters for hexagonal LaCoO3 were as follows: −0.001 (LDA/CA-PZ), 0.025 (LDA/PBE), 0.35 (LDA/RPBE), 0.024 (GGA/PW91), 0.012 (GGA/WC), 0.011 (GGA/PBEsol); furthermore, the relative deviations (%) of the Co–O bond length for hexagonal LaCoO3 were −0.001 (LDA/CA-PZ), 0.024 (LDA/PBE), 0.36 (LDA/RPBE), 0.024 (GGA/PW91), 0.010 (GGA/WC), 0.009 (GGA/PBEsol).
Taking the experimental values of the lattice constant and energy band gap into consideration, we chose the GGA approximation PBEsol functional to execute the subsequent study.
There were two evident variation trends in Fig. S1:† when the cutoff energy ranged from 300 eV to 350 eV, the curve declined; when the cutoff energy ranged from 350 eV to 450 eV, the curve remained flat. However, there was a significant decline between 450 eV and 600 eV; hence, 350 eV was not the best choice. After 600 eV, there was a more stable trend in the image, making it clear that it converged very well in the structure optimization; therefore, we chose 600 eV as the value of orbital cutoff energy. Fig. S2† clearly shows that it reached convergence for the K-points test using the GGA-PBEsol approximation when the value of the cutoff energy was 600 eV. It is clear that when the K-points value was 2 × 2 × 2, the image became smooth and did not change much; therefore, we chose 2 × 2 × 2 as the K-points value.
3.2 LaO-terminated and CoO2-terminated LaCoO3 (0 0 1) surfaces
Fig. 1 shows that the LaO and CoO2-terminated LaCoO3 (0 0 1) surfaces have been adequately relaxed. We used the above functions and parameters to optimize them, and we could find no drastic change for the LaCoO3 (0 0 1) surface. The O atoms moved downward while the Co atoms moved upward on the CoO2-terminated LaCoO3 (0 0 1) surface, which is in agreement with Sun's results.41 During this process, we checked the length of the Co–O bond for the CoO2-terminated LaCoO3 (0 0 1) surface. The length of the Co–O bond was always 1.937 Å in every layer, which revealed that relaxation did not occur in this structure. This result is consistent with the slight relaxation phenomenon mentioned by Sun.41 Nevertheless, we found that the La atoms moved downward and the O atoms shifted upward for the LaO-terminated LaCoO3 (0 0 1) surface. The length of the Co–O bond increased from 1.947 Å to 1.953 Å. This phenomenon showed that relaxation occurred in this structure.3.3 NO adsorption on LaCoO3
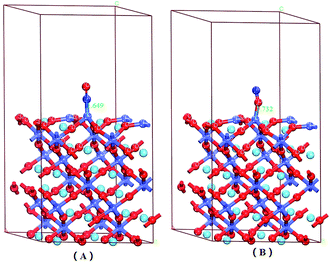
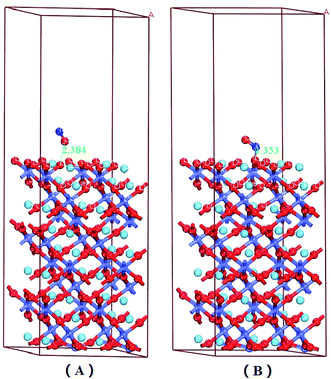
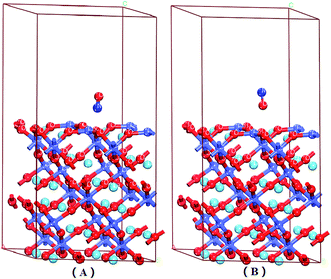
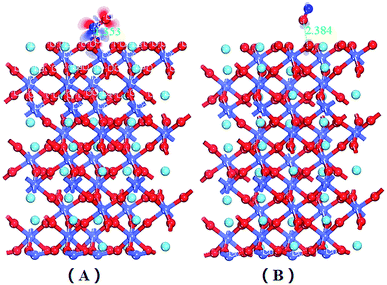
There were six adsorption configurations to choose from. When NO was adsorbed on different surfaces, including the CoO2-terminated and LaO-terminated LaCoO3 (0 0 1) surfaces, all possible sites were investigated and only six configurations were suitable, which are listed in Fig. 2–4. We focused on adsorbing NO on the top site and bridge site of CoO2-terminated and LaO-terminated LaCoO3 (0 0 1) surfaces.A. Adsorption energy. First, the clean CoO2-terminated LaCoO3 (0 0 1) surface was fully optimized. Then, we put NO on the support and optimized this adsorption structure. In order to understand the optimal adsorption site of the NO molecules adsorbed on the CoO2-terminated LaCoO3 (0 0 1) surface, we considered several different adsorption configurations. However, we found that only four types of adsorption configurations were not repetitive structures after optimization, shown in Fig. 2 and 4. As shown in Fig. 2(A), the N atom of the NO molecule is close to the Co site (NO N-end CoO2–LaCoO3). In Fig. 2(B), the O atom of the NO molecule is close to the Co site (NO O-end CoO2–LaCoO3). The above two adsorption sites belong to the top site. As shown in Fig. 4(A), the N atom of the NO molecule is close to three O atoms of the CoO2-terminated surface (NO N-end CoO2–LaCoO3 bridge), in which the location of these three O atoms is very unusual and they make the surface look like a hole. These O atoms are all connected to the same Co atom and they are also connected to three other Co atoms. In Fig. 4(B), the O atom of the NO molecule is close to the O atoms of the CoO2-terminated surface (NO O-end CoO2–LaCoO3 bridge); these two adsorption sites belong to the bridge site.
Adsorption energies of all configurations were calculated on the basis of eqn (1); it can be clearly seen from Table 2 that all the values of adsorption energy were negative, implying that the adsorption structures were stable, and the adsorption processes were exothermic. At the top site (Co–NO and Co–ON), the values of the adsorption energies were −3.59 and −2.165 eV, respectively, and the values of the corresponding bond lengths were 1.649 and 1.732 Å, respectively. At the bridge sites (NO N-end and NO O-end of the CoO2–LaCoO3 bridge), the adsorption energies were −1.152 and −1.406 eV, respectively, and the corresponding bond lengths were 2.307 and 2.725 Å, respectively.
| NO N-end CoO–LaCoO3 | NO O-end CoO–LaCoO3 | NO N-end CoO–LaCoO3 bridge | NO O-end CoO–LaCoO3 bridge | NO N-end LaO–LaCoO3 | NO O-end LaO–LaCoO3 | |
|---|---|---|---|---|---|---|
| E ads (eV) | −3.59 | −2.165 | −1.152 | −1.406 | −3.213 | −1.827 |
| d MO-TM (Å) | 1.649 | 1.732 | 2.307 | 2.725 | 1.353 | 2.384 |
| Q OMulliken (e) | −0.220 | −0.260 | −0.140 | −0.100 | −0.270 | −0.090 |
| Q NMulliken (e) | −0.110 | −0.020 | 0.140 | 0.090 | 0.160 | 0.120 |
| Q O+NMulliken (e) | −0.330 | −0.280 | 0.000 | −0.010 | −0.110 | 0.030 |
| Q OHirshfeld (e) | −0.160 | −0.020 | −0.060 | 0.000 | −0.140 | 0.050 |
| Q NHirshfeld (e) | −0.020 | −0.090 | 0.100 | 0.000 | 0.120 | 0.050 |
| Q O+NHirshfeld (e) | −0.180 | −0.110 | 0.040 | 0.000 | −0.020 | 0.100 |
Based on the above description, we will discuss the four adsorption configurations in this study. Since we will focus on discussing the NO reaction on the LaCoO3 surface in another report, we will not consider the other factors. The Co atom formed a chemical bond with the NO molecule on the top site. Shi42 pointed out that when CO was adsorbed on LaMnO3, forming the covalent bond, the C–O bond length of the adsorbed CO molecule would be greater than that of the free CO molecule, which is in accordance with our calculated results. As mentioned above, the adsorption energy at the top site is relatively large and the values are within the range of chemisorption energy. However, the adsorption energy of the bridge site is much smaller than that of the top site and we found that NO molecules adsorbed on LaCoO3 formed covalent bond interactions; therefore, we considered that NO molecules adsorbed on the bridge site were not stable chemisorptions. The most outstanding state configuration was the Co–NO configuration. The NO molecule is inclined to be adsorbed on the CoO2-terminated LaCoO3 (0 0 1) surface, and the results are consistent with the literature, in which Sun43 obtained the most favorable adsorption structure with the Fe–NO configuration (the N atom of NO molecule connected to the Fe site). Zhang44 figured out in the adsorption of NO on the TiO2-terminated SrTiO3 (0 0 1) that the N atom of the NO molecule was downward, which was more beneficial for adsorption. Yongjia Zhang45 reported that the optimal configuration was the Fe–NO structure for the FeO-terminated SrTiO3 (0 0 1) surface adsorbed NO. This indicated that the B element in the ABO3 perovskite was the key element for adsorbing gases, based on the above conclusions.
B. Mulliken charge and hirshfeld charge analysis. In order to present detailed results, we calculated the Mulliken charge and Hirshfeld charge for NO adsorption on the CoO2-terminated LaCoO3 (0 0 1) surface in Table 2. After NO molecules were adsorbed on the CoO2-terminated LaCoO3 (0 0 1) surface, the equilibrium of the initial charge distribution was destroyed.
Table 2 shows whether the Mulliken charges of the O atoms of NO were negative for NO adsorption at the top site or bridge site on the CoO2-terminated LaCoO3 (0 0 1) surface. The Mulliken charge of the N atoms of NO was negative on the top site; however, the charge of N atoms on the bridge site was positive. The total charge of O and N atoms (QO+NMulliken (e)) was also negative on the top site. The phenomenon indicated that the Mulliken charge was transferred from LaCoO3 to NO on the top site. LaCoO3 acts as a contributor and NO acts as an acceptor. There was a very interesting phenomenon in which the Mulliken charge was transferred from the N atom to the O atom in the NO molecule, for NO adsorption on the CoO2-terminated LaCoO3 (0 0 1) surface and downward N atom. The bridge site O atom of downward NO displayed the total Mulliken transferred charge of −0.010e, in which the O atom of NO accepted −0.100e and the N atom lost 0.090e, suggesting that the catalyst probably offered some charge.
For the Hirshfeld charge, the regular pattern of charge transition was similar to that of the Mulliken charge. Both methods gave the important conclusion that NO acts as acceptor for the electrons on the top site because the N atom and O atom of the NO molecule could form stable chemical bonds with the surface Co atom in the CoO2-terminated LaCoO3 (0 0 1). On the other hand, the stable chemical bond did not form at the bridge site, the changes of the values were extremely small, and the electron transfer occurred with NO.
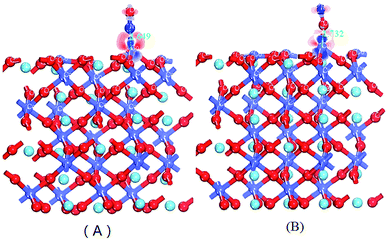
C. The electron density difference analysis. After the adsorption of NO on LaCoO3, the charge on LaCoO3 was equably distributed in the chemical bond, instead of collecting on a certain atom, revealing a strong covalent bond. In order to be more straightforward in explaining the impact of the charge density for NO adsorption on LaCoO3, we have calculated and drawn the electron density difference for NO adsorption on CoO2-terminated LaCoO3 (0 0 1), as shown in Fig. 5. We defined the electron density difference (Δρ) as follows:
| Δρ = ρNO–LaCoO3 − ρLaCoO3 − ρNO | (2) |
As can be seen from Fig. 5(A), the pronounced charge accumulation occurs on the bond between the N atom of NO and Co atom of CoO2-terminated LaCoO3, indicating that a large electronic accumulation was the key factor for bonding, and the formative chemical bond was very strong. However, Fig. 5(B) shows a similar phenomenon in comparison to Fig. 5(A), between the O atom of NO and the Co atom of CoO2-terminated LaCoO3, which also forms a stable chemical bond; however, the accumulated charge in Fig. 5(A) is more abundant than that in Fig. 5(B), suggesting that the formative chemical bond for the Co–NO configuration is more stable than that for the Co–ON configuration. This result proves that the adsorption energy of the Co–NO configuration is larger, compared to the Co–ON configuration. Both the O atom and N atom of the NO molecule obtained electrons for NO adsorption on the CoO2-terminated LaCoO3, and these results agree well with those mentioned above in the Mulliken and Hirshfeld charge analysis.
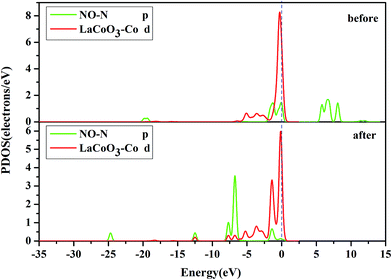
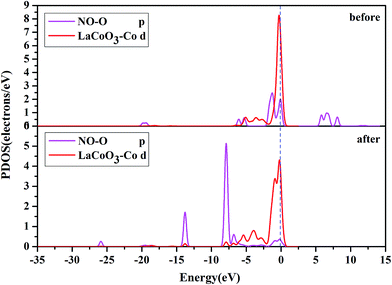
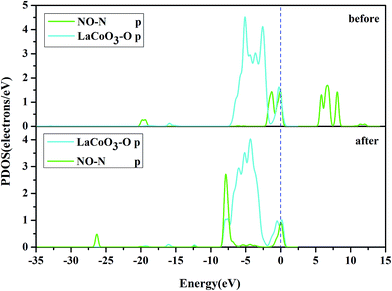
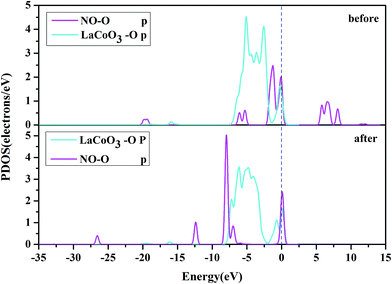
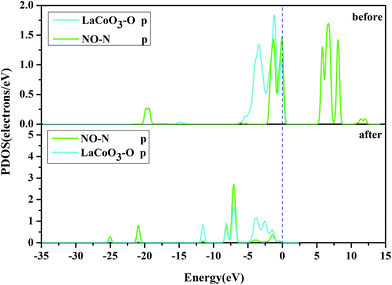
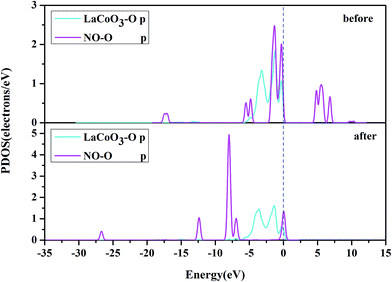
D. Projected density of states (PDOS) analysis. To obtain a further insight into the contributions of the Co, N and O atoms, we investigated the PDOS for NO adsorption on the CoO2-terminated LaCoO3 (0 0 1) surface, as shown in Fig. 7–10.
Fig. 10 shows the PDOS, including the N-p orbital of NO and the O-p orbital of LaCoO3, and NO before and after adsorption. There was an evident change in the O-p PDOS near the Fermi level, and the overlapping peaks after adsorption were significantly increased, compared to those before adsorption, indicating that the electrons were transferred from LaCoO3 to NO and there was a certain interaction between NO and the surface. It is evident from Fig. 9 that the PDOS of the O-p orbital of LaCoO3 before and after adsorption had scarcely any change. However, the PDOS of the N-p orbital of NO had some change, suggesting that there was no stronger bonding interaction between NO and LaCoO3. Both of the above results were consistent with the Mulliken charge and Hirshfeld charge analysis. We can conclude that less transferred charges meant weaker interactions between NO and the surface.
Fig. 8 shows that the O-p PDOS of NO adsorbed at the CoO2-terminated LaCoO3 significantly changed, and the bands shifted downward near the Fermi level after adsorption, suggesting that the NO molecule had a strong reaction with the LaCoO3 surface. This result also agrees well with Mulliken charge, Hirshfeld charge analysis and the electron density difference analysis, where a large number of electrons gathered around Co–O and increased the overlap density of the electron cloud. Compared to the before adsorption, the after adsorption had a notable change. From the PDOS of N and Co for NO adsorption on the CoO2-terminated LaCoO3 (see Fig. 7 after), it is clear that the Co-d states offered tremendous contributions to bands in the scope of about −5 eV to 0 eV, with a negligible component of the N-p states. Because the surface lost a lot of electrons, and electrons were transferred to NO, the Co–N bond was formed. A strong overlap of Co-d and N-p states in the range of about −8 eV to 1 eV denoted the appearance of some hybridization between the d orbital of Co and the p orbital of N, indicating that an intense reaction occurred between the adsorbed NO and the Co of the surface. These results were also consistent with Mulliken charge analysis, Hirshfeld charge analysis and the electron density difference analysis. Therefore, we claim that the p orbitals of NO and the d orbitals of Co are the critical factors leading to bonding with adsorbed NO.
From the Mulliken charge and Hirshfeld charge analysis of O–NO and O–ON configurations (see Table 2), it was clear that the charges of the O atoms of NO were negative, the charges of the N atoms were 0.160e, 0.120e, 0.120e and 0.05e, respectively, and the charges of N atoms were positive for NO (N downward or O–NO) adsorption on the LaO-terminated surface. The total charges (Mulliken and Hirshfeld charges) of N and O atoms (QO+N) were negative for the N-end of NO adsorption on the LaO-terminated surface, while they were positive for the O-end of NO on the LaO-terminated surface. These results revealed that the O atom gained electrons, the N atom lost electrons, and the NO (N-end) acted as an acceptor, due to the NO (N-end) forming stable chemical bonds with the surface for the N-end of NO adsorption on the LaO-terminated surface. Nevertheless, for the O-end of NO adsorption on the LaO-terminated surface, the NO (O-end) acted as a charge donor, forming bonds with the surface. The calculated adsorption energy for the N-end of NO adsorption on the LaO-terminated surface was −3.213 eV, which is much larger than that of the O-end of NO adsorbed on the LaO-terminated surface because the O–NO could form bonds and the O–ON could not form bonds.
Fig. 6 shows the electron density difference for NO adsorption on the LaO-terminated surface. It was unmistakable that the charges accumulated between O and NO (Fig. 6A), in which the blue indicated losing electrons and the red indicated obtaining charges. From different electron density maps, we noticed that the result of the population analysis was relative to the electron density, which proved that our calculation was reasonable.
To ascertain the particular atomic orbital in the charge transfer during NO adsorption on the LaO-terminated surface, we investigated the PDOS of N and O, which are shown in Fig. 11 and 12, respectively, in the ESI.† By comparison of the PDOS before and after adsorption, it was evident that the peaks of the held states shifted to lower energy for NO adsorption on the LaO-terminated surface. A strong overlap of N-p and O-p states from −8 eV to 0 eV signified that there was some hybridization between the p states of O and p states of N. This result is in good agreement with Mulliken charge, Hirshfeld charge and the electron density difference. We also considered that the p orbitals of N and O played an important role in explaining the bonding mechanism.
4. Conclusions
In conclusion, we have conducted an overall inquiry into the adsorption properties of the NO molecule on the LaCoO3 surface with different adsorption configurations and sites. Analysis of the adsorption energy, Mulliken charge and Hirshfeld charge analysis, electron density difference and projected density of states revealed the primary role of the Co-d orbital and N-p orbital during the electron transfer for NO adsorption on the CoO2-terminated LaCoO3 and the pivotal role of the O-p orbital and N-p orbital during the electron transfer for NO adsorption on LaO-terminated LaCoO3. All results reflected the fact that NO was adsorbed on the LaCoO3 surface to form bonds such as Co–O, Co–N and O–N. I. Twagirashema et al.46 and M. Pirez-Engelmann et al.47 used the experimental method and also observed that LaCoO3 removal of NO has a good effect.Our calculations elucidated the predominant role of LaCoO3 in adsorbing NO exhaust gas. If we allow the CoO2-terminated LaCoO3 to act as the adsorption surface, the absorption efficiency is better. These results provide theoretical support for studying the reaction of NO and exhaust gas on LaCoO3, as well as excellent guidance for NO exhaust gas treatment.
Acknowledgements
This study was supported by the Natural Science Foundation of Xinjiang, China, Grant No. 2016D01A073. This study was also financially supported by the Recruitment Program of Global Experts, and the Director Foundation of XTIPC, CAS, Grant No. 2015RC011.References
- Z. X. Xiong, G. L. Ji and X. Fang, J. Mater. Sci. Eng. B, 2003, 99, 541–548 CrossRef.
- C. Artini, M. Pani, A. Lausi and G. A. Costa, J. Phys. Chem. Solids, 2016, 91, 93–100 CrossRef.
- W. Zhou, H. Deng, L. Yu, P. Yang and J. Chu, Ceram. Int., 2015, 41, 13389–13392 CrossRef.
- C.-M. Fang and R. Ahuja, Phys. Earth Planet. Inter., 2006, 157, 1–7 CrossRef.
- S. D. Handoko, H. C. Lau and S. F. Cheng, IEEE Trans. Autom. Sci. Eng., 2016, 13, 1471–1479 Search PubMed.
- J. Wu, W. Liu and C. Chen, J. Appl. Ecol., 2016, 53, 1787–1799 CrossRef.
- G. Gozgor and M. Can, Environ. Sci. Pollut. Res., 2016, 23, 21594–21603 CrossRef PubMed.
- F.-Y. Zheng, T.-X. Tu, F.-J. Liu, X.-G. Huang and S.-X. Li, Aquat. Toxicol., 2016, 181, 11–21 CrossRef PubMed.
- X. Pang, Y. Guo, Y. Zhang, B. Xu and F. Qi, Chem. Eng. J., 2016, 304, 897–907 CrossRef.
- X. Lin and D. Wang, J. Geogr. Sci., 2016, 26, 1533–1549 CrossRef.
- J. K. H. Chan, Landsc. Urban Plan., 2016, 154, 123–131 CrossRef.
- F. Pellicer-Martínez and J. M. Martínez-Paz, Sci. Total Environ., 2016, 571, 561–574 CrossRef PubMed.
- M. D. Adams, N. Yiannakoulias and P. S. Kanaroglou, Atmos. Environ., 2016, 140, 52–59 CrossRef.
- A. M. Schultz, T. D. Brown and P. R. Ohodnicki, Proc. SPIE, 2015, 9545, 95450I CrossRef.
- P.-X. Gao, P. Shimpi, W. Cai, H. Gao, D. Jian and G. Wrobel, Proc. SPIE, 2011, 7940, 79401A CrossRef.
- S. Misra, S. M. Bose and S. K. Tripathy, AIP Conf. Proc., 2012, 1461, 379–382 CrossRef.
- O. G. Fawole, X.-M. Cai and A. R. MacKenzie, Environ. Pollut., 2016, 216, 182–197 CrossRef PubMed.
- N. Labhasetwar, G. Saravanan, S. K. Megarajan, N. Manwar, R. Khobragade, P. Doggali and F. Grasset, Sci. Technol. Adv. Mater., 2015, 16, 036002 CrossRef PubMed.
- T. V. Choudhary, S. Banerjee and V. R. Choudhary, Appl. Catal. Gen., 2002, 234, 1–23 CrossRef.
- A. Civera, M. Pavese, G. Saracco and V. Specchia, Catal. Today, 2003, 83, 199–211 CrossRef.
- N. Russo, D. Fino, G. Saracco and V. Specchia, J. Catal., 2005, 229, 459–469 CrossRef.
- Y. Teraoka, K. Kanada and S. Kagawa, Appl. Catal., B, 2001, 34, 73–78 CrossRef.
- D. Fino and V. Specchia, Chem. Eng. Sci., 2004, 59, 4825–4831 CrossRef.
- C. Shi, L. Sun, H. Qin, X. Wang, L. Li and J. Hu, Comput. Mater. Sci., 2015, 98, 83–87 CrossRef.
- Y. Zhang, E. Cao, L. Sun and J. Hu, Comput. Mater. Sci., 2015, 102, 135–139 CrossRef.
- L. Sun, G. Li, W. Chen and J. Hu, Comput. Mater. Sci., 2016, 115, 154–157 CrossRef.
- B. Rivas-Murias, I. Lucas, P. Jiménez-Cavero, C. Magén, L. Morellón and F. Rivadulla, Nano Lett., 2016, 16, 1736–1740 CrossRef PubMed.
- P. Hohenberg and W. Kohn, Phys. Rev., 1964, 136, B864–B871 CrossRef.
- W. Kohn and L. J. Sham, Phys. Rev., 1965, 140, A1133–A1138 CrossRef.
- G. P. Francis and M. C. Payne, J. Phys.: Condens. Matter, 1990, 2, 4395 CrossRef.
- M. C. Payne, M. P. Teter, D. C. Allan, T. A. Arias and J. D. Joannopoulos, Rev. Mod. Phys., 1992, 64, 1045–1097 CrossRef.
- S. J. Clark, M. D. Segall, C. J. Pickard, P. J. Hasnip, M. I. J. Probert, K. Refson and M. C. Payne, Z. Kristallogr. – Cryst. Mater., 2009, 220, 567–570 Search PubMed.
- B. G. Pfrommer, M. Côté, S. G. Louie and M. L. Cohen, J. Comput. Phys., 1997, 131, 233–240 CrossRef.
- D. Vanderbilt, Phys. Rev. B, 1990, 41, 7892–7895 CrossRef.
- M. C. Payne, M. P. Teter, D. C. Allan, T. A. Arias and J. D. Joannopoulos, Rev. Mod. Phys., 1992, 64, 1045–1097 CrossRef.
- M. P. Jigato, K. Somasundram, V. Termath, N. C. Handy and D. A. King, Surf. Sci., 1997, 380, 83–90 CrossRef.
- Y.-L. Lee, J. Kleis, J. Rossmeisl and D. Morgan, Phys. Rev. B, 2009, 80, 224101 CrossRef.
- C.-W. Lee, R. K. Behera, E. D. Wachsman, S. R. Phillpot and S. B. Sinnott, Phys. Rev. B, 2011, 83, 115418 CrossRef.
- V. Narasimhan, H. V. Keer and D. K. Chakrabarty, Phys. Status Solidi A, 1985, 89, 65–71 CrossRef.
- C.-L. Ma and J. Cang, Solid State Commun., 2010, 150, 1983–1986 CrossRef.
- L. Sun, G. Li, W. Chen, F. Luo, J. Hu and H. Qin, Appl. Surf. Sci., 2014, 309, 128–132 CrossRef.
- C. Shi, L. Sun, H. Qin, X. Wang, L. Li and J. Hu, Comput. Mater. Sci., 2015, 98, 83–87 CrossRef.
- L. Sun, J. Hu, F. Gao, Y. Zhang and H. Qin, Phys. B, 2011, 406, 4105–4108 CrossRef.
- H. J. Zhang, G. Chen and Z. H. Li, Appl. Surf. Sci., 2007, 253, 8345–8351 CrossRef.
- Y. Zhang, E. Cao, L. Sun and J. Hu, Comput. Mater. Sci., 2015, 102, 135–139 CrossRef.
- I. Twagirashema, M. Frere, L. Gengembre, C. Dujardin and P. Granger, Top. Catal., 2007, 42–43, 171–176 CrossRef.
- M. Pirez-Engelmann, P. Granger, L. Leclercq and G. Leclercq, Top. Catal., 2004, 30–31, 59–64 CrossRef.
Footnote |
| † Electronic supplementary information (ESI) available: Convergence test image of orbital cutoff and K-points of the LaCoO3 using CASTEP code. See DOI: 10.1039/c7ra03213g |
| This journal is © The Royal Society of Chemistry 2017 |

