 Open Access Article
Creative Commons Attribution 3.0 Unported Licence
Microwave-assisted rapid synthesis of a polyether from a plant oil derived monomer and its optimization by Box–Behnken design
Reza Ahmadi and
Aman Ullah
 *
*
Department of Agricultural, Food, and Nutritional Science, University of Alberta, 4-10 Agriculture/Forestry Centre, Edmonton, Alberta, Canada T6G 2P5. E-mail: ullah2@ualberta.ca
First published on 31st May 2017
Abstract
In this study, a new strategy for making polyethers from α-olefin (1-decene) was developed using microwave irradiation and compared with a conventional method. The olefin was epoxidized and subjected to catalytic polymerization using both conventional and microwave synthesis techniques. The conventional epoxidation reaction of 1-decene took 1 hour while microwave-assisted epoxidation was completed in ∼5 minutes. A three-factor, three-level Box–Behnken response surface design was employed to investigate the effect of the process parameters such as time, temperature, and the solvent–monomer ratios on the yield of the ring-opening polymerization of 1,2-epoxydecane using MMAO-12/2,4-pentanedione. The obtained experimental data were fitted to a transferred second-order polynomial equation using multiple regression analysis with a high coefficient of determination (R2) value of 0.9881. Interestingly, the optimal predicted parameters based on all independent variables (reaction time 9.97 min, the temperature 99.69 °C, and solvent to monomer ratio 5.27![[thin space (1/6-em)]](https://www.rsc.org/images/entities/char_2009.gif) :
:![[thin space (1/6-em)]](https://www.rsc.org/images/entities/char_2009.gif) 5) were determined by a maximum polyether yield of 82.51%, which was further confirmed by validation experiments. The synthesized polymers were characterized by using proton nuclear magnetic resonance spectroscopy (1H-NMR), attenuated total reflectance Fourier transform infrared spectroscopy (ATR-FTIR), differential scanning calorimetry (DSC), thermal gravimetric analysis (TGA) and size exclusion chromatography (SEC). A high molecular weight polyether was synthesized with a melting temperature as high as 88.64 °C and a decomposition in the range of 325–418 °C. The rapid synthesis of a biopolyether with high molecular mass is extremely attractive both from an academic and industrial point of views.
5) were determined by a maximum polyether yield of 82.51%, which was further confirmed by validation experiments. The synthesized polymers were characterized by using proton nuclear magnetic resonance spectroscopy (1H-NMR), attenuated total reflectance Fourier transform infrared spectroscopy (ATR-FTIR), differential scanning calorimetry (DSC), thermal gravimetric analysis (TGA) and size exclusion chromatography (SEC). A high molecular weight polyether was synthesized with a melting temperature as high as 88.64 °C and a decomposition in the range of 325–418 °C. The rapid synthesis of a biopolyether with high molecular mass is extremely attractive both from an academic and industrial point of views.
1. Introduction
The finite availability of petroleum resources and the destructive effect of the fossil-based products on the environment have attracted the attention of scientists, governmental and private agencies to use sustainable and environmentally friendly materials.1,2 The synthesis of biopolymers from renewable resources, therefore, has been considered as a promising strategy for releasing the polymer industry from its dependence on petroleum resources.3 An eco-friendly and sustainable alternative for plastic materials production is the utilization of monomers from plant-derived resources (proteins, carbohydrates, lipids) as promising starting materials to replace some or all of the synthetic chemicals and polymers in many applications.4 However, biopolymers from proteins and carbohydrates are not a good choice to replace petroleum-based plastics because these are moisture sensitive, difficult to process and brittle when used without the addition of a plasticizer. In this context vegetable oils, being hydrophobic, have attracted more attention compared to other bio-based compounds (i.e., polysaccharides, or proteins) for the production of biopolymers. Economic advantages and worldwide availability make vegetable oils interesting options for the industry. While diverse chemistry can be applied to vegetable oils for the production of several types of monomers and polymers, only minor modification reactions are necessary in order to obtain suitable monomers for many different applications.5Canola oil,6 soybean oil,7 castor oil,8 and high oleic sunflower oil5 are the common vegetable oils used directly for making biopolymers. Another approach, however, is to design biodegradable polymers through synthesis of monomers from plant oils and further polymerization into desired biopolymers.9–12 Among several other methods, olefin metathesis has recently emerged for the synthesis of monomers from plant oils.13 The olefin metathesis is a potentially useful synthetic transformation tool for the chemical conversion and formation of new carbon–carbon double bonds.14 It is generally categorized into ring-opening, ring closing, and cross-metathesis groups. Olefin cross-metathesis is a catalytic reaction between two alkene molecules that results in redistribution of alkylidene groups. The cross-metathesis of an olefinic compound could be done with ethylene or other olefins called ethenolysis and alkenolysis, respectively.15 Recently, our group has successfully reported remarkably efficient microwave-assisted ethenolysis and alkenolysis (using 1,5-hexadiene) of lipids into various monomers using 2nd generation Grubbs and Hoveyda–Grubbs catalysts.16 Interestingly, the solvent free rapid conversion of the substrates resulted in high value linear α-olefin monomers like methyl 9-decenoate, and 1-decene within few minutes. The resulting monomers can be manipulated to produce different kinds of polymers like polyethers which find applications in different industries such as pharmaceutical, cosmetic, adhesive, paint, textile fiber, and ceramic.17,18 Conventional methods have been used as the main applicable process for the synthesis of the polyethers. However, the production of polyether from vegetable oils and the manipulated monomers through conventional methods have some limitations including long reaction time, low yield, the occurrence of side reactions, and the use of a high amount of solvent. In addition, slow catalyst–monomer interaction and heating flow through conduction leading to heterogeneous reaction environment and limitations to control activation parameters in the conventional heating methods are some of the shortcomings of the conventional methods.11,19–22
The use of microwave (MW) irradiation is emerging as an alternative heating technique for product development and has provided new application opportunities to overcome above-mentioned limitations of conventional heating methods.3,20,21,23 Ring-opening polymerization (ROP) of cyclic monomers such as 2-ethyl-2-oxazolines,24 ε-caprolactone,21 D,L-lactide,22 and p-dioxanone25 in the presence of different metal catalysts and macro-initiators have also been studied under MW conditions.
The present study describes the production of a high molecular weight polyether from 1,2-epoxydecane synthesized from 1-decene using both the conventional and the MW methods. To the best of our knowledge, this is the first study reporting optimized epoxidation of 1-decane using an oxygen donor, without using catalyst, at a relatively short time with a high yield using conventional method. The epoxidation of 1-decene was also studied using the MW. The synthesized epoxy was polymerized using microwave-assisted catalytic ROP to polyether with really high molecular weight in the present and absence (bulk polymerization) of solvent in just a few minutes.
2. Experimental
2.1. Materials
1-Decene (94%), 3-chloroperoxybenzoic acid (m-CPBA ≤ 77%), modified methyl aluminoxane (MMAO-12, 7 wt% aluminum in toluene), anhydrous sodium sulfate (≥99%), dichloromethane (DCM, ≥99.5%), ethyl acetate (anhydrous, 99.8%), hexane, silica gel for chromatography (Whatman, 60 °A, 70–230 mesh), methanol (anhydrous, 99.8%), and tetrahydrofuran (THF, ≥99%) were purchased from Sigma-Aldrich. 2,4-Pentanedione (ReagentPlus®, ≥99%) and toluene (anhydrous, 99.8%) were dried over anhydrous sodium sulfate overnight before use.2.2. Instrumentation
A Bruker Alpha FTIR spectrophotometer (Bruker Optics, Esslingen, Germany) equipped with a single bounce diamond ATR crystal was employed to collect spectrum at a resolution of 4 cm−1 over the range of 410–4000 cm−1. All sample spectra were recorded at 16 scans and averaged using OPUS software (Bruker version 6.5). A background spectrum of the clean ATR crystal was also collected before applying and collecting the sample spectrum. Finally, the analysis of the spectrum was done using Nicolet Omnic software (version 8).Proton nucleic magnetic resonance (1H NMR) spectra were collected in deuterated chloroform (CDCl3) using a Varian Inova spectrometer (Varian, CA) at 400 MHz and 26.9 °C. The analysis of the spectrum was done using the MestReNova software (version 11.0).
X-ray Photoelectron Spectroscopy (XPS) was used to study the chemical composition of the polyether. The XPS measurements were conducted on ULTRA spectrometer (Kratos Analytical). The base pressure in the analytical chamber was lower than 3 × 10⁻⁸ Pa. The spectrometer was equipped with a monochromatic Al Kα source (hν = 1486.6 eV) source operated at a power of 140 W. The spot size used was 400 × 700 μm. The resolution of the instrument is 0.55 eV for Ag 3d and 0.70 eV for Au 4f peaks. The survey scans were taken in the range of 0–1100 eV with analyzer pass energy of 160 eV and a step of 0.4 eV. For the high-resolution spectra, the pass-energy was 20 eV with a step of 0.1 eV. The sample charging if any was compensated by an electron flood gun. The data were processed using the vision-2 instrument software. The binding energy of each photopeak was referenced to the C 1s level at 284.8 eV. Compositions were calculated from the high-resolution spectra using linear background and sensitivity factors provided by the instrument database.
The molecular weight and polydispersity of the polyethers were determined using gel permeation chromatography (GPC). The GPC system was equipped with Styragel HR5E GPC column (300 × 7.8 mm2 i.d., particle size = 5 μm, Waters Corporation). An isocratic Agilent 1100 pump (Agilent Technologies; CA) equipped with an evaporative light scattering detector (Alltech ELSD 2000, Mandel Scientific Company, Canada) was used. The THF was used as the eluent at a flow rate of 1 mL min−1, sample concentrations 0.5 mg mL−1, and injection volumes were 10 μL. The Agilent Polystyrene EasiVial PS-H standard kit with known molecular weight in the range of 162–7 × 10⁶ g mol−1 and the polydispersity ≤1 was used to generate the calibration curve by the Agilent GPC-Addon Rev. B. 01.01 Software.
The differential scanning calorimetric (DSC) analysis of all samples was carried out by a Perkin-Elmer (Pyris 1, Norwalk, CT, USA) calorimetric apparatus equipped with a cooling system in a range of −60–120 °C at a rate of 5 °C min−1 under a dry nitrogen gas atmosphere. The heat flow and temperature calibration of the instrument were established by a sample of pure indium. All the DSC measurements were performed following the ASTM E1356-08 (Reapproved 2014) standard procedure.26 Thermogravimetric analysis (TGA) was performed on a Perkin-Elmer (Pyris 1, Waltham, MA, USA). Approximately 13 mg of the specimen was loaded in the open platinum pan and scanned from 10 to 550 °C, at a heating rate of 10 °C min−1 under a nitrogen atmosphere with 100 mL min−1 purging flow following the ASTM D3850-12 (2012) standard.27
2.3. Synthesis of 1,2-epoxydecane from 1-decene (Scheme 1a)
The synthesis of 1,2-epoxydecane from 1-decene using conventional heating was carried out using reported method with some modifications.2 Briefly, dichloromethane (10 mL) and 1-decene (7 mmol) were added into a round-bottom flask equipped with a magnetic stir bar and placed into an ice bath. The initial exothermic epoxidation reaction of 1-decene was then controlled by gradual addition and dissolution of m-CPBA (8.9 mmol) into the reaction mixture at 0 °C. After that, the mixture was stirred at 900 rpm for different time points (15, 30, 60, and 180 min) at room temperature to determine the best yield of 1,2-epoxydecane. The epoxy monomer was separated by silica gel column chromatography (5% of the ethyl acetate in hexane). The solvents were evaporated by rotary evaporator and resulting 1,2-epoxydecane was dried over sodium sulfate. Finally, dried 1,2-epoxydecane was purged with a nitrogen line in a glass vial equipped with a septum cap. The vial was sealed with parafilm and stored at 4 °C for further polymerization. The yield of the epoxidation reaction was calculated by the following equation:| Yield% = (actual yield/theoretical yield) × 100 | (1) |
Where the actual yield is equal to the weight of the product after the reaction and theoretical yield is equal to 1.11 g of 1,2-epoxydecane per 1 g of 1-decene. The structure and purity of obtained 1,2-epoxydecane were confirmed using 1H NMR (Fig. 4) and ATR-FTIR spectroscopy (Fig. 5).
2.4. Synthesis of 1,2-epoxydecane from 1-decene using MW (Scheme 1b)
An MW system CEM-Discover (120 V, Matthews, USA) was used as a source of microwave irradiation for performing the epoxidation reaction of 1-decene. Dichloromethane (6.5 mL) was mixed with 1-decene (3.5 mmol) in an MW reaction vessel containing a magnetic stir bar and placed into an ice bath. The m-CPBA (4.5 mmol) was gradually added to the mixture at 0 °C. The vessel was then placed in the MW reactor with the adjusted pressure and power (250 psi, 250 W) and reaction conducted for 5 and 6 min at 25 °C. Column chromatography, rotary evaporator and drying on the sodium sulfate steps were done same as in the conventional method to purify the resulted 1,2-epoxydecane.2.5. Ring-opening polymerization of 1,2-epoxydecane (conventional method)
The conventional ring-opening polymerization of 1,2-epoxydecene was carried out using reported method with some modifications.11 Briefly, the polymerization reaction was planned in three different steps: “in situ” catalyst preparation, polymerization, and polyether precipitation. For “in situ” catalyst preparation a 50 mL dried round bottom flask containing a magnetic stir bar was charged with dried toluene (17 mL) and sealed with a rubber cap and parafilm. The oxygen in toluene and the flask was eliminated using a nitrogen line (purging toluene for 15 min and the headspace for 15 min) and then the flask was quickly sealed with parafilm again. MMAO-12 solution (215 μL) and 2,4-pentanedione (50 μL) were added stepwise into the purged flask with a purged microliter glass syringe (Hamilton Co., USA). Because of the extreme sensitivity of the catalyst to moisture and oxygen using dried reaction flasks and sealing them properly after adding each chemical is critical in these steps. The mixture was stirred for 5 min at room temperature to prepare the catalyst. For the polymerization step, the dried and purged 1,2-epoxydecane (10 mmol) was added to the catalyst mixture with a purged microliter glass syringe and the flask was quickly sealed with parafilm again. The mixture was heated in the silicon oil bath at 100 °C for 24 hours. The catalyst was quenched with 0.5 mL methanol to stop the reaction. Polyether precipitation was performed at the last step. The quenched highly viscous mixture from the previous step was diluted with 35 mL of toluene, poured into 300 mL methanol/concentrated aqueous HCl (90/10) and stirred rapidly for 15 min. Afterward, the supernatant was decanted and the produced white to pale yellow polyether was washed twice with methanol. Finally, the resulted polyether was dried in an oven at 40 °C overnight.2.6. Ring-opening polymerization of 1,2-epoxydecane (MW method)
The same three steps used in the conventional method were applied in the MW reaction. The yield of the reaction was optimized using three temperatures (50, 75, 100 °C), microwave irradiation time (4, 7, 10 min) and the solvent–monomer ratio or toluene–1,2-epoxydecane ratio (0![[thin space (1/6-em)]](https://www.rsc.org/images/entities/char_2009.gif) :
:![[thin space (1/6-em)]](https://www.rsc.org/images/entities/char_2009.gif) 5, 3
5, 3![[thin space (1/6-em)]](https://www.rsc.org/images/entities/char_2009.gif) :
:![[thin space (1/6-em)]](https://www.rsc.org/images/entities/char_2009.gif) 5, 6
5, 6![[thin space (1/6-em)]](https://www.rsc.org/images/entities/char_2009.gif) :
:![[thin space (1/6-em)]](https://www.rsc.org/images/entities/char_2009.gif) 5 mL mmol−1). For the reactions containing the solvent, the following procedure was carried out. Two dried MW tubes equipped with magnetic bars were charged with 3 and 6 mL of dried toluene and sealed with a septum cap and parafilm. The oxygen in toluene and the tube was eliminated. MMAO-12 solution (107 μL) and 2,4-pentanedione (25 μL) were added stepwise into the tube as mentioned in the conventional method. The mixture was stirred for 5 min to prepare the catalyst. 1,2-Epoxydecane (5 mmol) was then added to the catalyst mixture with the purged microliter glass syringe. The sealed tube was put in the MW and run with the adjusted pressure and power (250 psi, 250 W), different temperatures (50, 75, 100 °C) and different time intervals (4, 7, 10 min). Finally, the reaction was quenched with 0.25 mL methanol and diluted with 18 mL of toluene. The polyether was precipitated with 150 mL methanol/concentrated aqueous HCl (90/10) after 15 min stirring, washed and dried as mentioned in the conventional method.
5 mL mmol−1). For the reactions containing the solvent, the following procedure was carried out. Two dried MW tubes equipped with magnetic bars were charged with 3 and 6 mL of dried toluene and sealed with a septum cap and parafilm. The oxygen in toluene and the tube was eliminated. MMAO-12 solution (107 μL) and 2,4-pentanedione (25 μL) were added stepwise into the tube as mentioned in the conventional method. The mixture was stirred for 5 min to prepare the catalyst. 1,2-Epoxydecane (5 mmol) was then added to the catalyst mixture with the purged microliter glass syringe. The sealed tube was put in the MW and run with the adjusted pressure and power (250 psi, 250 W), different temperatures (50, 75, 100 °C) and different time intervals (4, 7, 10 min). Finally, the reaction was quenched with 0.25 mL methanol and diluted with 18 mL of toluene. The polyether was precipitated with 150 mL methanol/concentrated aqueous HCl (90/10) after 15 min stirring, washed and dried as mentioned in the conventional method.
2.7. Bulk ring-opening polymerization of 1,2-epoxydecene (MW method)
For bulk ROP, the catalyst was prepared without solvent in the first step. A dried MW tube equipped with a magnetic stir bar was charged with 2,4-pentanedione (200 μL), capped and sealed with parafilm tightly. The oxygen in 2,4-pentanedione and the tube was eliminated using a nitrogen line (purging 2,4-pentanedione for 5 min and the headspace for 15 min) and then the tube was quickly sealed with parafilm again. The purged tube was charged with the MMAO-12 solution (430 μL) and sealed as mentioned before. The mixture was stirred for 5 min to prepare the catalyst. After that, 1,2-epoxydecane (20 mmol) was added to the catalyst mixture with the purged microliter glass syringe. The rest of the process including the reaction in the MW, precipitation, washing and drying of the resulting polyether was followed as mentioned in the previous section.2.8. Experimental design for optimization of the polymerization using MW
The response surface methodology (RSM) was employed to determine the optimum conditions for ring-opening polymerization of 1,2-epoxydecane using the MW heating. RSM as an efficient multivariate technique provides a faster and more economical method allowing more than one variable to be optimized simultaneously. The experimental design and statistical analysis were performed using the Design Expert software (6.0.2, Stat-Ease Inc., USA). The experiments were performed based on the Box–Behnken Design (BBD). BBD has been frequently used as a suited design for fitting a quadratic surface and suitable chemometric tools for the process optimization. BBD reduce the number of experiments resulting in low solvent consumption and considerably less laboratory work. Moreover, BBD has a uniform precision by adequate selection of the number of center points.28,29 In the present study, the effects of the three independent variables at three levels (reaction times of 4, 7, 10 min (X1), temperatures of 50, 75, 100 °C (X2) and solvent–monomer ratio of 0![[thin space (1/6-em)]](https://www.rsc.org/images/entities/char_2009.gif) :
:![[thin space (1/6-em)]](https://www.rsc.org/images/entities/char_2009.gif) 5, 3
5, 3![[thin space (1/6-em)]](https://www.rsc.org/images/entities/char_2009.gif) :
:![[thin space (1/6-em)]](https://www.rsc.org/images/entities/char_2009.gif) 5, 6
5, 6![[thin space (1/6-em)]](https://www.rsc.org/images/entities/char_2009.gif) :
:![[thin space (1/6-em)]](https://www.rsc.org/images/entities/char_2009.gif) 5 mL mmol−1 (X3)) on the response or polymerization yield percent of the reaction (PY) was investigated.
5 mL mmol−1 (X3)) on the response or polymerization yield percent of the reaction (PY) was investigated.
The low, center and high factor levels were coded as −1, 0 and +1. The code with positive sign represents a synergistic effect of the variables while the negative one indicates an antagonistic effect of the variables. The variables coding was performed by the following equation:28
 | (2) |
17 experiments were designed with five center points to allow calculations of the response function at intermediate levels and estimation of the system performance at any experimental point within the studied range. The calculation of the total number of experiments (N) was done by the following equation:28
| N = K + k2 + Cp | (3) |
The actual design of experiments is shown in Table 1.
| Real (coded) valuesa | Polymerization yield (%) | ||||
|---|---|---|---|---|---|
| X1 | X2 | X3 | Experimentalb | Predicted | |
| a X1: time (min); X2: temperature (°C); X3: solvent–monomer ratio.b Average of three experiments. | |||||
| 1 | 10 (+1) | 50 (−1) | 3![[thin space (1/6-em)]](https://www.rsc.org/images/entities/char_2009.gif) : :![[thin space (1/6-em)]](https://www.rsc.org/images/entities/char_2009.gif) 5 (0) 5 (0) |
2.50 | 1.18 |
| 2 | 7 (0) | 75 (0) | 3![[thin space (1/6-em)]](https://www.rsc.org/images/entities/char_2009.gif) : :![[thin space (1/6-em)]](https://www.rsc.org/images/entities/char_2009.gif) 5 (0) 5 (0) |
12.30 | 13.43 |
| 3 | 7 (0) | 75 (0) | 3![[thin space (1/6-em)]](https://www.rsc.org/images/entities/char_2009.gif) : :![[thin space (1/6-em)]](https://www.rsc.org/images/entities/char_2009.gif) 5 (0) 5 (0) |
10.69 | 13.43 |
| 4 | 4 (−1) | 50 (−1) | 3![[thin space (1/6-em)]](https://www.rsc.org/images/entities/char_2009.gif) : :![[thin space (1/6-em)]](https://www.rsc.org/images/entities/char_2009.gif) 5 (0) 5 (0) |
0.30 | −0.08 |
| 5 | 7 (0) | 100 (+1) | 6![[thin space (1/6-em)]](https://www.rsc.org/images/entities/char_2009.gif) : :![[thin space (1/6-em)]](https://www.rsc.org/images/entities/char_2009.gif) 5 (+1) 5 (+1) |
72.56 | 66.62 |
| 6 | 7 (0) | 75 (0) | 3![[thin space (1/6-em)]](https://www.rsc.org/images/entities/char_2009.gif) : :![[thin space (1/6-em)]](https://www.rsc.org/images/entities/char_2009.gif) 5 (0) 5 (0) |
14.05 | 13.43 |
| 7 | 4 (−1) | 100 (+1) | 3![[thin space (1/6-em)]](https://www.rsc.org/images/entities/char_2009.gif) : :![[thin space (1/6-em)]](https://www.rsc.org/images/entities/char_2009.gif) 5 (0) 5 (0) |
21.67 | 25.74 |
| 8 | 10 (+1) | 75 (0) | 0![[thin space (1/6-em)]](https://www.rsc.org/images/entities/char_2009.gif) : :![[thin space (1/6-em)]](https://www.rsc.org/images/entities/char_2009.gif) 5 (−1) 5 (−1) |
3.50 | 3.75 |
| 9 | 7 (0) | 100 (+1) | 0![[thin space (1/6-em)]](https://www.rsc.org/images/entities/char_2009.gif) : :![[thin space (1/6-em)]](https://www.rsc.org/images/entities/char_2009.gif) 5 (−1) 5 (−1) |
40.86 | 37.66 |
| 10 | 7 (0) | 50 (−1) | 0![[thin space (1/6-em)]](https://www.rsc.org/images/entities/char_2009.gif) : :![[thin space (1/6-em)]](https://www.rsc.org/images/entities/char_2009.gif) 5 (−1) 5 (−1) |
0.00 | 0.75 |
| 11 | 7 (0) | 75 (0) | 3![[thin space (1/6-em)]](https://www.rsc.org/images/entities/char_2009.gif) : :![[thin space (1/6-em)]](https://www.rsc.org/images/entities/char_2009.gif) 5 (0) 5 (0) |
15.35 | 13.43 |
| 12 | 4 (−1) | 75 (0) | 0 (−1) | 0.00 | −0.25 |
| 13 | 10 (+1) | 75 (0) | 6 (+1) | 13.64 | 14.82 |
| 14 | 7 (0) | 50 (−1) | 6 (+1) | 1.11 | 1.84 |
| 15 | 10 (+1) | 100 (+1) | 3 (0) | 70.40 | 73.69 |
| 16 | 7 (0) | 75 (0) | 3 (0) | 14.98 | 13.43 |
| 17 | 4 (−1) | 75 (0) | 6 (+1) | 1.10 | 0.49 |
The mathematical relationship of the response to the three significant independent variables (X1, X2, and X3) can be approximated by the quadratic polynomial equation, shown as follow:
| PY = β0 + β1X1 + β2X2 + β3X3 + β12X1X2 + β13X1X3 + β23X2X3 + β11X12 + β22X22 + β33X32 | (4) |
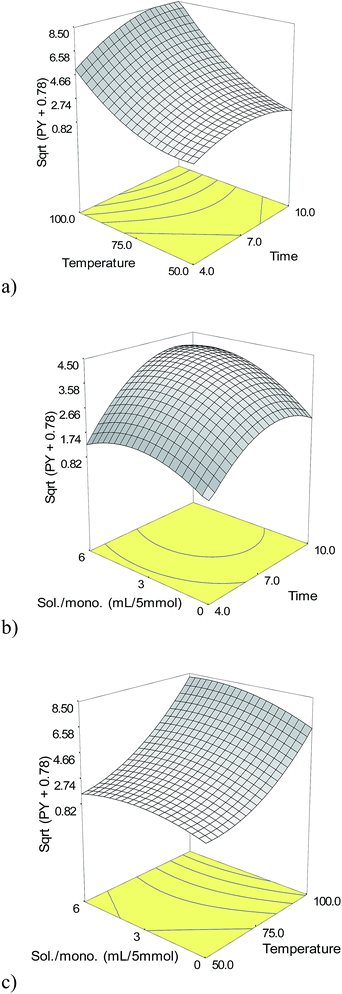
For reaching to the optimum values of the factors, the regression equation was solved; the surface of the counter response surface plot was analyzed, and also the constraints for the levels of the variables were set up.
3. Results and discussion
3.1. Synthesis of 1,2-epoxydecane from 1-decene
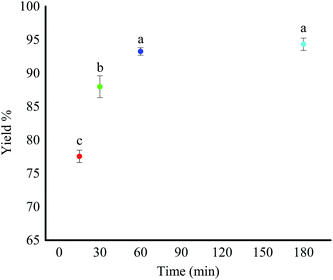
This study initially investigated the conventional and the MW methods for epoxidation of 1-decene. The epoxidation reaction was performed in the presence of m-CPBA as the oxidant in both methods. The percent yield of the 1,2-epoxydecane at four different time intervals using conventional heating is presented in Fig. 1. Higher reaction time favored the epoxidation reaction. When the reaction time increased from 15 to 60 min, the percent yield increased significantly (p < 0.05) from 77.56% to more than 93%. However, increasing the reaction time to more than 60 min did not further increase the product yield. Therefore, 60 min was chosen as the optimum time for the epoxidation of 1-decene using the conventional method. Epoxidation of 1-decane has been reported in the literature using different catalyst systems. Warwel et al. used hydrogen peroxide in ethyl acetate with Novozym 435® as a chemo-enzymatic catalyst to oxidize 1-decene.11,30 The reported yield of 1,2-epoxydecane after 16 hours at 40 °C was only 85% which is lower than what was obtained in our study. Ho et al. reported another catalytic system for the epoxidation of 1-decene.31 They used Mn (ClO4)2 as the catalyst in acetonitrile/water with different commercial oxidants. Interestingly, when m-CPBA was used as the oxidant the reaction yield was only ∼47% which is significantly lower than the yield obtained in our study. Epoxidation of 1-decene using a complex catalytic system of Na2WO4 dihydrate, (aminomethyl) phosphonic acid, and methyltrin-octyl ammonium hydrogen sulfate with hydrogen peroxide for 4 hours at 90 °C yielded 99% 1,2-epoxydecane which is comparable to our results.32An MW system (250 psi pressure, 250 W power) was employed to study the effect of MW irradiation on the epoxidation of 1-decene in the next step (Scheme 1b). In the course of the study, the best result was achieved when the microwave irradiation was applied just for 5 min in the presence of m-CPBA with a yield of 67.13%. Although the epoxidation reaction was successful, the yield of the reaction was significantly lower than the 15 min heating in the conventional method (Fig. 1). When the reaction time exceeded 5 min, extra peaks appeared in the 1H NMR spectrum of the resulted product. The presence of hydroxyl peak at 3.65 ppm can be an indication of the cleavage of oxirane ring. The interference of water in the reaction mixture is potentially the reason for the observed oxirane ring break down. m-CPBA is the source of water in the reaction because it is not stable without water. Therefore, microwave irradiation does not appear to be a suitable method for epoxidation of 1-decene when m-CPBA is used as the oxidant.
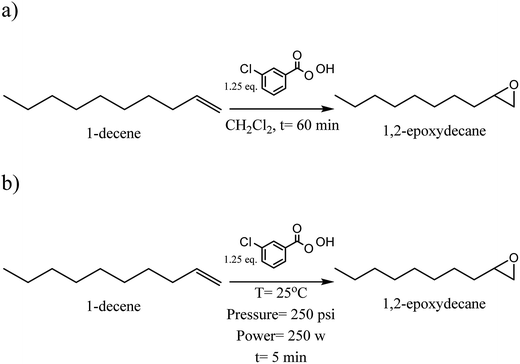 | ||
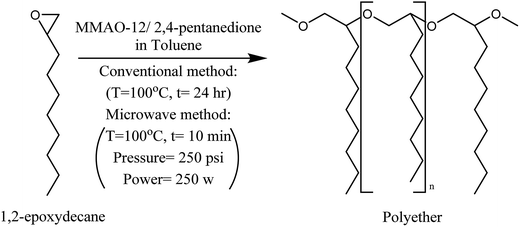
| Scheme 1 Synthesis of 1,2-epoxydecane from 1-decene (a) conventional method (b) microwave irradiation method. | ||
3.2. Ring-opening polymerization of 1,2-epoxydecane (conventional method)
The ring-opening polymerization of 1,2-epoxydecane was carried out using previously reported procedure with some modifications.11 Briefly, the polymerization of 1,2-epoxydecane was performed to a quantitative conversion at 100 °C for 24 hours using the MMAO-12/2,4-pentanedione as the catalyst (Scheme 2). A white to pale yellow polyether was produced by precipitation in methanol/concentrated HCL (90/10) with 74.38% yield. The obtained polyether was soluble in 1,4-dioxane at room temperature but at 50 °C in THF. The molecular weight of the polyether was determined by GPC. The molecular weight of the polyether was more than 2.4 × 10⁶ g mol−1 and polydispersity 1.2.3.3. Ring-opening polymerization of 1,2-epoxydecane (MW method)
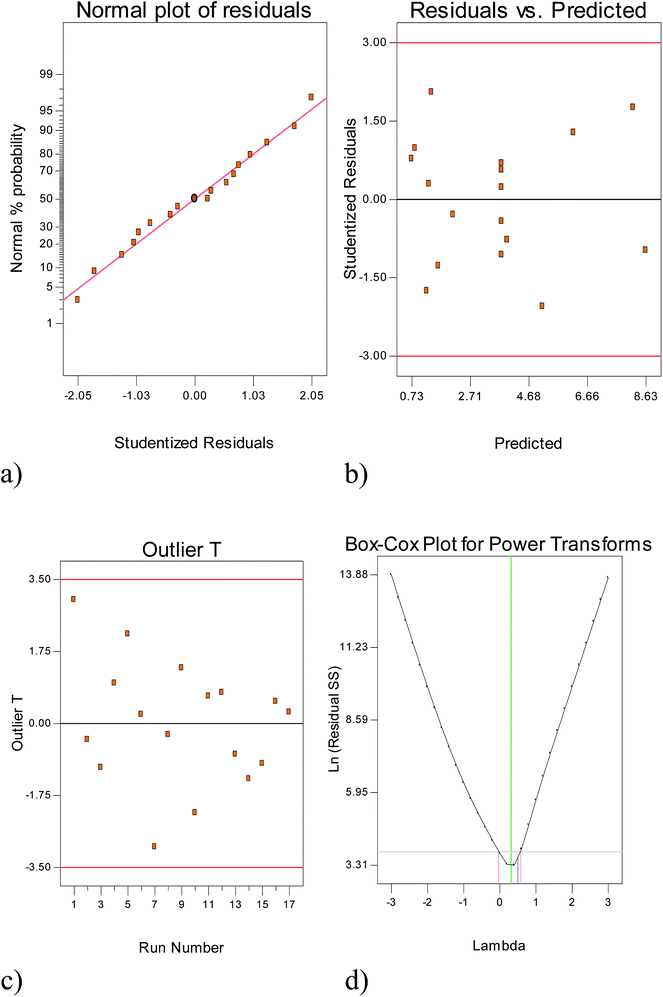
The observed and predicted PY results are shown in Table 1. The adequacy of the model was checked based on the experimental data to ascertain whether the approximating model would provide poor or misleading results. As shown in Table 2, all of the linear, interactive (two factor interactions = 2FI), quadratic and cubic models were fitted to the experimental data. The adequacy of these models was investigated through three different tests namely the sequential model sum of squares, lack of fit tests and model summary statistics. The results of these evaluations have been exhibited in Table 2. The quadratic model was found to be the most suitable model for the optimization of polymerization reaction among four studied types of BBD because of maximum R2, adjusted R2, predicted R2 and the low standard deviation. Thereafter, the analysis of variance (ANOVA) further justified the adequacy of the model (Table 2). As shown in Table 2, all of the linear, interactive (two factor interactions = 2FI), quadratic and cubic models were fitted to the experimental data.
| Sequential model sum of squares | ||||||
|---|---|---|---|---|---|---|
| Source | Sum of squares | DF | Mean square | F-Value | Prob > F | Remarks |
| a Underline values show the higher significance. | ||||||
| Mean | 213.72 | 1 | 213.72 | |||
| Linear | 77.63 | 3 | 25.88 | 19.81 | <0.0001 | |
| 2FI | 3.18 | 3 | 1.06 | 0.77 | 0.5371 | |
| Quadratic | 12.67 | 3 | 4.22 | 4.22 | 0.0004 | Suggested |
| Cubic | 0.85 | 3 | 4.09 | 4.09 | 0.1035 | Aliased |
| Residual | 0.28 | 4 | 0.069 | — | — | |
| Total | 308.34 | 17 | 18.14 | — | — | |
| Lack of fit tests | ||||||
|---|---|---|---|---|---|---|
| Source | Sum of squares | DF | Mean square | F-Value | Prob > F | Remarks |
| Linear | 16.70 | 9 | 1.86 | 26.76 | 0.0032 | |
| 2FI | 13.52 | 6 | 2.25 | 32.49 | 0.0024 | |
| Quadratic | 0.85 | 3 | 0.28 | 4.09 | 0.1035 | Suggested |
| Cubic | 0.000 | 0 | — | — | — | Aliased |
| Model summary statistics | ||||||
|---|---|---|---|---|---|---|
| Source | Std. dev. | R2 | Adjusted R2 | Predicted R2 | Press | Remarks |
| Linear | 1.14 | 0.8205 | 0.7791 | 0.6297 | 35.04 | |
| 2FI | 1.17 | 0.8542 | 0.7667 | 0.2730 | 68.78 | |
| Quadratic | 0.40 | 0.9881 | 0.9727 | 0.8515 | 14.05 | Suggested |
| Cubic | 0.26 | 0.9971 | 0.9883 | — | Aliased | |
 | (5) |
| Source | Coefficient estimate | Sum of squares | Degree of freedom | Standard error | Mean square | F value | p-Value | |
|---|---|---|---|---|---|---|---|---|
| Model | 3.77 | 93.49 | 9 | 0.18 | 10.39 | 64.42 | <0.0001 | Significant |
| X1 | 1.01 | 8.16 | 1 | 0.14 | 8.16 | 50.60 | 0.0002 | |
| X2 | 2.88 | 66.57 | 1 | 0.14 | 66.57 | 412.88 | <0.0001 | |
| X3 | 0.60 | 2.90 | 1 | 0.14 | 2.90 | 17.99 | 0.0038 | |
| X12 | −1.02 | 4.42 | 1 | 0.20 | 4.42 | 27.43 | 0.0012 | |
| X22 | 1.26 | 6.72 | 1 | 0.20 | 6.72 | 41.69 | 0.0003 | |
| X32 | −0.71 | 2.14 | 1 | 0.20 | 2.14 | 13.25 | 0.0083 | |
| X1X2 | 0.73 | 2.14 | 1 | 0.20 | 2.14 | 13.29 | 0.0082 | |
| X1X3 | 0.31 | 0.38 | 1 | 0.20 | 0.38 | 2.39 | 0.1662 | |
| X2X3 | 0.41 | 0.66 | 1 | 0.20 | 0.66 | 4.07 | 0.0835 | |
| Residual | 1.13 | 7 | 0.16 | |||||
| Lack of fit | 0.85 | 3 | 0.28 | 4.09 | 0.1035 | Not sig. | ||
| Pure error | 0.28 | 4 | 0.069 | |||||
| Cor total | 94.62 | 16 |
P-Values less than 0.0500 indicate model terms are significant or not.35 So, it could be inferred that the linear coefficients (X1, X2, and X3), quadratic coefficients (X12, X22 and X32) and interactive coefficients (X1X2, X1X3, and X2X3) were significant or insignificant and prove the pattern of the interactions between the variables.35 The p-values of model terms indicate that the linear and quadratic as well as one of the interactive coefficients (X1X2), were significant. As shown in Table 3, the Model F-value of 67.01 suggested the model is significant at p < 0.0001. The lack of fit F-value of 4.09 and the associated p-value of 0.1035 was insignificant. The determination coefficient (R2), adjusted determination coefficient (Rα2), and predicted determination coefficient (Rp2) were also evaluated to confirm that the model fits properly as listed in Table 4. The R2 equal to 0.9885 of the quadratic regression model indicated that the model has a good fit and only 0.0115% of the total variations could not be explained by the model. Joglekar and May (1987) suggested R2 should be more than 0.80 for a good fit of a model.36 The adjusted determination coefficient (Rα2) equal to 0.9738 further confirmed the significance of the model. Moreover, the R2 and Rα2 values are close enough to indicate a high correlation between the experimental and the predicted values.28 In addition, the predicted determination coefficient (Rp2) equal to 0.8585 was in a reasonable agreement with the adjusted determination coefficient (Rα2) (Table 4). Finally, the signal to noise ratio greater than 4 provides the adequate precision measure.37 As this ratio was 26.056, the model indicated an adequate signal, too. Therefore, the model was authenticated based on the aforementioned result that can be used to navigate the design space.
| R2 | Adjusted R2 | Predicted R2 | Mean ± SD | CV, % | Adequate precision |
|---|---|---|---|---|---|
| 0.9881 | 0.9727 | 0.8515 | 3.55 ± 0.40 | 11.33 | 25.665 |
![[thin space (1/6-em)]](https://www.rsc.org/images/entities/char_2009.gif) :
:![[thin space (1/6-em)]](https://www.rsc.org/images/entities/char_2009.gif) 5 for the solvent–monomer ratio. Triplet confirmatory experiments were conducted for the validation of the model. The optimum conditions along with 2 more conditions with different solvent–monomer ratios (Table 5) for maximum predicted yield were used to confirm the model and investigate the effects of solvent volume on the molecular weight of the polyether. Table 5 summarizes the confirmatory conditions, the predicted and observed PY as well as the molecular weights of the obtained polymers. The observed PY has a good agreement with the predicted PY in all of the selected runs. This indicates the efficiency of the Box–Behnken design incorporated with desirability function in optimizing conditions for the PY in the microwave assisted ring-opening polymerization of 1,2-epoxydecane.
5 for the solvent–monomer ratio. Triplet confirmatory experiments were conducted for the validation of the model. The optimum conditions along with 2 more conditions with different solvent–monomer ratios (Table 5) for maximum predicted yield were used to confirm the model and investigate the effects of solvent volume on the molecular weight of the polyether. Table 5 summarizes the confirmatory conditions, the predicted and observed PY as well as the molecular weights of the obtained polymers. The observed PY has a good agreement with the predicted PY in all of the selected runs. This indicates the efficiency of the Box–Behnken design incorporated with desirability function in optimizing conditions for the PY in the microwave assisted ring-opening polymerization of 1,2-epoxydecane.
| Run | Time (min) | Temp. (°C) | Solvent![[thin space (1/6-em)]](https://www.rsc.org/images/entities/char_2009.gif) : :![[thin space (1/6-em)]](https://www.rsc.org/images/entities/char_2009.gif) monomer ratio (mL monomer ratio (mL![[thin space (1/6-em)]](https://www.rsc.org/images/entities/char_2009.gif) : :![[thin space (1/6-em)]](https://www.rsc.org/images/entities/char_2009.gif) mmol) mmol) |
Desirability | Predicted PY (%) | Observedc PY (%) | Mn × 106 (g mol−1) | Mw × 106 (g mol−1) | Mw/Mn |
|---|---|---|---|---|---|---|---|---|---|
| a The software of the microwave was just able to adjust whole numbers of temperature, so 100 °C was used in this runs. Meanwhile, the maximum variance in the adjusted temperature on the machine is less than ±2 °C during hold time.b Conventional method.c Average of the three experiments. | |||||||||
| 1 | 9.97 | 99.69a | 5.27![[thin space (1/6-em)]](https://www.rsc.org/images/entities/char_2009.gif) : :![[thin space (1/6-em)]](https://www.rsc.org/images/entities/char_2009.gif) 5 5 |
1 | 82.51 | 80 ± 1.6 | 1.8476 | 2.1247 | 1.15 |
| 2 | 9.22 | 99.96a | 3![[thin space (1/6-em)]](https://www.rsc.org/images/entities/char_2009.gif) : :![[thin space (1/6-em)]](https://www.rsc.org/images/entities/char_2009.gif) 5 5 |
1 | 73.17 | 74 ± 0.62 | 0.39829 | 1.5599 | 3.9165 |
| 3 | 9.05 | 100 | 0![[thin space (1/6-em)]](https://www.rsc.org/images/entities/char_2009.gif) : :![[thin space (1/6-em)]](https://www.rsc.org/images/entities/char_2009.gif) 5 5 |
0.75 | 44.08 | 47 ± 3.02 | 0.25988 | 1.1617 | 4.4703 |
| 4b | 24 h | 100 | 6![[thin space (1/6-em)]](https://www.rsc.org/images/entities/char_2009.gif) : :![[thin space (1/6-em)]](https://www.rsc.org/images/entities/char_2009.gif) 5 5 |
— | — | — | 1.9807 | 2.4019 | 1.2 |
3.4. Molecular weight of the polyether
The polymer was heated at 50 °C in THF for 5 min to be used in GPC. As shown in Table 5, the molecular weight of all polyethers was above one million (g mol−1). Surprisingly, the molecular weight of the polyether produced with optimum conditions of the MW in less than 10 min was 2.12 × 10⁶ (g mol−1) which was comparable to that of produced by the conventional method after 24 hours (2.40 × 10⁶ g mol−1) and reported in the literature.11 Warwel et al. referred the remarkably slow polymerization of ω-epoxied olefins in the conventional method to the improper catalyst monomer interaction. Although they tried to solve the problem using temperatures above 100 °C with the help of higher boiling solvents such as m-xylene, and 1,2,4-trichloro benzene (TCB), they were not successful and saw a drastic decrease in the molecular weight of polymers.11 Therefore, our study proved that the ROP of ω-epoxied olefins with MMAO-12/2,4-pentanedione can be accelerated using MW irradiation through the improvement of the catalyst–monomer interactions.3 different levels of solvent–monomer ratios were also investigated in the MW method. The solvent–monomer ratio has a direct effect on the molecular weight and yield of the polyether. Although the MW assisted bulk polymerization of 1,2-epoxydecane resulted in polyether of molecular weight 1.16 × 10⁶ (g mol−1) but by increasing solvent–monomer ratio from 0![[thin space (1/6-em)]](https://www.rsc.org/images/entities/char_2009.gif) :
:![[thin space (1/6-em)]](https://www.rsc.org/images/entities/char_2009.gif) 5 to 5.25
5 to 5.25![[thin space (1/6-em)]](https://www.rsc.org/images/entities/char_2009.gif) :
:![[thin space (1/6-em)]](https://www.rsc.org/images/entities/char_2009.gif) 5 enhanced the molecular weight of the polyether to 2.12 × 10⁶ (g mol−1). Similar to the conventional method, the polydispersity of the polyether synthesized using optimum microwave conditions was considerably narrow (D = 1.15) (Table 5). The narrow polydispersity of the polyethers produced using a higher ratio of the solvent both in MW and conventional method was probably due to the solubility of the polyethers in the solvent. However, when the solvent ratios were decreased, the polydispersity of the polyethers became considerably broad. It is possibly due to the difference in the initiation time of different changes resulting from an uncontrolled polymerization process and the decrease of the propagation rate due to increase in viscosity with time which leads to new chains with low molecular mass and high polydispersity.
5 enhanced the molecular weight of the polyether to 2.12 × 10⁶ (g mol−1). Similar to the conventional method, the polydispersity of the polyether synthesized using optimum microwave conditions was considerably narrow (D = 1.15) (Table 5). The narrow polydispersity of the polyethers produced using a higher ratio of the solvent both in MW and conventional method was probably due to the solubility of the polyethers in the solvent. However, when the solvent ratios were decreased, the polydispersity of the polyethers became considerably broad. It is possibly due to the difference in the initiation time of different changes resulting from an uncontrolled polymerization process and the decrease of the propagation rate due to increase in viscosity with time which leads to new chains with low molecular mass and high polydispersity.
3.5. Confirmation of epoxidation and polymerization reactions
The structure of the epoxidized monomer and the produced polyether was analyzed by 1H-NMR and ATR-FTIR. A typical 1H-NMR spectrum of the synthesized polyether from 1-decene is presented in Fig. 4. The spectrum clearly supports the epoxidation of 1-decene and the formation of polyether from 1,2-epoxydecane. Comparison of 1H-NMR spectra of 1-decene and its epoxidized form demonstrated successful oxidation through the disappearance of the terminal double bond peaks at 2.04–5.82 ppm and appearance of the epoxy group peaks at 2.46–2.9 ppm.32,38 The shift of epoxy group peaks to the ∂ 3.38–3.58 ppm region confirms the generation of the ether linkage after ROP.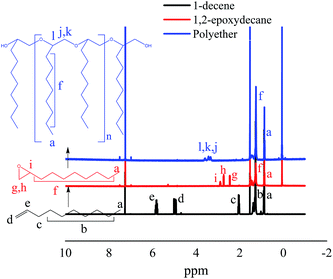 | ||
| Fig. 4 400 MHz 1H-NMR (CDCl3) spectra of two steps conversion of 1-decene to 1,2-epoxydecane and then polyether. | ||
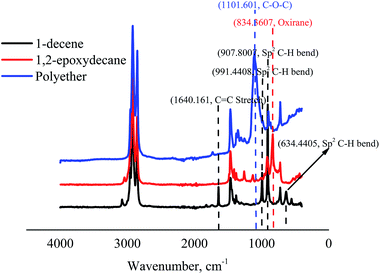
Further confirmation of the whole process was done by the changes in the ATR-FTIR spectrum signals (Fig. 5). FTIR spectra of 1-decene and 1,2-epoxydecane revealed the disappearance of C![[double bond, length as m-dash]](https://www.rsc.org/images/entities/char_e001.gif) C peaks (∼1640C
C peaks (∼1640C![[double bond, length as m-dash]](https://www.rsc.org/images/entities/char_e001.gif) C stretch, ∼991, ∼907, and ∼634 cm−1 of sp2 CH bend of alkene) and the appearance of oxirane ring peak at ∼834 cm−1. Two small peaks in the region between ∼1130 and 1260 cm−1 might be related to the acyl and alkoxy groups of ethyl acetate solvent used in column chromatography during purification. Additionally, the oxirane peak was disappeared in the polyether spectrum and a clear peak related to ether linkages appeared at ∼1101 cm−1.
C stretch, ∼991, ∼907, and ∼634 cm−1 of sp2 CH bend of alkene) and the appearance of oxirane ring peak at ∼834 cm−1. Two small peaks in the region between ∼1130 and 1260 cm−1 might be related to the acyl and alkoxy groups of ethyl acetate solvent used in column chromatography during purification. Additionally, the oxirane peak was disappeared in the polyether spectrum and a clear peak related to ether linkages appeared at ∼1101 cm−1.
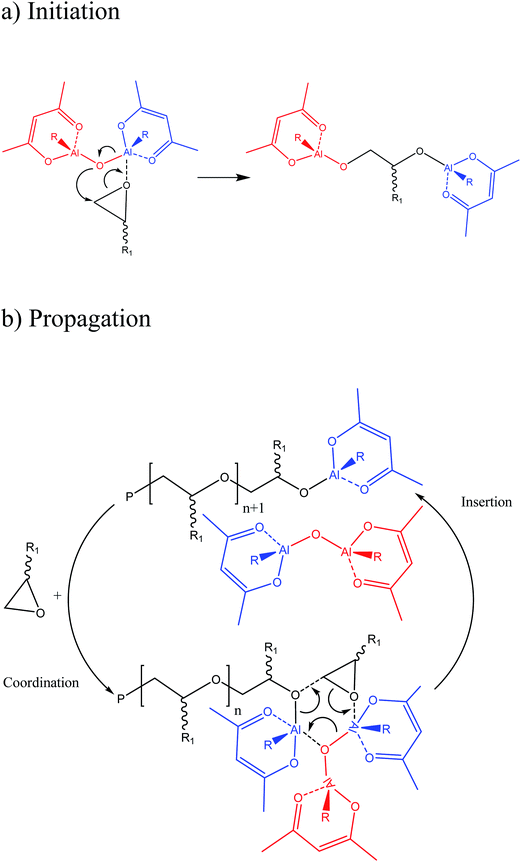
According to the catalyst nature, a coordinative ring-opening polymerization mechanism can be expected for the 1,2-epoxydecane which is described in the literature. The initiation proceeds by the nucleophilic attack of the oxygen in the catalyst Al–O–Al system over the oxirane ring coordinated to a neighboring metal center. Therefore, the oxirane of the monomer opens and the monomer is inserted between the coordinated Al and the rest of the Al–O–Al bond system (Fig. 6a). The propagation step happens as a coordination insertion process. The oxygen on the monomer oxirane ring is coordinated by an Al on the catalyst active site. Then, ring-opening occurs subsequently by the nucleophilic attack of the oxygen at the end of the growing chain and inserting the epoxide between that oxygen and the coordinated Al while the released Al from the end of the growing chain and participating catalyst in reaction regenerates the bimetallic catalyst again (Fig. 6b). Ideally, the growing chain moves alternatively between two vicinal Al atoms in a “flip-flop” way and leads to linear polyethers with Al–O–C bonds at both ends, and their acidic hydrolysis through the precipitation step will produce a polyetherdiol.11,39
3.6. X-ray photoelectron spectroscopy (XPS)
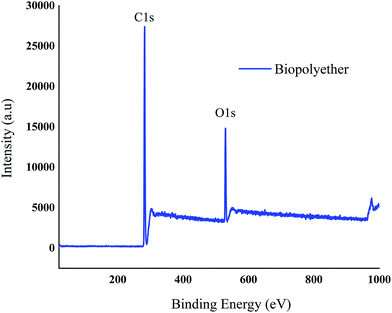
XPS was used to observe the elemental composition and functional groups of the polyether. The peaks observed in the spectrum at about 529, 282, and 101 eV are due to O 1s and C 1s respectively.40 Fig. 7 clearly shows that the polyether is composed of carbon and oxygen only. The elemental composition of the polyether was 78.23% and 12.77% for the carbon and oxygen, respectively.3.7. Thermal properties of the polyether
The thermal properties of the polyethers produced using the optimum conditions under MW irradiation and conventional method was studied using DSC and TGA. Typical DSC and TGA thermograms of the polyethers are shown in Fig. 8 and 9, respectively. DSC revealed a multiple melting endotherms for the polyethers with a complete melting observed at 34.11–88.38 °C and 39.57–84.85 °C in the microwave and conventional method, respectively. This phenomenon has been referred to the complex structure of the polyether with the tactic and atactic regions.11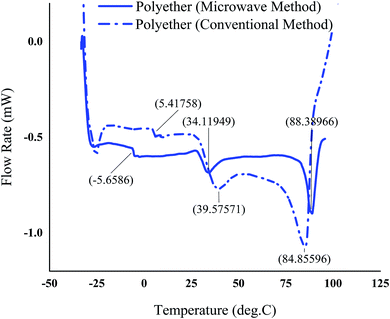 | ||
| Fig. 8 DSC-thermogram of the polyether produced in the optimum process condition using the microwave as the heating source and conventional method. | ||
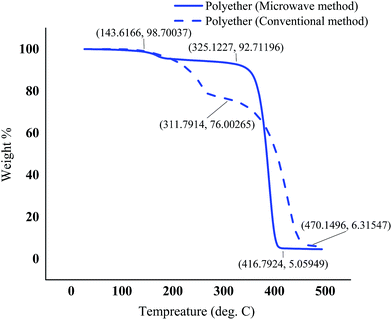 | ||
| Fig. 9 TGA – thermogram of the polyethers produced using the optimum conditions under microwave irradiation and the conventional method. | ||
The polyethers exhibited a low glass transition temperature of 5.41 °C and −5.62 °C in the conventional and microwave method, respectively. Generally, the presence of long dangling chains in the structure of the polyether provides a stronger plasticizing effect and gives a low glass transition temperature.41 In addition, the shift of the glass transition temperature and the melting point in the polyether obtained from MW method could be due to the slight differences in the molecular weight and different proportions of isotactic and atactic polymer chains in MW and conventional methods. The glass transition temperature of atactic polypropylene has been reported lower than that of isotactic,42 therefore it is most probable that microwaves promote atacticity compared to conventional heating. The TGA curves illustrated a small weight loss in the range of 143–193 °C possibly due to the presence of tiny amounts of the lower molecular weight polymers in both polyethers synthesized by conventional heating and microwaves. However, the major decomposition in the range of 325–418 °C was observed for the polyether resulted from microwave method. Nevertheless, a contrast to one major weight loss in microwave assisted synthesized polyether, the TGA of the polyether from the conventional method showed two major weight loss zones. First major weight loss at ∼200–400 °C and second between 400 °C and 500 °C. It has also been reported that atactic polypropylene had higher thermal stability.43 Therefore, the second weight loss in polyether prepared by conventional heating at ∼200–400 °C could be attributed to a higher proportion of isotactic polyether and final weight loss between 400 °C and 500 °C is probably due to atactic polyether component.
4. Conclusion
This manuscript details with the production of a high molecular weight polyether from 1-decane, one of the main biorefinery products of the plant oils, through both conventional and the MW methods. The epoxidation reaction of 1-decene was optimized and successfully completed within 1 hour, a considerably short time without using catalyst, under conventional method. MW was not found suitable for performing the epoxidation reaction of 1-decane due to epoxy ring-opening by MW irradiation. Synthesized 1,2-epoxydecane was then used as the starting material for the production of a high molecular weight polyether. The polymerization yield was optimized using a three-factor, three-level Box–Behnken design for the MW method. The BBD appeared to be a suitable method for optimization of the reaction conditions to maximize the yield of the ring-opening polymerization of 1,2-epoxydecane. The optimum point was identified with the graphical response surface plots. The optimum conditions for the highest polyether yield were as follow t = 9![[thin space (1/6-em)]](https://www.rsc.org/images/entities/char_2009.gif) :
:![[thin space (1/6-em)]](https://www.rsc.org/images/entities/char_2009.gif) 97 min, T = 99.69 °C, and 5.27
97 min, T = 99.69 °C, and 5.27![[thin space (1/6-em)]](https://www.rsc.org/images/entities/char_2009.gif) :
:![[thin space (1/6-em)]](https://www.rsc.org/images/entities/char_2009.gif) 5 solvent–monomer ratio with a desirability value of 1. The polyether produced with the optimum conditions of MW illustrated the highest yield and molecular weight in a good agreement with the results of the conventional method. This result confirmed that the MMAO-12/2,4-pentanedione have a good potential to use for ring- opening polymerization of the terminal olefins in the microwave method. Thermal properties study of the polyether showed a complete melting at 34.13–88.64 °C with the Tg point of −5.62 °C and the onset decomposition temperature of 325 °C.
5 solvent–monomer ratio with a desirability value of 1. The polyether produced with the optimum conditions of MW illustrated the highest yield and molecular weight in a good agreement with the results of the conventional method. This result confirmed that the MMAO-12/2,4-pentanedione have a good potential to use for ring- opening polymerization of the terminal olefins in the microwave method. Thermal properties study of the polyether showed a complete melting at 34.13–88.64 °C with the Tg point of −5.62 °C and the onset decomposition temperature of 325 °C.
References
- S. Warwel, F. Bruse, C. Demes, M. Kunz and M. R. G. Klaas, Polymers and surfactants on the basis of renewable, Chemosphere, 2001, 43, 39–48 CrossRef CAS PubMed.
- K. Zhang, A. M. Nelson, S. J. Talley, M. Chen, E. Margaretta, A. G. Hudson, R. B. Moore and T. E. Long, Non-isocyanate poly(amide-hydroxy urethane)s from sustainable resources, Green Chem., 2016, 18, 4667–4681 RSC.
- F. Pardal, S. Salhi, B. Rousseau, M. Tessier, S. Claude and A. Fradet, unsaturated polyamides from bio-based z-octadec-9-enedioic acid, Macromol. Chem. Phys., 2008, 209, 64–74 CrossRef CAS.
- M. A. R. Meier, J. O. Metzger and U. S. Schubert, Plant oil renewable resources as green alternatives in polymer science, Chem. Soc. Rev., 2007, 36, 1788–1802 RSC.
- L. Montero de Espinosa and M. A. R. Meier, Plant oils: The perfect renewable resource for polymer science?!, Eur. Polym. J., 2011, 47, 837–852 CrossRef CAS.
- T. S. Omonov and J. M. Curtis, Biobased epoxy resin from canola oil, J. Appl. Polym. Sci., 2014, 131, 40142 CrossRef.
- G. Karmakar and P. Ghosh, Atom transfer radical polymerization of soybean oil and its evaluation as a biodegradable multifunctional additive in the formulation of eco-friendly lubricant, ACS Sustainable Chem. Eng., 2016, 4, 775–781 CrossRef CAS.
- K. R. Kunduru, A. Basu, M. H. Zada and A. J. Domb, Castor oil-based biodegradable polyesters, Biomacromolecules, 2015, 16, 2572–2587 CrossRef CAS PubMed.
- P. J. Roumanet, F. Laflèche, N. Jarroux, Y. Raoul, S. Claude and P. Guégan, Novel aliphatic polyesters from an oleic acid based monomer. Synthesis, epoxidation, cross-linking and biodegradation, Eur. Polym. J., 2013, 49, 813–822 CrossRef CAS.
- O. Türünç, M. Firdaus, G. Klein and M. A. R. Meier, Fatty acid derived renewable polyamides via thiol-ene additions, Green Chem., 2012, 14, 2577 RSC.
- S. Warwel, B. Wiege, E. Fehling and M. Kunz, Ring-opening polymerization of oleochemical epoxides catalyzed by aluminoxane/acetylacetone, Eur. Polym. J., 2000, 36, 2655–2663 CrossRef CAS.
- M. Arshad, S. Saied and A. Ullah, PEG–lipid telechelic incorporating fatty acids from canola oil: synthesis, characterization and solution self-assembly, RSC Adv., 2014, 4, 26439–26446 RSC.
- S. Chikkali and S. Mecking, Refining of plant oils to chemicals by olefin metathesis, Angew. Chem., Int. Ed., 2012, 51, 5802–5808 CrossRef CAS PubMed.
- Y. Takahira and Y. Morizawa, Ruthenium-catalyzed olefin cross-metathesis with tetrafluoroethylene and analogous fluoroolefins, J. Am. Chem. Soc., 2015, 137, 7031–7034 CrossRef CAS PubMed.
- A. H. Hoveyda and A. R. Zhugralin, The remarkable metal-catalysed olefin metathesis reaction, Nature, 2007, 450, 243–251 CrossRef CAS PubMed.
- A. Ullah and M. Arshad, Remarkably efficient microwave-assisted cross-metathesis of lipids in solvent-free conditions, ChemSusChem, 2017, 10, 2167–2174 CrossRef CAS PubMed.
- T. Sabu and P. M. Visakh, Handbook of Engineering and Speciality Thermoplastics, John Wiley & Sons Inc., and Scrivener Publishing LLC., USA, 2011 Search PubMed.
- G. N. Gaylord, High polymers, John Wiley & Sons, Inc., USA, 1962 Search PubMed.
- J. T. Pelle Lidström, B. Wathey and J. Westman, Microwave assisted organic synthesis-a review, Tetrahedron, 2001, 57, 9225–9283 CrossRef.
- R. Hoogenboom and U. S. Schubert, Microwave-assisted polymer synthesis: recent developments in a rapidly expanding field of research, Macromol. Rapid Commun., 2007, 28, 368–386 CrossRef CAS.
- S. Sinnwell and H. Ritter, Recent advances in microwave-assisted polymer synthesis, Aust. J. Chem., 2007, 60, 729–743 CrossRef CAS.
- C. Zhang, L. Liao and L. Liu, Rapid ring-opening polymerization of D,L-lactide by microwaves, Macromol. Rapid Commun., 2004, 25, 1402–1405 CrossRef CAS.
- M. B. Gawande, S. N. Shelke, R. Zboril and R. S. Varma, Microwave-assisted chemistry: synthetic applications for rapid assembly of nanomaterials and organics, Acc. Chem. Res., 2014, 47, 1338–1348 CrossRef CAS PubMed.
- F. Wiesbrock, R. Hoogenboom, C. H. Abeln and U. S. Schubert, Single-mode microwave ovens as new reaction devices: accelerating the living polymerization of 2-ethyl-2-oxazoline, Macromol. Rapid Commun., 2004, 25, 1895–1899 CrossRef CAS.
- Y. Li, X. L. Wang, K. K. Yang and Y. Z. Wang, A rapid synthesis of poly(p-dioxanone) by ring-opening polymerization under microwave irradiation, Polym. Bull., 2006, 57, 873–880 CrossRef CAS.
- ASTM COMPASS, DOI: 10.1520/E1356, accessed 2016.
- ASTM COMPASS, DOI: 10.1520/D3850-12, accessed 2016.
- M. Kousha, E. Daneshvar, H. Dopeikar, D. Taghavi and A. Bhatnagar, Box–Behnken design optimization of Acid Black 1 dye biosorption by different brown macroalgae, Chem. Eng. J., 2012, 179, 158–168 CrossRef CAS.
- M. Iqbal, S. Faiyaz and A. Tarique, Simple and sensitive UPLC-MS/MS method for high-throughput analysis of ibrutinib in rat plasma: optimization by Box–Behnken experimental design, J. AOAC Int., 2016, 99, 618–625 CrossRef CAS PubMed.
- M. R. Klaas and S. Warwel, Lipase-catalyzed preparation of peroxy acids and their use for epoxidation, J. Mol. Catal. A: Chem., 1997, 117, 311–319 CrossRef.
- K. P. Ho, W. L. Wong, K. M. Lam, C. P. Lai, T. H. Chan and K. Y. Wong, A simple and effective catalytic system for epoxidation of aliphatic terminal alkenes with manganese(II) as the catalyst, Chem.–Eur. J., 2008, 14, 7988–7996 CrossRef CAS PubMed.
- S. Kazuhiko, M. Aoki, M. Ogawa, T. Hashimoto and R. Noyori, A practical method for epoxidation of terminal olefins with 30% hydrogen peroxide under halide-free conditions, J. Org. Chem., 1996, 61, 8310–8311 CrossRef.
- J. W. Osborne, Improving your data transformations: Applying the Box–Cox transformation, Practical Assessment, Research and Evaluation, 2010, 15, 1–9 Search PubMed.
- A. A. Karnachi and M. A. Khan, Box–Behnken design for the optimization of formulation variables of indomethacin coprecipitates with polymer mixtures, Int. J. Pharm., 1996, 131, 9–17 CrossRef CAS.
- S. N. Azizi and N. Asemi, A Box–Behnken design for determining the optimum experimental condition of the fungicide (Vapam) sorption onto soil modified with perlite, J. Environ. Sci. Health, Part B, 2012, 47, 692–699 CrossRef CAS PubMed.
- C. Tian, S. Fu, J. Chen, Q. Meng and L. A. Lucia, Graft polymerization of ε-caprolactone to cellulose nanocrystals and optimization of grafting conditions utilizing a response surface methodology, Nord. Pulp Pap. Res. J., 2014, 29, 58–68 CAS.
- J. P. Maran, S. Manikandan, K. Thirugnanasambandham, C. V. Nivetha and R. Dinesh, Box–Behnken design based statistical modeling for ultrasound-assisted extraction of corn silk polysaccharide, Carbohydr. Polym., 2013, 92, 604–611 CrossRef PubMed.
- E. D. Rio, M. Galià, V. Càdiz, G. Lligadas and J. C. Ronda, Polymerization of Epoxidized Vegetable Oil Derivatives: Ionic-Coordinative Polymerization of Methylepoxyoleate, J. Polym. Sci., Part A: Polym. Chem., 2010, 48, 4995–5008 CrossRef.
- Y. Imada, H. Iida, T. Kitagawa and T. Naota, Aerobic reduction of olefins by in situ generation of diimide with synthetic flavin catalysts, Chem.–Eur. J., 2011, 17, 5908–5920 CrossRef CAS PubMed.
- X. Gao, X. Hu, P. Guan, C. Du, S. Ding, X. Zhang, B. Li, X. Wei and R. Song, Synthesis of core-shell imprinting polymers with uniform thin imprinting layer via iniferter-induced radical polymerization for the selective recognition of thymopentin in aqueous solution, RSC Adv., 2016, 6, 110019–110031 RSC.
- Z. S. Petrović, I. Cvetković, D. Hong, X. Wan, W. Zhang, T. W. Abraham and J. Malsam, Vegetable oil-based triols from hydroformylated fatty acids and polyurethane elastomers, Eur. J. Lipid Sci. Technol., 2010, 112, 97–102 CrossRef.
- A. Gitsas and G. Floudas, Pressure Dependence of the Glass Transition in Atactic and Isotactic Polypropylene, Macromolecules, 2008, 41, 9423–9429 CrossRef CAS.
- H. Pasch, M. I. Malik and T. Macko, Recent Advances in High-Temperature Fractionation of Polyolefins, Adv. Polym. Sci., 2013, 251, 77–140 CrossRef CAS.
| This journal is © The Royal Society of Chemistry 2017 |

