 Open Access Article
Creative Commons Attribution 3.0 Unported Licence
Application of the correct design of successive self-nucleation and annealing (SSA) to study the stereo-defects and its distribution of homo- and co-polypropylene
Cong Ding *,
Geng Zhang,
Jiangjiang Gu,
Feifei Cao and
Xinsheng Zheng
College of Science, Huazhong Agricultural University, Wuhan, 430070, China. E-mail: dingcong@mail.hzau.edu.cn
First published on 9th May 2017
Abstract
The stereo-defects and its distribution of four homo- and co-polypropylene samples with different processing properties were studied through the correct design Successive Self-Nucleation and Annealing (SSA), and other characterization methods such as Differential Scanning Calorimetry (DSC), Gel Permeation Chromatography (GPC), Temperature Rising Elution Fractionation (TREF), respectively. Firstly, the preliminary characterization found that the two homo-polypropylene or co-polypropylene samples had the similar mechanical and thermal properties, and the SSA results also revealed the internal microstructure of the different kind of polypropylene was almost exactly the same, representing the alike isotactic sequence length, the fractions weight of the isotactic sequence, and the isotactic sequence length distribution of the same kind of polypropylene. Compared with the homo-polypropylene, the DSC, GPC, and TREF tests indicated there were difference in the properties of the co-polypropylene samples, revealing the disparities in molecular chain microstructure. The SSA results after the correct Ts for each sample showed there were obvious differences in the (statistical) lamellar thickness and its distribution and the fractions weight of different fractions after SSA treatment, further revealing the microstructure difference on the isotactic sequence length, and the isotactic sequence length distribution of homo- and co-polypropylene samples. Besides, the correct design SSA also indicated the polar copolymer monomer had a great influence on the high isotactic component in co-polypropylene microstructure.
Introduction
Polypropylene was usually prepared by Ziegler–Natta catalyst system and widely used in various applications such as packaging material and other industrial uses such as lithium-ion battery separators, and the stereo-defects of polypropylene could reflect the information the processability and mechanical properties of polypropylene.1–3 It is known that the methyl groups of its molecular chain for polypropylene are not all perfectly in the same side, and the stereo-defects of polypropylene prepared by Ziegler–Natta catalyst are the stereo-defects of the arrangements of the side methyl groups of “mistake inserted” monomers, and the length between every two “mistake inserted” monomers is called isotactic sequence length of polypropylene, as shown in Fig. 1, which can reflect stereo-defects distribution of polypropylene.4–10Successive Self-Nucleation and Annealing (SSA) was a thermal fractionation protocol, which was designed and implemented by Müller and coworkers in 1997.11–19 SSA was widely used to analyze the chain structures of crystallized polymers (e.g., branches, comonomers, crosslinks, stereo-defects or any other molecular defects) based on the self-nucleation and annealing steps, which was capable of performing thermal fractionation with much better resolution and spending less time than previously available techniques (such as step crystallization and TREF). And there was a good correspondence between the SSA and TREF techniques, and the results of SSA were coincident with the results of high resolution 13C-NMR, GPC, TREF, and xylene solvent (XS) fractionation.13,16–34
For PP samples, with the increase of separation temperature, the component separated by TREF showed higher melting temperature and longer isotactic sequence length after SSA treatment, and 13C-NMR result also indicated that the isotacticity of polypropylene and isotactic sequence length of PP increased.27,35–38 Compared with 13C-NMR and TREF fractionation, SSA fractionation was a more time-saving and practical technique in the characterization of the molecular structure of PP, as well as a way providing important quantitative information about the lamellar thickness and its distribution of PP, which gave a more accurate characterization to the isotactic sequence length and its distribution of polypropylene.
However, Müller found that some authors started their SSA protocol at an arbitrary Ts without a previous self-nucleation study to determine the ideal self-nucleation temperature (Ts-idea) although there were more than 130 reports on the application of SSA on the polymers since 1997, which was reported as the review on the principles, applications and perspectives of SSA by Müller.39 Müller insisted that any attempts to quantify the data such as calculate SCB or MSL distributions were not correct unless the first Ts employed to perform SSA was Ts-idea because the Ts-idea had a strong impact on the final fractionation profile. Therefore, correct design of the fractionation method should include a conscientious choice of fractionation window, fractionation time, scanning rate, sample mass and especially the first self-nucleation temperature (Ts) to be employed, and the self-nucleation studies must be performed before SSA in order to choose the first Ts.
In this paper, the stereo-defects and its distribution of four homo- and co-polypropylene samples with different processing properties were studied through the correct design of Successive Self-Nucleation and Annealing (SSA) and other ways such as DSC, GPC, TREF, respectively. For SSA fractionation profile, the fractionation window was 5 °C, the fractionation time was 15 min, the scanning rate was 20 °C min−1, and sample mass was 2.5 mg according to the high-speed calorimetry concept introduced by Pijpers.11,40–42 So, correct design of the fractionation method for the first self-nucleation temperature (Ts) was employed by self-nucleation studies (SN) before SSA in order to choose the first Ts.
Experimental
Materials
The four homo- and co-polypropylene samples studied in this paper were commercial PP resin. The homo-polypropylene sample 1 (grade T30S) and the co-polypropylene sample 3 (grade k8003) were provided by China Sinopec, while the sample 2 (grade PC366-3) and the co-polypropylene sample 4 (grade 7633) were provided by LCY Chemical Corp., respectively.Characterization of the four homo- and co-polypropylene samples
The molecular weights (Mn and Mw) and the molecular weight distribution (MWD) were determined by a PL-GPC 220 high-temperature gel permeation chromatography (Polymer Laboratories Ltd) at 413.15 K, using 1,2,4-trichlorobenzene as solvent, the injection volume was 100 mL, and the flow rate was 1.0 mL min−1. Calibration was made by polystyrene as the standard sample.The TREF tests of the PP samples were tested by a PolymerChar TREF300, using 1,2,4-trichlorobenzene as solvent, and detection method is IR. The temperature was raised from 35 °C to 150 °C.
All differential scanning calorimetry (DSC) measurements were performed with a Mettler 822e DSC in a nitrogen atmosphere. Samples about 2–4 mg in aluminium pans were first melted by heating from 50 °C up to 200 °C at a rate of 50 °C min−1 and were held at this temperature for 5 min in order to erase the previous thermal history, then cooled down to 50 °C at a rate of 20 °C min−1, held at 50 °C for 5 min, and then finally heated again to 200 °C at a rate of 20 °C min−1. The melting temperature Tm and the enthalpy of fusion ΔHm were determined from the second melting curve. The degree of crystallinity was calculated according to the following formula (1):43
| χc = ΔHm/ΔH0m | (1) |
The self-nucleation (SN) technique was originally devised by Keller et al.45 to aid the preparation of single crystals from solution. Fillon et al.40 extended the study of self-nucleation by employing DSC. The SN procedures can be described as follows:
(a) Erasure of thermal history and crystalline memory. Erasure of the crystalline thermal history by heating the sample to 200 °C and held for 5 min;
(b) Creation of a “standard” semi-crystalline state. Cooling the sample at 20 °C min−1 to 50 °C and held for 2 min;
(c) Thermal conditioning at a temperature denoted as Ts. The sample was heated at 20 °C min−1 from 50 °C to a partial melting temperature denoted as Ts, and the sample was kept at Ts for 15 min;
(d) Subsequent cooling at 20 °C min−1 from Ts down to 50 °C;
(e) Finally, the sample was heated at 20 °C min−1 from 50 °C to 200 °C.
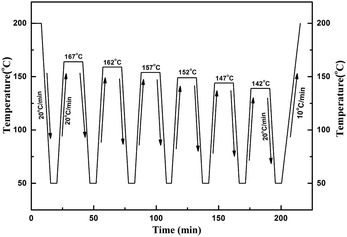
SSA fractionation was performed as presented by Müller.11 Pijpers et al.42 recently introduced the high-speed calorimetry concept that the increment of heating rate can be compensated by reducing the sample mass. Hence, a higher scanning rate of 20 °C min−1 was employed to reduce the fractionation time, and a smaller sample mass of 2.5 mg was used as compensation. The SSA procedure was schematically displayed in Fig. 2, and the complete thermal treatment comprised the following steps:
(a) Erasure of the crystalline thermal history by heating the sample to 200 °C and held for 5 min;
(b) Cooling the sample at 20 °C min−1 to 50 °C and held for 2 min;
(c) The sample was heated at 20 °C min−1 from 50 °C to a partial melting temperature denoted as Ts, such as the first Ts for sample 1 was chosen as 167 °C after the SN procedure;
(d) The sample was kept at Ts for 15 min;
(e) DSC cooling scan at 20 °C min−1 from Ts to 50 °C;
(f) Repeat step “c” to “e” at a new lower Ts which is 5 °C lower than the previous Ts for a total six self-nucleation/annealing steps.
(g) Finally, the sample was heated at 10 °C min−1 from 50 °C to 200 °C, and a multiple of melting endothermal peaks were obtained.
Results and discussion
The thermal properties characterization of PP samples
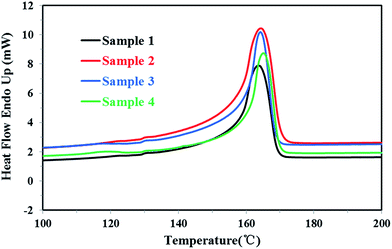
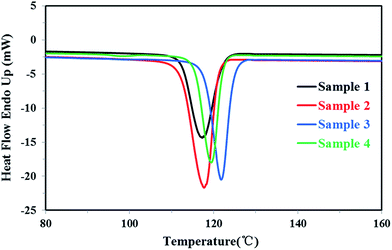
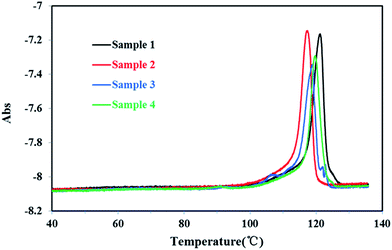
Firstly, all PP samples were characterized preliminarily and the results were listed in Table 1. The DSC melting curves and crystallization curves of four PP samples were shown as Fig. 3 and 4, respectively.| Samples | MFRa | Tmb (°C) | ΔHmc (J g−1) | Tcd (°C) | Xce (%) |
|---|---|---|---|---|---|
| a The MFR test condition of PP samples was g per 10 min, 2.16 kg, 230 °C.b Melting temperature was determined from the endothermic curves of DSC.c The value of the endothermic enthalpy was determined from DSC.d Crystallization temperature was determined from the exothermic curves of DSC.e The degree of crystallization was calculated from the value of the endothermic enthalpy. | |||||
| Sample 1 | 3.5 | 163.6 | 91.7 | 117.3 | 43.9 |
| Sample 2 | 3.0 | 164.2 | 98.8 | 117.7 | 47.3 |
| Sample 3 | 2.0 | 164.2 | 77.5 | 121.8 | 37.1 |
| Sample 4 | 2.1 | 165.1 | 87.9 | 119.4 | 42.1 |
For the homo-polypropylene resin sample 1 and sample 2, Fig. 3, 4 and Table 1 indicated that there were subtle differences on the melt flow-ability, the melting temperature, the melting enthalpy and crystallization temperature of homo-polypropylene, revealing the microstructure difference of homo-polypropylene was small. Compared with sample 1, sample 2 had the higher melting temperature, the higher melting enthalpy, the higher crystallization temperature and degree of crystallization, suggesting that samples 2 had a regular molecular chain structure. For the co-polypropylene resin sample 3 and sample 4, Fig. 3, 4 and Table 1 revealed that the melting enthalpy, the crystallization temperature and the degree of crystallization of co-polypropylene were lower than those of homo-polypropylene, which was mainly ascribed to the regularity of the molecular chain of polypropylene destroyed by the copolymerization monomer.
The structure properties characterization of PP samples
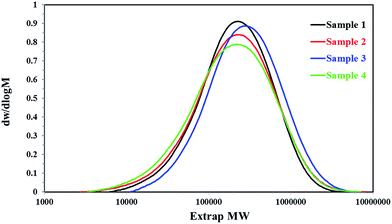
The structure properties of all PP samples were studied by GPC and TREF, respectively.The molecular weights (Mn and Mw) and the molecular weight distribution (MWD) of all PP samples were tested by GPC and plotted in Fig. 5 and Table 2. The GPC results revealed that the molecular weight distribution of homo-polypropylene was almost the same, which was about 2.7, but the molecular weights (Mn and Mw) of sample 2 was larger than that of sample 1, which may reveal there was an obvious difference on the regular molecular chain structure and molecular chain length between the homo-polypropylene samples 1 and samples 2. For the co-polypropylene resin, sample 3 and sample 4, Fig. 5 and Table 2 showed that the molecular weight distribution of sample 3 was much smaller than that of sample 4, while the molecular weights (Mn and Mw) of sample 3 was heavier than that of sample 4, suggesting that the molecular chain of samples 3 was concentrated distribution on the chain segment of high molecular weight.
| Samples | Mn | Mw | Mw/Mn |
|---|---|---|---|
| Sample 1 | 120![[thin space (1/6-em)]](https://www.rsc.org/images/entities/char_2009.gif) 347 347 |
326![[thin space (1/6-em)]](https://www.rsc.org/images/entities/char_2009.gif) 539 539 |
2.713 |
| Sample 2 | 159![[thin space (1/6-em)]](https://www.rsc.org/images/entities/char_2009.gif) 138 138 |
431![[thin space (1/6-em)]](https://www.rsc.org/images/entities/char_2009.gif) 216 216 |
2.710 |
| Sample 3 | 102![[thin space (1/6-em)]](https://www.rsc.org/images/entities/char_2009.gif) 599 599 |
350![[thin space (1/6-em)]](https://www.rsc.org/images/entities/char_2009.gif) 143 143 |
3.413 |
| Sample 4 | 94![[thin space (1/6-em)]](https://www.rsc.org/images/entities/char_2009.gif) 594 594 |
339![[thin space (1/6-em)]](https://www.rsc.org/images/entities/char_2009.gif) 712 712 |
3.709 |
The TREF results of all PP sample were plotted in Fig. 6. The temperature was ranging from 40 °C to 140 °C. Compared with homo-polypropylene, there were obvious multiple melting endotherm (107.1 °C, 92.7 °C, 66.6 °C) of co-polypropylene respectively, indicating that there were more branched structures in co-polypropylene. As the TREF300 was an analysis TREF, which was not like the P-TREF that the fraction components could be collected and deeply characterized for microstructure characteristics, SSA fractionation was needed to give a more accurate characterization of the molecular structure of PP.
SSA thermal fractionation characterization of PP samples
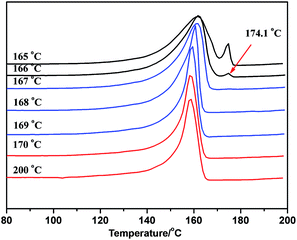
As the ideal self-nucleation temperature (the first self-nucleation temperature Ts) had a strong impact on the final fractionation profile when the SSA thermal fractionation was used for polymers, for the correct design of the fractionation method, the self-nucleation studies must be performed before SSA in order to choose the first Ts.39 According to Fillon's study,40 the self-nucleation temperature range could be divided into three domains when the self-nucleation behavior of i-PP through the self-annealing procedures by DSC. Domain I can represent the temperature range where complete melting was achieved and the samples retained no memory of prior crystallization. Domain II was observed at lower Ts values, and the nucleation density displayed an exponential growth and the peak crystallization temperature showed a corresponding shift to higher values when cooling from Ts. Domain III appeared at lower Ts temperatures where both partial melting and annealing occurred. Domain II applied to Ts temperatures which were high enough to melt almost any crystals in the sample, but still low enough to leave small crystal self-nuclei or seeds that could nucleate the polymer upon subsequent cooling from Ts. Müller et al.11,39 suggested that the optimum self-nucleation temperature or optimum Ts temperature was defined as the minimum temperature within Domain II of the SSA thermal conditioning.According to standard self-nucleation procedure,11,39,40 the melting and crystallization curves of SN at different annealing temperature of sample 1 for example were studied, as shown in Fig. 7 and 8. Fig. 8 showed that there were no changes detected in the crystallization temperature obtained at the Ts temperature from 170 °C to 200 °C as compared to the standard crystallization temperature obtained at the Ts temperature of 200 °C, indicating that the nucleation density of the samples remained constant in Domain I. Thermal conditioning at 169 °C for 15 min was able to make polypropylene self-nucleation, so its crystallization temperature was shifted to higher temperature (Fig. 8) while the subsequent melting didn't reveal any traces of annealing (Fig. 7). That's because the unmelted crystal could form the self-nucleation of pp in the subsequent crystallization process, leading to significant reduction of the energy barrier of crystallization process. Fig. 7 showed that a new melting peak occurred in 174.1 °C when Ts was equal to and less than 166 °C, showing a typical single self-nucleation and annealing, which indicated that Domain III started. When the annealing temperature Ts was lower than 167 °C, the crystallization peaks became broader and the lamellae started to grow thicker. The lamellae were more perfect than the lamellae formed from the next dynamic crystallization process and had the higher melting temperature. The nucleation behavior of sample 1 illustrated that the minimum annealing temperature of Domain II was Ts value equal to 167 °C. The optimal annealing temperature Ts of all PP samples were tested as above self-nucleation experiments and the results were listed in Table 3.
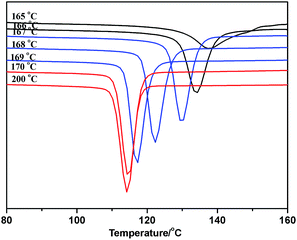 | ||
| Fig. 8 The DSC crystallization curve after crystallization at different annealing temperature of sample 1. | ||
| Samples | Domain-I | Domain-II | Domain-III | Ts/°C |
|---|---|---|---|---|
| Sample 1 | Ts > 169 | 166 < Ts ≤ 169 | Ts ≤ 166 | 167 |
| Sample 2 | Ts > 169 | 166 < Ts ≤ 169 | Ts ≤ 166 | 167 |
| Sample 3 | Ts > 169 | 166 < Ts ≤ 169 | Ts ≤ 166 | 167 |
| Sample 4 | Ts > 169 | 167 < Ts ≤ 169 | Ts ≤ 167 | 168 |
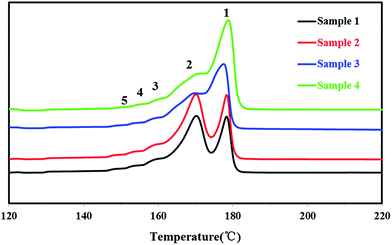
In order to study the distribution of stereo-defects in the polypropylene chain, all PP samples were studied and fractionated by SSA. The SSA melting curves of the four PP samples were shown in Fig. 9, and each peak of the melting point and the enthalpy of fusion ΔHm of each sample were listed in Table 4.
| Samples | ΔHm/(J g−1) | Tm1/°C | Tm2/°C | Tm3/°C | Tm4/°C | Tm5/°C |
|---|---|---|---|---|---|---|
| Sample 1 | 127.1 | 177.7 | 170.4 | 165.8 | 160.1 | 154.1 |
| Sample 2 | 126.2 | 177.7 | 170.2 | 165.7 | 160.1 | 154.0 |
| Sample 3 | 104.5 | 176.7 | 171.0 | 166.3 | 160.9 | 154.9 |
| Sample 4 | 109.7 | 176.4 | 172.7 | 167.8 | 163.7 | 158.4 |
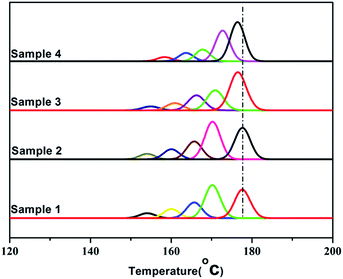
It's known that higher melting temperature on the SSA final melting curve was corresponding to higher isotacticity and longer isotactic sequence length in the molecular chains.4,7 Fig. 9 and Table 4 showed that there were five melting peaks on the melting curves after SSA fractionation for all PP samples, and especially the higher melt peaks of homo-polypropylene (sample 1 and sample 2) were more different from those of co-polypropylene (sample 3 and sample 4) while the lower melting peaks of polypropylene samples were somewhat similar. Compared with the homo-polypropylene (sample 1 and sample 2), the molecular chains of the co-polypropylene (sample 3 and sample 4) were more regular while the enthalpy of fusion ΔHm was lower. In order to quantitatively evaluate the variations of all melting peaks, the relative contents (the integral area percentages on the SSA melting curve) of each peak were calculated using Peakfit 4.12 Software, and the relative contents of all peaks were shown in Table 5. Fig. 10 showed plots of SSA melting curve as well as its fitting curves of sample 1 after treated by Peakfit 4.12 Software. Fig. 11 showed the fitting peaks of SSA melting curves of all PP samples after treatment, and the weight fractions content of the polypropylene fractions calculated by using Peakfit 4.12 Software was shown as Fig. 12.
| Samples | R2a | n1b (%) | n2 (%) | n3 (%) | n4 (%) | n5 (%) |
|---|---|---|---|---|---|---|
| a The peakfit variance R2 of the fitted peaks by using Peakfit 4.12 Software.b The relative content of peak 1 on the SSA curve of polypropylene calculated using Peakfit 4.12 Software. | ||||||
| Sample 1 | 0.981 | 31.3 | 36.2 | 17.1 | 10.0 | 5.4 |
| Sample 2 | 0.977 | 30.7 | 36.7 | 17.5 | 9.7 | 5.4 |
| Sample 3 | 0.985 | 45.3 | 23.8 | 17.8 | 8.6 | 4.5 |
| Sample 4 | 0.996 | 41.7 | 32.6 | 12.4 | 8.9 | 4.4 |
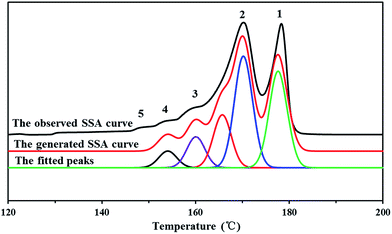 | ||
| Fig. 10 Plots of SSA melting curve and its fitting curves of PP sample 1 by using Peakfit 4.12 Software where the peakfit variance R2 of the fitted peaks is 0.981. | ||
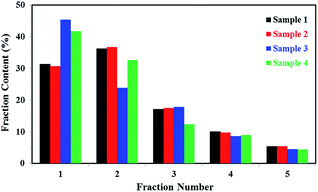 | ||
| Fig. 12 Weight fractions (%) of the polypropylene fractions calculated by using Peakfit 4.12 Software. | ||
As can be seen from Table 5 and Fig. 12, the relative contents of peak 1 for the highest isotactic component in the molecular chain of co-polypropylene (sample 3 and sample 4) were about 10–15% higher than that of homo-polypropylene (sample 1 and sample 2), showing that there were more highest isotactic component in the molecular chain of co-polypropylene (sample 3 and sample 4). Table 5 and Fig. 12 also showed that the relative contents of (peak 2, peak 3, peak 4, and peak 5) for the higher or lower isotactic component in the molecular chain of co-polypropylene (sample 3 and sample 4) were lower than those of homo-polypropylene (sample 1 and sample 2), showing that the higher or lower isotactic component in the molecular chain of homo-polypropylene (sample 1 and sample 2) were much more than those of co-polypropylene (sample 3 and sample 4). The initial SSA results indicated that the polar copolymer monomer had a great influence on the high isotactic component in co-polypropylene microstructure.
The crystallization sequences with different length of polypropylene could be crystal independently and form the microcrystalline with different sizes when polypropylene was fractionated through thermal techniques such as SSA. Therefore, the crystallization sequence length of polypropylene was related to the lamellar thickness, and the multiplex melting peaks on the SSA melting curves in fact were the melting peaks of the microcrystalline with different sizes formed and annealed at each self-nucleation temperature employed.4,7,11,27,46,47 The lamellar thickness could be estimated from the SSA results with the following Thomson–Gibbs equation.48
The lamellar thicknesses of all polypropylene samples were calculated by Thomson–Gibbs equation after SSA thermal fractionation, and listed in Table 6.
| Samples | L1/nm | L2/nm | L3/nm | L4/nm | L5/nm |
|---|---|---|---|---|---|
| Sample 1 | 27.10 | 15.08 | 11.78 | 9.27 | 7.57 |
| Sample 2 | 27.10 | 14.89 | 11.73 | 9.27 | 7.55 |
| Sample 3 | 24.43 | 15.65 | 12.07 | 9.56 | 7.76 |
| Sample 4 | 23.73 | 17.53 | 13.02 | 10.71 | 8.72 |
Table 6 showed the lamellar thicknesses of the highest isotactic component in the molecular chain of homo-polypropylene (sample 1 and sample 2), which were about 3–4 nm longer than those of co-polypropylene (sample 3 and sample 4), showing that the highest isotactic sequence lengths of homo-polypropylene (sample 1 and sample 2) were longer than those of co-polypropylene (sample 3 and sample 4). What is more interesting is that the relative contents of peak 1 for the highest isotactic component in the molecular chain of homo-polypropylene (sample 1 and sample 2) were lower than those of co-polypropylene (sample 3 and sample 4), which showed the microstructure differences in molecular chain of different kind of PP. As the Tables 5 and 6 showed, the lamellar thicknesses of the higher or lower isotactic component in the molecular chain of homo-polypropylene (sample 1 and sample 2) were slightly smaller than those of co-polypropylene (sample 3 and sample 4) while the relative contents of the peaks (peak 2, peak 3, peak 4, and peak 5) for the higher or lower isotactic component in the molecular chain of co-polypropylene (sample 3 and sample 4) of homo-polypropylene (sample 1 and sample 2) were much greater than those of co-polypropylene (sample 3 and sample 4), indicating that the highest isotactic sequence lengths of homo-polypropylene (sample 1 and sample 2) were longer. And the relative contents of high melt peaks (≥160 °C) of co-polypropylene (sample 3 and sample 4) was very different compared to homo-polypropylene (sample 1 and sample 2), illustrating the polar copolymer monomer had a great influence on the high isotactic component in co-polypropylene microstructure.
Furthermore, the statistical parameters relating to the lamellar thickness, the arithmetic average Ln, weighted average Lw, and the broadness index I, were calculated using the equations as follows:51
where ni represented as the normalized peak area, and Li stood for the lamellar thickness for each fraction. The results of all samples were listed in Table 7.
| Samples | Ln/(nm) | Lw/(nm) | I = Lw/Ln |
|---|---|---|---|
| Sample 1 | 17.29 | 20.10 | 1.16 |
| Sample 2 | 17.14 | 19.97 | 1.17 |
| Sample 3 | 18.11 | 20.16 | 1.11 |
| Sample 4 | 18.56 | 19.91 | 1.10 |
Table 7 showed that the arithmetic average lamellar thicknesses of homo-polypropylene (sample 1 and sample 2) were a little thinner than those of co-polypropylene (sample 3 and sample 4), and the statistical broadness index I of the lamellar thickness distribution of homo-polypropylene samples was wider, suggesting that the isotactic sequence length of homo-polypropylene (sample 1 and sample 2) was not only longer as listed in Table 6, but also the isotactic sequence length distribution of homo-polypropylene samples was broader than that of co-polypropylene samples.
Conclusions
In order to study the microstructure difference between the homo-polypropylene and co-polypropylene, the stereo-defects and its distribution of four homo- and co-polypropylene samples were studied through the correct design SSA, and other characterization ways such as DSC, GPC, and TREF, respectively. Firstly, the preliminary characterization found that the homo-polypropylene or co-polypropylene samples had the similar mechanical and thermal properties, and the SSA results also revealed the internal microstructure of the different kinds of polypropylene was almost exactly the same, representing the similar isotactic sequence length, the fractions weight of the isotactic sequence, and the isotactic sequence length distribution of the same kind of polypropylene. Compared with the homo-polypropylene, the DSC, GPC, and TREF tests indicated there were different properties of the co-polypropylene samples, revealing the differences in molecular chain microstructure. The SSA results after the correction of Ts for each sample displayed there were obvious differences in the (statistical) lamellar thickness and its distribution and the fractions weight of different fractions after SSA treatment, further proving the microstructure difference in the isotactic sequence length, and the isotactic sequence length distribution of homo- and co-polypropylene samples. Besides, the correct design SSA also indicated the polar copolymer monomer had a great influence on the high isotactic component in co-polypropylene microstructure.Acknowledgements
This work was financially supported by the Fundamental Research Funds for the Central Universities of China (Program No. 2662015DQ044).Notes and references
- J. Qiao, M. Guo, L. Wang, D. Liu, X. Zhang, L. Yu, W. Song and Y. Liu, Polym. Chem., 2011, 2, 1611–1623 RSC.
- H. F. Chang, Y. Ma, W. Liang and S. Lai, RSC Adv., 2016, 6, 26775–26782 RSC.
- G. Venugopal, J. Moore, J. Howard and S. Pendalwar, J. Power Sources, 1999, 77, 34–41 CrossRef CAS.
- J. Kang, F. Yang, T. Wu, H. L. Li, D. M. Liu, Y. Cao and M. Xiang, J. Appl. Polym. Sci., 2012, 125, 3076–3083 CrossRef CAS.
- H. F. Chang, S. T. Ren, T. Zheng, X. F. Dang, Y. Yang, L. Y. Zhang and H. Y. Li, Acta Polym. Sin., 2013, 199–207 CAS.
- C. H. Zhang, Y. G. Shangguan, R. F. Chen, Y. Z. Wu, F. Chen, Q. A. Zheng and G. H. Hu, Polymer, 2010, 51, 4969–4977 CrossRef CAS.
- J. Kang, F. Yang, T. Wu, H. L. Li, Y. Cao and M. Xiang, Eur. Polym. J., 2012, 48, 425–434 CrossRef CAS.
- H. F. Chang, S. T. Ren, X. F. Dang, L. Y. Zhang, H. Y. Li and Y. L. Hu, J. Appl. Polym. Sci., 2013, 129, 1026–1035 CrossRef CAS.
- J. Kang, Y. Cao, H. Li, J. Li, S. Chen, F. Yang and M. Xiang, J. Polym. Res., 2012, 19, 1–11 CrossRef CAS.
- C. Zhang, Y. Shangguan, R. Chen and Q. Zheng, J. Appl. Polym. Sci., 2011, 119, 1560–1566 CrossRef CAS.
- A. J. Müller, Z. H. Hernandez, M. L. Arnal and J. J. Sanchez, Polym. Bull., 1997, 39, 465–472 CrossRef.
- A. J. Müller, A. T. Lorenzo and M. L. Arnal, Macromol. Symp., 2009, 277, 207–214 CrossRef.
- A. J. Müller and M. L. Arnal, Prog. Polym. Sci., 2005, 30, 559–603 CrossRef.
- A. J. Müller, M. L. Arnal, A. L. Spinelli, E. Canizales, C. C. Puig and H. Wang, Macromol. Chem. Phys., 2003, 204, 1497–1513 CrossRef.
- A. J. Müller, V. Balsamo, M. L. Arnal, T. Jakob, H. Schmalz and V. Abetz, Macromolecules, 2002, 35, 3048–3058 CrossRef.
- M. L. Arnal, E. Canizales and A. J. Müller, Polym. Eng. Sci., 2002, 42, 2048–2063 CAS.
- M. L. Arnal, V. Balsamo, G. Ronca, A. Sanchez, A. J. Müller, E. Canizales and C. U. de Navarro, J. Therm. Anal. Calorim., 2000, 59, 451–470 CrossRef CAS.
- A. T. Lorenzo, M. L. Arnal, J. J. Sanchez and A. J. Müller, J. Polym. Sci., Part B: Polym. Phys., 2006, 44, 1738–1750 CrossRef CAS.
- D. Cavallo, A. T. Lorenzo and A. J. Müller, J. Polym. Sci., Part B: Polym. Phys., 2016, 54, 2200–2209 CrossRef CAS.
- A. T. Lorenzo, M. L. Arnal, A. J. Müller, M. C. Lin and H. L. Chen, Macromol. Chem. Phys., 2011, 212, 2009–2016 CrossRef CAS.
- R. M. Michell, A. J. Müller, G. Deshayes and P. Dubois, Eur. Polym. J., 2010, 46, 1334–1344 CrossRef CAS.
- C. J. Perez, N. Villarreal, J. M. Pastor, M. D. Failla, E. M. Valles and J. M. Carella, Polym. Degrad. Stab., 2009, 94, 1639–1645 CrossRef CAS.
- M. F. J. Pijpers and V. B. F. Mathot, J. Therm. Anal. Calorim., 2008, 93, 319–327 CrossRef CAS.
- J. Chau and J. Teh, J. Therm. Anal. Calorim., 2005, 81, 217–223 CrossRef CAS.
- M. Białek, K. Czaja and B. Sacher-Majewska, Thermochim. Acta, 2005, 429, 149–154 CrossRef.
- V. Virkkunen, P. Laari, P. Pitkänen and F. Sundholm, Polymer, 2004, 45, 3091–3098 CrossRef CAS.
- V. Virkkunen, P. Laari, P. Pitkänen and F. Sundholm, Polymer, 2004, 45, 4623–4631 CrossRef CAS.
- H. F. Chang, H. Y. Li, T. Zheng, Q. Zhou, L. Y. Zhang and Y. L. Hu, J. Polym. Res., 2014, 21, 1–11 CAS.
- J. Kong, X. D. Fan, Y. C. Xie and W. Q. Qiao, J. Appl. Polym. Sci., 2004, 94, 1710–1718 CrossRef CAS.
- P. Starck, K. Rajanen and B. Lofgren, Thermochim. Acta, 2003, 395, 169–181 CrossRef CAS.
- J. Nicolas, N. Villarreal, I. Gobernado-Mitre, J. C. Merino and J. M. Pastor, Macromol. Chem. Phys., 2003, 204, 2212–2221 CrossRef CAS.
- Q. Zhou, A. L. Wang, H. Y. Li, Z. Luo, T. Zheng, L. Y. Zhang and Y. L. Hu, RSC Adv., 2016, 6, 75023–75031 RSC.
- E. B. Bond, J. E. Spruiell and J. S. Lin, J. Polym. Sci., Part B: Polym. Phys., 1999, 37, 3050–3064 CrossRef CAS.
- G. Morini, E. Albizzati, G. Balbontin, I. Mingozzi, M. C. Sacchi, F. Forlini and I. Tritto, Macromolecules, 1996, 29, 5770–5776 CrossRef CAS.
- Y. D. Fan, C. Y. Zhang, Y. H. Xue, X. Q. Zhang, X. L. Ji and S. Q. Bo, Polymer, 2011, 52, 557–563 CrossRef CAS.
- T. Zheng, Q. Zhou, Q. Li, H. Y. Li, L. Y. Zhang and Y. L. Hu, RSC Adv., 2015, 5, 9328–9336 RSC.
- Y. H. Xue, Y. D. Fan, S. Q. Bo and X. L. Ji, Eur. Polym. J., 2011, 47, 1646–1653 CrossRef CAS.
- I. Suarez, M. J. Caballero and B. Coto, Eur. Polym. J., 2011, 47, 171–178 CrossRef CAS.
- A. J. Müller, R. M. Michell, R. A. Pérez and A. T. Lorenzo, Eur. Polym. J., 2015, 65, 132–154 CrossRef.
- B. Fillon, J. C. Wittmann, B. Lotz and A. Thierry, J. Polym. Sci., Part B: Polym. Phys., 1993, 31, 1383–1393 CrossRef CAS.
- H. F. Chang, Y. Zhang, S. T. Ren, X. F. Dang, L. Y. Zhang, H. Y. Li and Y. L. Hu, Polym. Chem., 2012, 3, 2909–2919 RSC.
- T. F. J. Pijpers, V. B. F. Mathot, B. Goderis, R. L. Scherrenberg and E. W. van der Vegte, Macromolecules, 2002, 35, 3601–3613 CrossRef CAS.
- E. P. Moore, Polypropylene Handbook: Polymerization, Characterization, Properties, Processing, Applications, Hanser Publishers, 1996 Search PubMed.
- J. Brandrup and E. H. Immergut, Polymer Handbook, Wiley, New York, 3rd edn, 1989 Search PubMed.
- D. J. Blundell, A. Keller and A. J. Kovacs, J. Polym. Sci., Part C: Polym. Lett., 1966, 4, 481–486 CrossRef CAS.
- S. J. Song, P. Y. Wu, J. C. Feng, M. X. Ye and Y. L. Yang, Polymer, 2009, 50, 286–295 CrossRef CAS.
- T. Garoff, V. Virkkunen, P. Jaaskelainen and T. Vestberg, Eur. Polym. J., 2003, 39, 1679–1685 CrossRef CAS.
- U. W. Gedde, Polymer physics, Chapman & Hall, London, 1995 Search PubMed.
- M. Iijima and G. Strobl, Macromolecules, 2000, 33, 5204–5214 CrossRef CAS.
- A. Wlochowicz and M. Eder, Polymer, 1984, 25, 1268–1270 CrossRef CAS.
- M. Keating, I. H. Lee and C. S. Wong, Thermochim. Acta, 1996, 284, 47–56 CrossRef CAS.
| This journal is © The Royal Society of Chemistry 2017 |


