 Open Access Article
Creative Commons Attribution 3.0 Unported Licence
Solvothermal fabrication and growth behavior study of spherical MnFe2O4 through a bottom-up method on wood substrate with effective microwave absorption
Hanwei Wanga,
Chao Wanga,
Ye Xionga,
Qiufang Yaoa,
Qing Changa,
Yipeng Chena,
Chunde Jinab and
Qingfeng Sun *ab
*ab
aSchool of Engineering, Zhejiang A&F University, Lin'an, China. E-mail: qfsun@zafu.edu.cn; Fax: +86-571-63732601; Tel: +86-571-63732601
bKey Laboratory of Wood Science and Technology, Lin'an, China
First published on 9th May 2017
Abstract
Spherical MnFe2O4 colloidal nanocrystal assemblies (CNAs) with different sizes were controllably fabricated on a wood substrate using a solvothermal method through a bottom-up pathway. The sizes of the spherical MnFe2O4, which ranged from 50 nm to 360 nm, could be simply adjusted by a synthetic reagent in the MnFe2O4 CNAs solution composed of primary crystalline with sizes of 12.7–32.4 nm. By studying the fabrication and growth behaviors of spherical MnFe2O4 during the solvothermal reaction, the MnFe2O4/wood composite was successfully synthesized with effective microwave absorption property. Moreover, the as-prepared MnFe2O4/wood hybrids exhibited an effective microwave absorption bandwidth and the minimum reflection loss of composite reached −12 dB at 15.52 GHz.
1. Introduction
Nowadays, with the rapid development of electronic equipment in the commercial, military, and scientific fields and the extensive use of various electronic devices in daily life, microwave interference (EMI) pollution, which interferes with the smooth operation of electronic devices as well as the health of human beings, has become a serious problem.1–3 To overcome the troubles caused by EMI pollution, considerable efforts have been dedicated to develop highly efficient microwave absorption materials with low density, low thickness, and strong absorption over a broad frequency range.4 Traditional materials used to prevent EMI pollution are mainly metal powder, graphite or ferrite.5,6 These materials are generally prone to oxidization, have low/poor acid resistance, and easily lose their efficiency after long use. With the development of nanotechnology, a great deal of nanomaterials have been explored to act as effective microwave absorbers, including γ-Fe2O3,7,8 Fe3O4,9,10 ZnO,11 CuS,12 MnO2,13 ZnFe2O4,14,15 CoFe2O4,16 and MnFe2O4.17 Researchers have demonstrated that nanomaterials having a very low content ratio could form an ideal shield against EMI pollution. Among these nanomaterials, spinel MnFe2O4 has received great interest in preventing EMI pollution as a microwave absorption material because of its excellent magnetic performance, thermal stability, photoelectrochemical behavior, and relative nontoxicity.18–22Wood is perhaps nature's most wonderful gift to humanity, its versatile character providing unlimited scope for property manipulation and product development to suit diverse applications.23–25 Aesthetic superiority, uniform finish, property enhancement, and reduced maintenance have made wood an attractive substitute for costly metals and alloys in large-scale applications in many industries. However, compared to traditional microwave absorption materials, wood is nonmagnetic; its negative microwave absorption properties are mostly due to the dielectric loss. Therefore, magnetic wood-based composites would be useful as a new microwave-absorbing material because of its desirable physical and chemical properties, including heat and sound insulation, high ratio of strength to weight, low density, and good processability. Our previous studies have confirmed that the hydrothermal method is a facile method for the growth of inorganic nanomaterials and magnetic nanomaterials on wood surface.26–28 Herein, based on these previous foundations, a new design of magnetic wood with superior microwave absorption property is proposed using a solvothermal method. Subsequently, in the present study, MnFe2O4 as the designed object was successfully deposited on the wood substrate using the solvothermal method through a bottom-up pathway. The MnFe2O4/wood composite with effective microwave absorption was successfully synthesized by studying the fabrication and growth behaviors of spherical MnFe2O4 during the process of the solvothermal reaction. The as-prepared MnFe2O4/wood hybrids exhibited an effective microwave absorption bandwidth, and the minimum reflection loss of the composite reached −12 dB at 15.52 GHz. This MnFe2O4 can be considered as an effective microwave absorption material in indoor applications.
2. Experimental
2.1 Materials
All the chemicals were supplied by Sigma-Aldrich and used without further purification. The wood samples (Cunninghamia lanceolata) were collected from Zhejiang A&F University. Wood samples with sizes of 10 mm (length) × 10 mm (width) × 10 mm (height) were ultrasonically rinsed in deionized water, acetone and ethyl alcohol for 10 min and then dried at 80 °C for 12 h in vacuum.2.2 Synthesis of MnFe2O4 colloidal nanocrystal assemblies on a wood substrate
In a typical synthesis, FeCl3·6H2O and MnCl2·4H2O with a stoichiometric ratio of 2![[thin space (1/6-em)]](https://www.rsc.org/images/entities/char_2009.gif) :
:![[thin space (1/6-em)]](https://www.rsc.org/images/entities/char_2009.gif) 1 were dissolved in 100 mL of ethylene glycol solution under magnetic stirring at room temperature. After 10 min, different dosages of HCOONa·2H2O were added with continuous stirring until the solution became clear. The solution was labelled as M. Solutions with different dosages of HCOONa·2H2O were obtained and labelled as M1 (0.17 g), M2 (0.34 g), M3 (0.68 g), M4 (1.36 g), and M5 (2.72 g). Because of the complete absence of MnFe2O4 CNAs formed on the wood substrate when the dosage of HCOONa·2H2O was zero, this process was not discussed in the current paper. MnFe2O4 CNAs were coated on a wood substrate by dip-coating from the abovementioned M solution at a withdrawing speed of 0.1 mm s−1. After that, the obtained samples were dried at 120 °C for 10 min. This process was repeated 5 times. Subsequently, the obtained wood samples were placed into the corresponding M solutions and transferred into a 150 mL Teflon-lined autoclave. The autoclave was sealed and maintained at 130 °C for 8 h, then cooled to room temperature naturally. Finally, the prepared wood samples were removed from the solution, washed by deionized water and ethyl alcohol for 10 minutes and then dried at 45 °C for 24 hours in vacuum. The finally prepared wood samples based on the different M solutions were marked as M1W, M2W, M3W, M4W, and M5W.
1 were dissolved in 100 mL of ethylene glycol solution under magnetic stirring at room temperature. After 10 min, different dosages of HCOONa·2H2O were added with continuous stirring until the solution became clear. The solution was labelled as M. Solutions with different dosages of HCOONa·2H2O were obtained and labelled as M1 (0.17 g), M2 (0.34 g), M3 (0.68 g), M4 (1.36 g), and M5 (2.72 g). Because of the complete absence of MnFe2O4 CNAs formed on the wood substrate when the dosage of HCOONa·2H2O was zero, this process was not discussed in the current paper. MnFe2O4 CNAs were coated on a wood substrate by dip-coating from the abovementioned M solution at a withdrawing speed of 0.1 mm s−1. After that, the obtained samples were dried at 120 °C for 10 min. This process was repeated 5 times. Subsequently, the obtained wood samples were placed into the corresponding M solutions and transferred into a 150 mL Teflon-lined autoclave. The autoclave was sealed and maintained at 130 °C for 8 h, then cooled to room temperature naturally. Finally, the prepared wood samples were removed from the solution, washed by deionized water and ethyl alcohol for 10 minutes and then dried at 45 °C for 24 hours in vacuum. The finally prepared wood samples based on the different M solutions were marked as M1W, M2W, M3W, M4W, and M5W.
The dynamic growth mechanism of the MnFe2O4 CNAs formed onto the wood substrate: to illuminate the dynamic formation processes of these spherical MnFe2O4 CNAs on the wood substrate, the intermediate products were selectively collected by controlling the reaction time from the synthetic process of the MnFe2O4 CNAs-modified wood sample. Take the synthetic process of M3W as a typical sample, the precipitate as the intermediate products were collected from the autoclave after the removal of the wood sample at certain time. The intermediate product was washed with deionized water and ethyl alcohol, and dried at 80 °C for 6 hours in vacuum. The selected samples were labeled as M3W_1, M3W_3, M3W_5, and M3W_8. The numbers in the sample label indicate the duration of the reaction under solvothermal conditions (in hours). For instance, M3W_1 is the sample obtained after 1 h of the synthetic reaction.
2.3 Characterizations
The surface morphologies of the samples were characterized by scanning electron microscopy (SEM, FEI, Quanta 200) and transmission electron microscopy (TEM, FEI, Tecnai G20). Crystalline structures of the samples were identified using the X-ray diffraction technique (XRD, Rigaku, D/MAX 2200) operating using Cu Kα radiation (λ = 1.5418 Å) at a scan rate (2θ) of 4° min−1, an accelerating voltage of 40 kV and an applied current of 30 mA ranging from 10° to 80°. XPS analysis was performed using an X-ray photoelectron spectrometer (ESCALAB 250 XI, Thermofisher Co). The concentration of Mn2+ and Fe3+ in the aqueous solution was analyzed using the inductively coupled plasma (ICP) technique (Agilent ICP-MS 7500 ce, Santa Clara, CA). The magnetic properties of the composites were measured using a superconducting quantum interference device (VSM, LakeShore, Model 7404, USA) at 300 K. The microwave parameters of the samples were measured at 2–18 GHz with an AV3618 network analyzer. The reflection losses R (dB) of the composites were calculated according to the transmission line theory, using the measured data of the relative complex permeability and permittivity.3. Results and discussion
Fig. 1 shows the XRD patterns of the wood sample and the synthetic MnFe2O4 CNAs-modified wood samples. The as-made wood samples with different added dosage of the synthetic regent were named as M1W, M2W, M3W, M4W, and M5W. The diffraction peaks at 2θ values of 16° and 22° were assigned to the crystalline region of the cellulose in the wood sample29,30 (Fig. 1a). In Fig. 1c–g, new strong diffraction peaks are observed in all the as-prepared wood samples, which indicated the formation of new crystal structures on the treated wood substrate. These peaks were consistent with those of pure MnFe2O4 (Fig. 1a). These new diffraction peaks were well indexed to the cubic spinel structure of MnFe2O4 (JCPDS 10-0319). Additionally, the diffractive peaks at 2θ values of 30.3°, 35.6°, 43.3°, 57.1° and 62.8° could be attributed to the (220), (311), (400), (511) and (440) planes, respectively, of the cubic spinel MnFe2O4.31 Simultaneously, the diffractive peaks of the MnFe2O4 CNAs-modified wood samples were gradually sharper and narrower, which indicated that the crystal size of the MnFe2O4 CNAs deposited onto the wood substrate presented a gradually enlarged order. These results also could be confirmed by using the Scherrer equation.32 The calculated grain sizes of M1W, M2W, M3W, M4W, and M5W based on the measurements of the full width at half-maximum (fwhm) of the (311) peaks were about 8.2, 12.7, 17.6, 28.2, and 32.4 nm, respectively.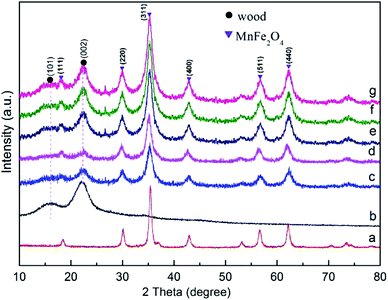 | ||
| Fig. 1 XRD patterns of (a) pure MnFe2O4, (b) wood sample, (c) M1W, (d) M2W, (e) M3W, (f) M4W and (g) M5W. | ||
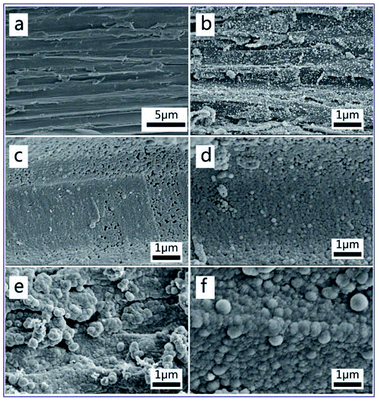
To further investigate the morphology of the MnFe2O4 CNAs deposited onto the wood substrate, we took SEM images of the wood sample and the MnFe2O4 CNAs-modified wood samples, as shown in Fig. 2. In Fig. 2a, clean and smooth wood with some pits and fibrils can be clearly observed on the pristine wood surface. Comparing Fig. 2b–f, it was observed that the spherical MnFe2O4 CNAs with different particle sizes displayed a uniform covering on the wood surface, indicating that MnFe2O4 colloidal nanocrystal assemblies (CNAs) with different submicrometer sizes could be controllably fabricated on the wood substrate using a solvothermal method through a bottom-up pathway. Meanwhile, the sizes of these MnFe2O4 CNAs increased significantly by the addition of sodium formate into the synthetic systems. In Fig. 2b–f, the average sizes were about 50, 90, 140, 155, and 360 nm for M1W, M2W, M3W, M4W, and M5W, respectively. In other words, the addition of sodium formate might lead to the increase of the MnFe2O4 CNAs deposited onto the wood substrate. This phenomenon implied that these MnFe2O4 CNAs were formed on the wood substrate from the assembly of large nanocrystals, which were similar to those previously reported.
XPS analysis was also performed to gain further understanding of the mechanism of interfacial bonding between the wood substrate and MnFe2O4. Fig. 3a shows the wide XPS spectrum of the wood and M3W. The survey-scan spectrum of the M3W revealed the presence of Mn, Fe, O and C. Among them, C and some O may originate from the wood substrate and the MnFe2O4 CNAs provided Mn, Fe and other O. In the spectrum, the largest carbon peak was by far the strongest, resulting from the photoelectrons ejected from the oxygen 1s orbital. Similarly, several oxygen peaks were observed and the O 1s predominates.
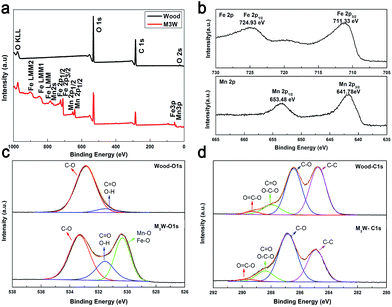 | ||
| Fig. 3 (a) Survey-scan XPS spectra of the wood and M3W. (b) Fe 2p and Mn 2p XPS spectra of M3W, (c) O 1s and (d) C 1s XPS spectra of wood and M3W. | ||
Fig. 3b shows the Fe 2p spectrum and the Mn 2p spectrum. The binding energies of 724.93 eV and 711.33 eV for Fe 2p were ascribed to Fe 2p1/2 and Fe 2p3/2, respectively, indicating the presence of Fe3+ cations.33 Then, the binding energies of 653.48 eV and 641.78 eV for Mn 2p could be ascribed to Mn 2p1/2 and Mn 2p3/2 of Mn2+, respectively.33 The atomic ratio of Fe and O was about 2.6![[thin space (1/6-em)]](https://www.rsc.org/images/entities/char_2009.gif) :
:![[thin space (1/6-em)]](https://www.rsc.org/images/entities/char_2009.gif) 1, suggesting that the MnFe2O4 CNAs were successfully located on the wood substrate.
1, suggesting that the MnFe2O4 CNAs were successfully located on the wood substrate.
Fig. 3c presents two types of oxygen species in the O 1s spectrum of the wood and M3W samples. The O 1s spectrum was divided into two in the wood-O 1s spectrum. The dominant peak in this spectrum at 533.98 eV was ascribed to the carbon–oxygen bond from cellulose, hemicellulose and lignin on the wood substrate. The other weak peak at 531.5 eV was attributed to oxygen in the OH groups, including the adsorbed water and free hydroxyl of the cellulose. The broad peak of the M3W–O 1s spectrum could be fitted by three peaks at binding energies of 533.33, 531.55 and 530.33 eV, respectively. Among them, the peak in the M3W spectrum at 530.33 eV was attributed to the metal–oxygen bond such as Fe–O and Mn–O from the MnFe2O4 CNAs.34 Comparing the wood sample, the peak in the M3W spectrum at 531.55 eV appeared, which could be assigned to hydroxyl bonded on metal (M–OH) (M: Mn or Fe). Therefore, these results also provided the basis for the wood substrate combining with the MnFe2O4 CNAs by forming hydrogen bonds during the absorption process.
Fig. 3d illustrates the C 1s spectrum, which shows four types of carbon species. The peaks at 289.20 eV (wood) and 289.65 eV (M3W) correspond to the carboxyl functional group O![[double bond, length as m-dash]](https://www.rsc.org/images/entities/char_e001.gif) C–O, which originates from the hemicellulose, lignin and fatty acid extracts on the wood substrate. Similarly, the peaks at 288.41 eV, 286.84 eV and 284.90 eV on the M3W spectrum were assigned to the O–C–O or C
C–O, which originates from the hemicellulose, lignin and fatty acid extracts on the wood substrate. Similarly, the peaks at 288.41 eV, 286.84 eV and 284.90 eV on the M3W spectrum were assigned to the O–C–O or C![[double bond, length as m-dash]](https://www.rsc.org/images/entities/char_e001.gif) O bonds, C–O bonds and C–C bonds, respectively, which were derived from the three main components of the wood substrate. Among them, the O
O bonds, C–O bonds and C–C bonds, respectively, which were derived from the three main components of the wood substrate. Among them, the O![[double bond, length as m-dash]](https://www.rsc.org/images/entities/char_e001.gif) C–O and C–C peaks were obviously weaker after the solvothermal process, which possibly implied that the fatty acids in the wood had been dissolved under the alkaline conditions and provided a higher polarity and surface activity of wood.
C–O and C–C peaks were obviously weaker after the solvothermal process, which possibly implied that the fatty acids in the wood had been dissolved under the alkaline conditions and provided a higher polarity and surface activity of wood.
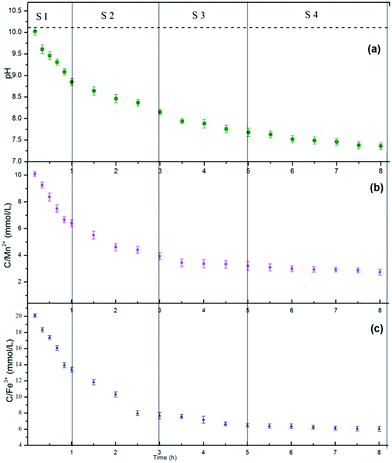
The compositions of the reaction media are essential to understand the dynamic evolution processes of the MnFe2O4 CNAs formed onto the wood substrate via a bottom-up method. For the M3W sample with 0.68 g sodium formate, the changes in the compositions in the media during the reaction time were measured, and the obtained dynamic compositional changes together with the corresponding crystal structures and morphological images were used to demonstrate the formation mechanism of the MnFe2O4 CNAs formed on the wood substrate. Fig. 4 exhibits the dynamic compositional changes of the reaction media during the solvothermal synthesis of MnFe2O4 CNAs on the wood substrate. The entire reaction process was divided into four development stages (S1: 0–1 h; S2: 1–3 h; S3: 3–5 h; S4: 5–8 h) according to the preset reaction duration. Apparently, irrespective of the pH values in the reaction media or the total concentrations of the manganese ions and iron species, the trends of the dynamic compositional changes were all similar, which first rapidly decreased and then slowly appeared stable. For the S1 stage, the pH, the concentration of manganese ions, and the iron species rapidly decreased (Fig. 4a–c). The pH values decreased rapidly from the initial value of 10.02 to 8.85; the manganese ions and iron species nearly followed the stoichiometric ratio of 2![[thin space (1/6-em)]](https://www.rsc.org/images/entities/char_2009.gif) :
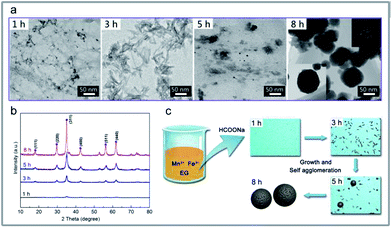
:![[thin space (1/6-em)]](https://www.rsc.org/images/entities/char_2009.gif) 1. The corresponding morphological images and the diffraction features are given in Fig. 5a (1 h) and Fig. 5b (1 h). As depicted in Fig. 5a (1 h), flocculent products with no specific shape were obtained. Hardly any diffraction peaks could be observed, as shown in Fig. 5b (1 h). Such dramatic compositional changes were due to the rapid formation of complex ions of Mn2+ and Fe3+ in the alkaline surrounding, as shown in eqn (1).35
1. The corresponding morphological images and the diffraction features are given in Fig. 5a (1 h) and Fig. 5b (1 h). As depicted in Fig. 5a (1 h), flocculent products with no specific shape were obtained. Hardly any diffraction peaks could be observed, as shown in Fig. 5b (1 h). Such dramatic compositional changes were due to the rapid formation of complex ions of Mn2+ and Fe3+ in the alkaline surrounding, as shown in eqn (1).35
| Mn2+ + 2Fe3+ + 8OH− → MnFe2O4 + 4H2O | (1) |
When the reaction proceeded to S2 (1 h to 3 h), the pH values, the concentration of manganese ions, and the iron species decreased less rapidly (Fig. 4a–c). The corresponding morphological images and the diffraction features are given in Fig. 5a (3 h) and Fig. 5b (3 h). In Fig. 5a (3 h), some spindle-like or sheet-like shapes were visible, accompanied with an obvious tendency for agglomeration. In Fig. 5b (3 h), weak diffraction peaks belonging to MnFe2O4 (JCPDS 10-0319) could be observed, suggesting that phase transformation occurred from the ferric oxide to the manganese ferrite phase during the continuous synthesis process.
In stage S3 shown in Fig. 4a–c, the pH values, the concentration of manganese ions, and the iron species gradually decreased to a further stable level. The corresponding TEM images in Fig. 5a (5 h) show some nanoparticles and less spherical MnFe2O4 CNAs were clearly observed. Obviously, the diffraction peaks in Fig. 5b (5 h) become much stronger than those shown in Fig. 5b (1 h) and Fig. 5b (3 h). Combining all the analyzed results, it is observed that the spherical MnFe2O4 CNAs has already formed, which might undergo the process of dissolution-reorganization-formation.
When the reaction time was increased from 5 h to 8 h, the changes in the reaction solution composition was found to be insignificant, which suggests a steady-state of MnFe2O4 was reached (Fig. 4a–c). Moreover, a pure manganese ferrite phase with distinct and strong diffraction peaks was obtained, as shown in Fig. 5b (8 h). Furthermore, only spherical MnFe2O4 CNAs with about 150 nm were clearly obtained, which was in good agreement with the SEM results (Fig. 1d). Furthermore, the surface of these ferrite CNAs was found to be enclosed by the MnFe2O4 nanoparticles, as shown in the enlarged TEM image in the inset in Fig. 5a (8 h). In the upper right corner in Fig. 5a (8 h), the selected area electron diffraction (SAED) patterns of M3W_8 showed bright arc-like diffraction spots with an elliptical shape, which was the diffraction characteristics of the CNAs of manganese ferrite and magnetite. It was also demonstrated that the MnFe2O4 CNAs of M3W_8 was constructed by the ordered assembly of primary crystal grains with a size of about 18.2 nm calculated by the corresponding XRD results in Fig. 5b (8 h). According to the Ostwald ripening rule, the growth of the spherical MnFe2O4 particles occurs at the expense of the spindle-like or sheet-like structures. The high surface energy of these small particles was reduced through preferred orientations under the solvothermal condition. Certainly, the electrostatic interactions between the manganese ions and the iron species also play an important role in the formation of manganese ferrite nanoparticle clusters. With the reaction duration extended, the submicrometer uniform MnFe2O4 CNAs finally formed and matured. Based on all the characterizations and analyses discussed above, the formation mechanisms of the CNAs were proposed and are illustrated in Fig. 5c.
According to the previous results, the possible formation mechanism of the MnFe2O4 CNAs deposited onto the wood substrate is illustrated in Fig. 6. Initially, when the precursors were dissolved in ethylene glycol, a large amount of Mn2+ and Fe3+ ions were produced (Fig. 6a). With the addition of sodium formate, the Mn2+ and Fe3+ ions transformed into Mn hydroxides and Fe hydroxides under alkaline condition, respectively (Fig. 6b). Upon undergoing the solvothermal process, the Mn/Fe hydroxides were associated with the pre-processed wood substrate that after dip-coating treatment continued to grow and form the cubic spinel MnFe2O4 as the synthesis advanced (Fig. 6c). Because of the high surface activity and large surface-to-volume atomic ratio, the crystal MnFe2O4 interacted with the plentiful hydroxyl groups of wood through the hydrogen bonds and electrostatic attraction (Fig. 6d). Hence, spherical MnFe2O4 CNAs were successfully located on the wood substrate by a low temperature solvothermal reaction process.
 | ||
| Fig. 6 Schematic of the formation mechanism of MnFe2O4 deposited onto the wood substrate. (a–c) The formation process of the MnFe2O4/wood composite. | ||
Fig. 7 shows the magnetization–hysteresis (M–H) curves of magnetic wood at 298 K. It was observed that the saturation magnetization of M1W, M2W, M3W, M4W and M5W were 9.06 emu g−1, 15.56 emu g−1, 19.64 emu g−1, 20.32 emu g−1 and 25.17 emu g−1, respectively, and all of them exhibited extremely small hysteresis loops and low coercivity. In general, the magnetic wood showed a typical soft magnet behavior. As the inset shows, the results revealed that the wood sample did not show a response to a magnet. Contrary to that, the M3W sample could be easily removed from the desktop by a magnet, which exhibited a sensitive magnetic response.
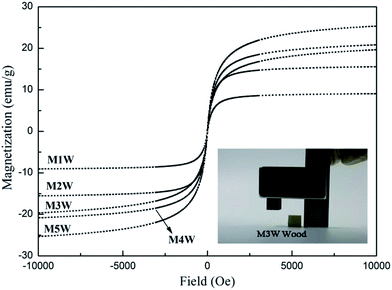 | ||
| Fig. 7 Magnetization curves of M1W, M2W, M3W, M4W and M5W, and the inset shows a photograph of M3W and the pristine wood was attracted by a magnet. | ||
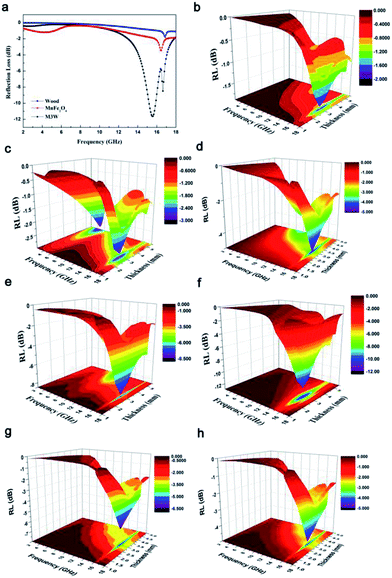
In order to investigate the microwave absorption property of these samples, the reflection loss (RL) values were evaluated according to the transmission line theory.8
 | (2) |
 | (3) |
4. Conclusions
In summary, spherical MnFe2O4 colloidal nanocrystal assemblies were successfully deposited on a wood substrate via a solvothermal method through a bottom-up pathway. The spherical MnFe2O4 with size scales ranging from 50 nm to 360 nm could be simply adjusted through the amount of synthetic reagent (HCOONa·2H2O) added at 130 °C for 8 h. As the dosages of HCOONa·2H2O increased, the degree of MnFe2O4 layer density and average sizes of the MnFe2O4 nanoparticles gradually increased. This formation mechanism of MnFe2O4 deposited on the wood substrate also was systematically discussed through the dynamic evolution of the MnFe2O4 intermediates at different reaction times. More importantly, the as-prepared MnFe2O4/wood hybrids exhibited an effective microwave absorption bandwidth and the minimum reflection loss of the composite reached −12 dB at 15.52 GHz. This material might be applied in indoor building materials or decoration materials and play a positive role in reducing indoor electromagnetic radiation pollution as a microwave absorption material.Acknowledgements
This research was supported by the Zhejiang Provincial Natural Science Foundation of China under Grant No. LZ15C160002, the Scientific Research Foundation of Zhejiang A&F University (Grant No. 2014FR077), the Special Fund for Forest Scientific Research in the Public Welfare (Grant No. 201504501), and the Fund for Innovative Research Team of Forestry Engineering Discipline (101-206001000713).Notes and references
- R. C. Che, L. M. Peng, X. F. Duan, Q. Chen and X. L. Liang, Adv. Mater., 2004, 16, 401 CrossRef CAS.
- X. Chen, J. Liu, Z. Zhang and F. Pan, Mater. Des., 2012, 42, 327 CrossRef CAS.
- Y. Naito and K. Suetake, Application of Ferrite To Electromagnetic Wave Absorber And Its Characteristics, IEEE Trans. Microwave Theory Tech., 1971, 19, 65 CrossRef.
- S. P. Pawar, M. Gandi, C. Saraf and S. Bose, J. Mater. Chem. C, 2016, 4, 4954 RSC.
- S. Chandrasekaran, T. Basak and S. Ramanathan, J. Mater. Process. Technol., 2011, 211, 482 CrossRef CAS.
- K. S. M. Salih, P. Mamone, G. Dörr, T. O. Bauer, A. Brodyanski, C. Wagner, M. Kopnarski, R. N. K. Taylor, S. Demeshko and F. Meyer, Chem. Mater., 2013, 25, 1430 CrossRef CAS.
- Y. Chen, X. Liu, X. Mao, Q. Zhuang, Z. Xie and Z. Han, Nanoscale, 2014, 66, 440 Search PubMed.
- G. Sun, B. Dong, M. Cao, B. Wei and C. Hu, Chem. Mater., 2011, 23, 1587 CrossRef CAS.
- Y. Du, W. Liu, R. Qiang, Y. Wang, X. Han, J. Ma and P. Xu, ACS Appl. Mater. Interfaces, 2014, 6, 12997 CAS.
- V. C. Schwindt, J. S. Ardenghi, P. Bechthold and E. A. González, Appl. Surf. Sci., 2014, 315, 252 CrossRef CAS.
- H. Li, Y. Huang, G. Sun, X. Yan, Y. Yang, J. Wang and Y. Zhang, J. Phys. Chem. C, 2010, 114, 10088 CAS.
- B. Zhao, G. Shao, B. Fan, W. Zhao, Y. Xie and R. Zhang, J. Mater. Chem. A, 2015, 3, 10345 CAS.
- L. Wang, Y. Huang, C. Li, J. Chen and X. Sun, Phys. Chem. Chem. Phys., 2015, 17, 5878 RSC.
- A. S. Borowiak, K. Okada, T. Kanki, B. Gautier, B. Vilquin and H. Tanaka, Appl. Surf. Sci., 2015, 351, 531 CrossRef CAS.
- M. Rezvani, M. Darvish Ganji and S. Jamehbozorghi, Appl. Surf. Sci., 2015, 360, 3447 Search PubMed.
- D. Moitra, S. Hazra, B. K. Ghosh, R. K. Jani, M. K. Patra, S. R. Vadera and N. N. Ghosh, RSC Adv., 2015, 55, 1130 Search PubMed.
- M. P. Reddy, A. M. A. Mohamed, M. V. Ramana, X. B. Zhou and Q. Huang, J. Magn. Magn. Mater., 2015, 395, 185 CrossRef.
- D. Chen, Y. Zhang and Z. Kang, Chem. Eng. J., 2013, 215–216, 235 CrossRef CAS.
- Z. Han, D. Li, X. Liu, D. Geng, J. Li and Z. Zhang, J. Phys. D: Appl. Phys., 2009, 42, 55008 CrossRef.
- S. Sen, S. Konar, A. Pathak and S. Dasgupta, J. Phys. Chem. B, 2014, 118, 11667 CrossRef CAS PubMed.
- W. W. Wang, Mater. Chem. Phys., 2008, 108, 227 CrossRef CAS.
- F. Xue, J. Xiao, S. Yang, H. He and S. Cheng, Appl. Catal., B, 2015, 162, 544 CrossRef.
- W. Gan, L. Gao, Q. Sun, C. Jin, Y. Lu and J. Li, Appl. Surf. Sci., 2015, 332, 565 CrossRef CAS.
- M. Liu, Q. Yan, Y. Wu, J. Liang and S. Luo, Appl. Surf. Sci., 2015, 330, 332 CrossRef CAS.
- S. Migneault, A. Koubaa, P. Perré and B. Riedl, Appl. Surf. Sci., 2015, 34, 311 Search PubMed.
- C. Jin, Q. Yao, J. Li, B. Fan and Q. Sun, Mater. Des., 2015, 85, 205 CrossRef CAS.
- Q. Sun, Y. Lu and Y. Liu, J. Mater. Sci., 2011, 46, 7706 CrossRef CAS.
- Q. Sun, L. Yun, H. Zhang, H. Zhao, H. Yu, J. Xu, Y. Fu, D. Yang and Y. Liu, Mater. Chem. Phys., 2012, 133, 253 CrossRef CAS.
- J. Li, Y. Lu, D. Yang, Q. Sun, Y. Liu and H. Zhao, Biomacromolecules, 2011, 12, 1860 CrossRef CAS PubMed.
- J. Li, H. Yu, Q. Sun, Y. Liu, Y. Cui and Y. Lu, Appl. Surf. Sci., 2010, 256, 5046 CrossRef CAS.
- Y. Q. Wang, R. M. Cheng, Z. Wen and L. J. Zhao, Eur. J. Inorg. Chem., 2011, 42, 2942 CrossRef.
- U. Holzwarth and N. Gibson, Nat. Nanotechnol., 2011, 6, 534 CrossRef CAS PubMed.
- W. Luo, X. Hu, Y. Sun and Y. Huang, J. Mater. Chem., 2012, 22, 8916 RSC.
- H. Kim, D. H. Seo, H. Kim, I. Park, J. Hong, K. Y. Park and K. Kang, Chem. Mater., 2012, 24, 720 CrossRef CAS.
- M. Faraji, Y. Yamini and M. Rezaee, J. Iran. Chem. Soc., 2010, 7, 1 CrossRef CAS.
| This journal is © The Royal Society of Chemistry 2017 |

