 Open Access Article
Armed by Asp? C-terminal carboxylate in a Dap-branched peptide and consequences in the binding of CuII and electrocatalytic water oxidation†
Łukasz Szyrwiel‡
*a,
Dávid Lukácsb,
Dávid F. Srankób,
Zsolt Kernerb,
Aleksandra Kotyniac,
Justyna Brasuńc,
Bartosz Setnerd,
Zbigniew Szewczukd,
Katarzyna Maleca and
József S. Pap *b
*b
aDept. of Chemistry of Drugs, Wrocław Medical Univ., ul. Borowska 211, 50-552 Wrocław, Poland. E-mail: lukasz.szyrwiel@desy.de
bSurface Chemistry and Catalysis Dept., MTA Centre for Energy Research, H-1121 Budapest, Konkoly Thege str. 29-33, Hungary. E-mail: pap.jozsef@energia.mta.hu
cDept. of Inorganic Chemistry, Wrocław Medical University, ul. Borowska 211a, 50-552 Wroclaw, Poland
dFaculty of Chemistry, Univ. of Wrocław, ul. F. Joliot-Curie 14, 50-383 Wrocław, Poland
First published on 8th May 2017
Abstract
The imidazole ring of histidine (His) and the methylcarboxylate function of aspartic acid (Asp) are crucial for Cu coordination in enzymes, artificial proteins and other bioinspired systems. In order to elucidate the effect of Asp at the C-terminus, a new branched peptide, H-Gly-Dap(H-Gly)-Asp-NH2 (2GD, Dap = 2,3-diaminopropionic acid) has been synthesized to ligate CuII. While at pH < 8, 2GD favours dimeric complexes at 1![[thin space (1/6-em)]](https://www.rsc.org/images/entities/char_2009.gif) :
:![[thin space (1/6-em)]](https://www.rsc.org/images/entities/char_2009.gif) 1 metal-to-ligand ratio, at increasingly alkaline pH the Asp at the C-terminus creates a {NH2,N−,N−,O−}eq set and the dominance of mononuclear CuLH−2 and CuLH−3 species, according to potentiometry, molecular spectroscopy (UV-visible, circular dichroism and X-band electron paramagnetic resonance) and ESI-MS analysis. The changes in speciation with pH are accompanied by shifts in the CuIII/II redox current peaks that were analyzed by square wave voltammetry (SWV) and allowed the calculation of the pKa values for the CuII and CuIII forms. The 2GD complex exhibits electrocatalytic activity in water oxidation in phosphate buffer. However, when Asp residues are present at all three termini to produce 3D (H-Asp-Dap(H-Asp)-Asp-NH2), the electrocatalysis of water oxidation decreases and, if present only at the N-termini in 2DG (H-Asp-Dap(H-Asp)-Gly-NH2), it ceases. As for CuII ligated by 2GD, a TOF of ∼16 s−1 was calculated at pH = 11 in 0.2 M phosphate electrolyte, which is crucial for catalysis, but also acts as inhibitor anion according to cyclic voltammetry observations. The system is highly tolerant to the presence of chloride, which is a feature of practical importance in efficient water oxidation catalysis.
1 metal-to-ligand ratio, at increasingly alkaline pH the Asp at the C-terminus creates a {NH2,N−,N−,O−}eq set and the dominance of mononuclear CuLH−2 and CuLH−3 species, according to potentiometry, molecular spectroscopy (UV-visible, circular dichroism and X-band electron paramagnetic resonance) and ESI-MS analysis. The changes in speciation with pH are accompanied by shifts in the CuIII/II redox current peaks that were analyzed by square wave voltammetry (SWV) and allowed the calculation of the pKa values for the CuII and CuIII forms. The 2GD complex exhibits electrocatalytic activity in water oxidation in phosphate buffer. However, when Asp residues are present at all three termini to produce 3D (H-Asp-Dap(H-Asp)-Asp-NH2), the electrocatalysis of water oxidation decreases and, if present only at the N-termini in 2DG (H-Asp-Dap(H-Asp)-Gly-NH2), it ceases. As for CuII ligated by 2GD, a TOF of ∼16 s−1 was calculated at pH = 11 in 0.2 M phosphate electrolyte, which is crucial for catalysis, but also acts as inhibitor anion according to cyclic voltammetry observations. The system is highly tolerant to the presence of chloride, which is a feature of practical importance in efficient water oxidation catalysis.
Introduction
Recent research on water splitting catalysis concerns in considerable part the application of inexpensive and abundant first row transition metals.1–4 This research is driven by the aim of producing H2 as part of envisioned renewable energy storage or artificial photosynthesis systems.4–9 In such systems electrolytic water splitting can be the source of H2, if both half-cell reactions are accelerated to a reasonable rate by an electrocatalyst. According to the general opinion the bottleneck of the H2O → H2 + 0.5O2 process is the oxygen evolving reaction (OER, or water oxidation), because of the demanding conditions, e.g., extreme pH and/or high anodic polarization of the working electrode that are required for the transfer of 4e− and 4H+ in one catalytic cycle.8,10 Besides cost-effective heterogeneous catalysts based purely on inorganic salt precursors,11–13 the OER can be also accelerated by molecular electrocatalysts.14 In the latter case turnover frequency (TOF, s−1) or overpotential (η) is often correlated with ligand effects. Several Mn,15–18 Fe,19–22 Co,23,24 Ni25,26 and Cu27–41 containing complexes have been reported to promote the OER. While the homogeneous nature of catalysis has been clearly demonstrated in a number of cases, other complexes underwent changes (ligand loss, exchange and/or decomposition) and served as precursors to in situ deposited, stable electrocatalytic thin layers with characteristic activity.38,41–45 These phenomena highlight yet another field of prospective application of metal complexes, namely their use as tuneable pre-catalysts to fabricate highly active catalytic layers on electrodes. Whichever is the case, understanding the role of the pH-dependent behaviour, stability and redox properties of the metal–ligand solutions is inevitable.Polypeptides serve as the chassis of most metalloenzymes by forming a flexible pocket around the active site thus helping substrate docking, but also efficiently ligate metal ions and influence their redox properties. The listed properties all contribute to a strict control of the enzymatic function thus playing fundamental role in biocatalysis, including the Oxygen Evolving Centre (OEC) of PSII. No wonder that these bio-inspired artificial systems5,17,46 and recently, oligo- and polypeptides gained attention in the catalysis of the OER for similar reasons.47,48 The design and application of short, linear peptides inspired by enzymes is limited by the flexibility of the backbone chain and the accessibility of the α-C substituents of the amino acid residues. New coordination options for metal ions can be created by peptide branching.49–51
By the extension of the 2,3-diaminopropionic acid (Dap) branching unit with His residues we have shown that well-placed modifications may serve specific functions. Arming all three Dap branches with His led to cooperative metal binding that was manifested in a superior chelation efficiency, specific coordination modes and redox flexibility in a wide pH range.49,52 The double N-terminal Gly substitution of Dap creates an N,N′-diglycyl-1,2-ethylenediamine moiety (Scheme 1, bold fragment) that is the parent metal chelating motif. Further extension at the C-terminus with additional Gly (ligand 3G = H-Gly-Dap(H-Gly)-Gly-NH2), His (ligand 2GH = H-Gly-Dap(H-Gly)-His-NH2) (Scheme S1†),49 or now with Asp residue (Scheme 1) allow competition studies. Moreover, elongation with desirable functional sequences may result in new applications of such complexes, e.g., as intracellular metal transporters,51 potential biological chelators53 or, importantly for electrocatalysis,33 as electrode surface building blocks.48
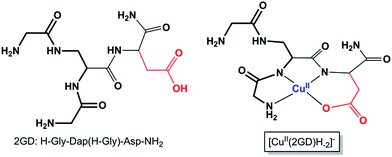 | ||
| Scheme 1 The branched peptide 2GD and the Cu(2GD)H−2 complex form (see text for discussion, the bold fragment highlights the N,N′-diglycyl-1,2-ethylenediamine moiety in 2GD). Axial ligation is omitted; see further relevant ligands in Scheme S1.† | ||
In the present study we introduce a new catalytically active Cu-branched peptide system, Cu–2GD (this form is referred to as the 1![[thin space (1/6-em)]](https://www.rsc.org/images/entities/char_2009.gif) :
:![[thin space (1/6-em)]](https://www.rsc.org/images/entities/char_2009.gif) 1 Cu–ligand complex forms in general, irrespective of the actual degree of deprotonation, which is indicated only when relevant) with a C-terminal carboxylate acting as the 4th equatorial donor group in a wide pH range. The exchange of this sole structural element in the ligand scaffold affects the metal binding affinity, the solution equilibrium properties and through that, the catalytic capabilities, and also, somewhat the adsorption affinity of the complex to the electrode surface. Importantly, the results are contrasted to 3D (H-Asp-Dap(H-Asp)-Asp-NH2) and 2DG (H-Asp-Dap(H-Asp)-Gly-NH2) (Scheme S1†), two new ligands with additional or exclusive Asp moieties at the N-termini, both muting catalysis.
1 Cu–ligand complex forms in general, irrespective of the actual degree of deprotonation, which is indicated only when relevant) with a C-terminal carboxylate acting as the 4th equatorial donor group in a wide pH range. The exchange of this sole structural element in the ligand scaffold affects the metal binding affinity, the solution equilibrium properties and through that, the catalytic capabilities, and also, somewhat the adsorption affinity of the complex to the electrode surface. Importantly, the results are contrasted to 3D (H-Asp-Dap(H-Asp)-Asp-NH2) and 2DG (H-Asp-Dap(H-Asp)-Gly-NH2) (Scheme S1†), two new ligands with additional or exclusive Asp moieties at the N-termini, both muting catalysis.
Experimental
Peptide synthesis and materials
All Fmoc amino acids, including Fmoc-L-Dap(Fmoc)-OH used as a branching amino acid, solvents and reagents were purchased from Iris Biotech GmbH (Marktredwitz, Germany) and used as received. The synthesis of the peptides H-Gly-Dap(H-Gly)-Asp-NH2, H-Gly-Gly-Asp-NH2 and H-Gly-βAla-Asp-NH2 were performed manually on Rink Amide MBHA resin (loading: 0.52 mM g−1) in a polypropylene syringe reactor (Intavis AG, Köln, Germany) equipped with polyethylene filter, according to the standard Fmoc (9-fluorenylmethoxycarbonyl) solid phase synthesis.49,52 TBTU (O-(benzotriazol-1-yl)-N,N,N′,N′-tetramethyluronium tetrafluoroborate) was used as a coupling reagent (3 eqs). Oxyma Pure (ethyl-2-cyano-2-(hydroxyl-imino)acetate) (3 eqs) and DIPEA (N,N-diisopropylethylamine) (3 eqs) were used as additives. DMF (N,N-dimethylformamide) was used as solvent. Each coupling step was performed for 2 h. The completion of each coupling was confirmed by Kaiser test. After removal of the Fmoc-protecting groups from Dap derivative with 25% piperidine in DMF a mixture of Fmoc-Gly-OH/TBTU/Oxyma Pure/DIPEA (6 eqs of each reagent) in DMF was added and stirred for 24 h. The end of the coupling was confirmed by Kaiser test. Peptides were cleaved from the resin simultaneously with the side chain deprotection using a solution of trifluoroacetic acid (TFA), water and triisopropylsilane (TIS) (95/2.5/2.5, v/v/v) at room temperature for 2 h, precipitated in cold diethyl ether and purified by the semi-preparative reversed-phase high-performance liquid chromatography (RP-HPLC). Each peptide was purified on a Varian ProStar (Palo Alto, CA, California) with UV detection (210 nm) on a TSKgel ODS-120T 12TG08eh004 column (215 × 30.0 mm, 10 μm) equipped with a TSKguard column ODS (21.5 × 7.5 mm, 10 μm), with a gradient elution of 0–80% B in A (A = 0.1% TFA in water; B = 0.1% TFA in acetonitrile/H2O, 4![[thin space (1/6-em)]](https://www.rsc.org/images/entities/char_2009.gif) :
:![[thin space (1/6-em)]](https://www.rsc.org/images/entities/char_2009.gif) 1) for 40 min (flow rate 7 mL min−1). The main peak, corresponding to the peptide, was collected and the fraction was lyophilized. The purified ligands were obtained as their trifluoroacetate salts. Their molecular weights were confirmed by ESI-MS using high-resolution mass spectrometer, Bruker micrOTOF-Q (Bruker Daltonics, Bremen, Germany). The m/z obtained for [M + H]+ ions of H-Gly-Dap(H-Gly)-Asp-NH2 and H-Gly-Gly-Asp-NH2 and H-Gly-βAla-Asp-NH2 were 333.151 (calculated 333.152) and 241.100 (calculated 241.103) and 261.117 (calculated 261.119), respectively.
1) for 40 min (flow rate 7 mL min−1). The main peak, corresponding to the peptide, was collected and the fraction was lyophilized. The purified ligands were obtained as their trifluoroacetate salts. Their molecular weights were confirmed by ESI-MS using high-resolution mass spectrometer, Bruker micrOTOF-Q (Bruker Daltonics, Bremen, Germany). The m/z obtained for [M + H]+ ions of H-Gly-Dap(H-Gly)-Asp-NH2 and H-Gly-Gly-Asp-NH2 and H-Gly-βAla-Asp-NH2 were 333.151 (calculated 333.152) and 241.100 (calculated 241.103) and 261.117 (calculated 261.119), respectively.
Complex analysis
![[thin space (1/6-em)]](https://www.rsc.org/images/entities/char_2009.gif) :
:![[thin space (1/6-em)]](https://www.rsc.org/images/entities/char_2009.gif) 1.
1.Electrocatalysis was tested by cyclic voltammetry (CV) or chronoamperometry (CA, and similarly, controlled potential electrolysis, CPE) runs either under air, or argon, but no difference was experienced in catalysis. All salts (puriss p.a. grade) were purchased from commercial sources. The complex solutions were made before the experiments from stock solutions by using a slight excess of the ligand (0.9![[thin space (1/6-em)]](https://www.rsc.org/images/entities/char_2009.gif) :
:![[thin space (1/6-em)]](https://www.rsc.org/images/entities/char_2009.gif) 1 Cu to ligand ratio) and titrating the mixture to the wished pH by 1 N NaOH. These solutions were then mixed with appropriate amounts of phosphate buffer. CV: the rinsed, polished, ultrasonicated and rinsed GC working electrode was cycled in pure buffer until the current response became uniform then the complex stock solutions (made with the same buffer) were added. Corrections were made with the CV data recorded in pure buffer under the same conditions. CA/CPE: the ITO electrodes were cleaned as published elsewhere.48 Detection of O2 was done by an Ocean Optics Neofox fluorescence probe (two-point calibrated at 0% O2 in Ar-saturated and 21% O2 in aerated solution at 25 °C, pH = 11, 0.2 M phosphate), immersed into the electrolyte saturated with air near the surface of the ITO electrode in a sealed and thermostatted cell (see Fig. S3†).
1 Cu to ligand ratio) and titrating the mixture to the wished pH by 1 N NaOH. These solutions were then mixed with appropriate amounts of phosphate buffer. CV: the rinsed, polished, ultrasonicated and rinsed GC working electrode was cycled in pure buffer until the current response became uniform then the complex stock solutions (made with the same buffer) were added. Corrections were made with the CV data recorded in pure buffer under the same conditions. CA/CPE: the ITO electrodes were cleaned as published elsewhere.48 Detection of O2 was done by an Ocean Optics Neofox fluorescence probe (two-point calibrated at 0% O2 in Ar-saturated and 21% O2 in aerated solution at 25 °C, pH = 11, 0.2 M phosphate), immersed into the electrolyte saturated with air near the surface of the ITO electrode in a sealed and thermostatted cell (see Fig. S3†).
Results and discussion
Complex speciation and characterization as a function of pH (potentiometry, molecular spectroscopy and mass spectrometry)
Mixing equivalent amounts of 2GD and CuII results in complex formation once the pH is set to above ∼4.5. Up to pH 6 the first dominant species is Cu2(2GD)2H−3 that is evolved via two proposed, minor species forms, Cu(2GD) and Cu2(2GD)2H−2 (Fig. 1). Although more detailed spectroscopic characterization of the first two complexes was impeded by their co-existence and low molar fragment in solution, their presence is implied by potentiometry. The occurrence of the dimeric Cu2(2GD)2H−2 may be related to the N,N′-diglycyl-1,2-ethylenediamine domain in 2GD (Scheme 1), which is known for similar dimer formation tendency.57Up to pH 6.6, an intermediate form between Cu2(2GD)2H−2 and Cu(2GD)H−2, the Cu2(2GD)2H−3 species becomes predominant. The stoichiometry of Cu2(2GD)2H−3 suggests that different donor patterns are likely for the two participating metal centres. The EPR parameters are remarkably similar to those for Cu(2GD)H−2 (vide infra, Fig. 3 and Table S1†) indicating the presence of three nitrogen donors in the equatorial plane. The d–d absorption is found at 559 nm that is consistent with the participation of three nitrogen donors in the equatorial plane accompanied with the COO− group in agreement with literature examples.58 The dimer is either formed through bridging by a labile axial metal–ligand interaction with a second complex unit or, by H-bonding between available donor and acceptor groups (or both). Regardless of the way of dimer formation the C-terminal Asp chelate motif should participate in both Cu-sites. In addition, CD spectra taken in this pH range strongly suggest the coordination of amine donors (Table 1). The dimeric species is unequivocally related to the presence of the additional N-terminal arm since it was not observed in case of linear tripeptides containing Asp in the third position.59
| Species | log![[thin space (1/6-em)]](https://www.rsc.org/images/entities/char_2009.gif) β β |
log![[thin space (1/6-em)]](https://www.rsc.org/images/entities/char_2009.gif) K K |
λ [nm], ε [M−1 cm−1] | λ [nm], Δε [M−1 cm−1] |
|---|---|---|---|---|
| H3(2GD) | 19.58 | 3.63(1) | ||
| H2(2GD) | 15.94 | 7.51(1) | ||
| H(2GD) | 8.43 | |||
| Cu(2GD) | 9.31(2) | Minor | ||
| Cu2(2GD)2H−2 | 12.38(2) | 5.32 | Minor | |
| Cu2(2GD)2H−3 | 6.99(3) | 559, 125 | 591, −0.64 | |
| 488, 0.11 | ||||
| 308, 0.37 | ||||
| 273, −1.208 | ||||
| 242, sh | ||||
| Cu(2GD)H−2 | −2.09(3) | 10.56 | 550, 143 | 595, −0.49 |
| 495, −0.048 | ||||
| 328, 0.11 | ||||
| 280, −0.61 | ||||
| 245, sh | ||||
| Cu(2GD)H−3 | −12.65(3) | 546, 141 | 587, −0.50 | |
| 497, −0.18 | ||||
| 315, 0.096 | ||||
| 283, −0.38 | ||||
| 244, sh |
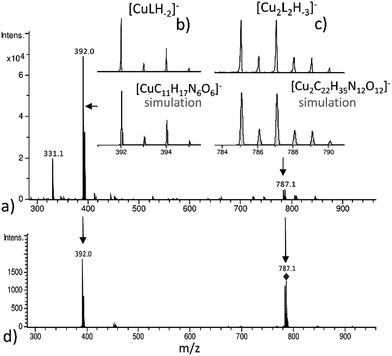
The (−)ESI-MS spectra at pH 7 indicate the coexistence of Cu(2GD)H−2 and Cu2(2GD)2H−3 (Fig. 2a). The observation of both species by means of ESI-MS is qualitative evidence to their dominance in solution. Additionally, Cu2(2GD)2H−3 shows instability in the gas phase that makes their quantification difficult. The ESI-MS/MS experiment in Fig. 2d shows that low collision energy like 5 eV induces dissociation of the dimer Cu2(2GD)2H−3 into Cu(2GD)H−2, the same species seen in experiments without fragmentation, and the substance observed by means of potentiometry. The presence of both monomeric Cu(2GD)H−2 and dimeric Cu2(2GD)2H−3 signals in the ESI-MS and ESI-MS/MS supported by potentiometry proves a fairly labile interaction between the subunits of the dimer.
Increase in pH from 7 to 9 results in the Cu2(2GD)2H−3 deprotonation and its simultaneous dissociation into the monomeric complex Cu(2GD)H−2 observed in solution and in gas phase of ESI-MS. UV-vis supports changes in the coordination sphere accordingly, the λmax shifts to 550 nm and may be assigned to the (i) dissociation of an axial donor,60 (ii) substitution of an N-terminal NH2 group with an N− donor and/or (iii) change in the overall complex structure. Simultaneously, changes in the CD spectra can be observed, especially in the region that corresponds to the Cu–NH2 charge transfer band (Table 1). X-Band EPR spectra (Fig. 3a, pH = 6.98 and 8.96) reveal the presence of seven super-hyperfine lines from the coupling with 14N nuclei. This pattern is consistent with a 3N + 1O equatorial binding mode. The axial signals with g∥ > g⊥ > ge and the characteristic ACu∥ ≫ ACu⊥ splitting pattern are typical for dx2–y2 ground state.61 More precise g-tensors, hyperfine (hf) and super-hyperfine (shf) coupling parameters were obtained by simulation.50,62,63 These data, also supported by literature findings, confirm that in Cu(2GD)H−2 the CuII is bound by a {NH2,N−,N−,COO−}eq set. Further comparison of spectroscopic parameters for CuII complexes with H-GGD-NH2 and H-GβAD-NH2, linear chain models of the N- and C-terminal arms of 2GD (Scheme S2†), bring additional information on the coordination sphere. The λmax and ε of CuII(2GD)H−2 are similar to those of the corresponding complex with H-GGD-NH2 (551 nm, 158 M−1 cm−1) and different from those of H-GβAD-NH2 (559 nm, 82 M−1 cm−1) at pH 9.5, where the maximum proportion of CuII(2GD)H−2 is observed, indicating the preference for a 5,5,6 member chelate sequence instead of 5,6,6 (Schemes S3a and 3b† respectively). In conclusion, the data allow us to unambiguously assign the equatorial plane of CuII(2GD)H−2 as presented in Scheme 1.
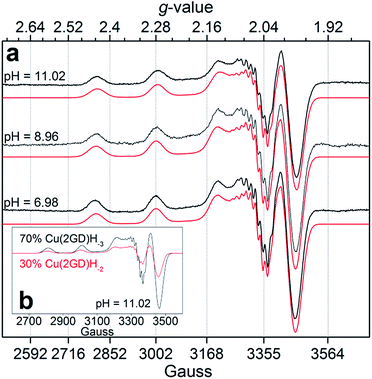 | ||
| Fig. 3 (a) Experimental X-band EPR spectra and simulations for Cu–2GD at different pH values; (b) simulated component spectra and estimated percentage of the Cu(2GD)H−2 and Cu(2GD)H−3 equilibrium species at pH = 11.02 (see Table S1† for simulation parameters). | ||
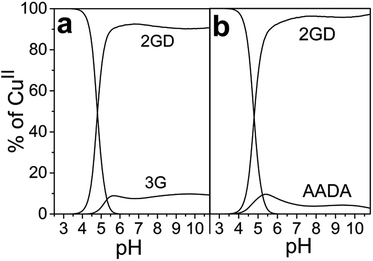
Due to the planned application of the complex as electrocatalyst for the OER attention is paid below to the speciation in the alkaline pH region. Under those conditions, λmax is different for the CuLH−2 species formed with 2GD (550 nm), 3G and 2GH (528 nm) indicating {NH2,N−,N−,NIm}eq and {NH2,N−,N−,NH2}eq for 2GH and 3G,49 and {NH2,N−,N−,COO−}eq donor set for 2GD. In addition, the g∥ = 2.2070 (Table S1†) is greater than those for the related CuLH−2 species with 3G or 2GH (typically <2.19),49 also associated with a {3N,O}eq equatorial donor arrangement in place of {4N}eq. Note that the situation remains very similar for the Cu(2GD)H−3 species that dominates above pH 10.5 (Fig. 1 and 3b). The increase of pH from 9 to 11 results in further deprotonation observed by the changes in UV-vis, (λmax shifts to 545 nm) and in CD data (Table 1), which we associate with the deprotonation of an axially coordinated water molecule in agreement with literature examples.29,49,64 Finally, we observed a considerable positive impact of the C-terminal Asp residue on the stability of its CuII complex when compared to ligand 3G (Fig. 4a). It might be supposed that the increased stability is due to the Asp residue in the 3rd position alone and could be similarly observed for linear sequences, too. However, this option can be ruled out, since 2GD shows different pH speciation profile and higher affinity for CuII than the linear H-Ala-Ala-Asp-Ala-NH2 (AADA-NH2)59 (Fig. 4b).
Electrochemical characterization of the Cu–2GD equilibrium system
The pH-dependent electrochemical analysis (SWV, between pH 7 and 11.5) of a 0.9 metal![[thin space (1/6-em)]](https://www.rsc.org/images/entities/char_2009.gif) :
:![[thin space (1/6-em)]](https://www.rsc.org/images/entities/char_2009.gif) 1.0 metal-to-ligand solution revealed changes in the redox transitions that could be rationalized by means of the above detailed speciation, i.e. the dissociation of Cu2(2GD)2H−3 into Cu(2GD)H−2 units upon deprotonation (Fig. 5), and further deprotonation of the latter species. According to the symmetric current peaks in the SW voltamograms (Fig. 5a)33,52,56 reversible CuIII/II redox transitions take place under the applied conditions.
1.0 metal-to-ligand solution revealed changes in the redox transitions that could be rationalized by means of the above detailed speciation, i.e. the dissociation of Cu2(2GD)2H−3 into Cu(2GD)H−2 units upon deprotonation (Fig. 5), and further deprotonation of the latter species. According to the symmetric current peaks in the SW voltamograms (Fig. 5a)33,52,56 reversible CuIII/II redox transitions take place under the applied conditions.
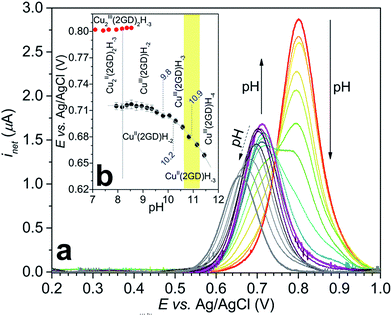 | ||
| Fig. 5 (a) Change of the CuIII/II net current peak with pH measured by SWV (see the Experimentals and Table S2† for details); (b) Pourbaix diagram generated from the SWV data for CuIII/II2(2GD)2H−3 (red circles) and CuIII/II(2GD)H−n (black circles) fitted with eqn (2) (grey curve). Further details are discussed in the text, the yellow background shows the pH range of catalysis. | ||
The current peak at pH = 7.1 (Fig. 5a, voltamogram in red) is the sole peak that is present up to pH ∼ 8. In contrast to all other, so far investigated Dap-branched metallopeptides (e.g., to those with 3G, 2GH, or 3H52), above this pH the position of the current peak is nearly unchanged, but it undergoes unsymmetrical broadening, and from pH 8.5 another, distinct peak can be observed roughly at 0.1 V lower potential (Fig. 5a, the curve in magenta represents this phase). The two Enet values of ∼0.80 V and ∼0.71 V vs. Ag/AgCl can be associated with the (III/II) transitions of cupric ions centring different donor environments, in good agreement with literature examples.56,63,65 The simultaneous presence of the current peaks indicates sluggish equilibrium between the two participating redox active species thus, in principle, can be associated with a shift in the dimer–monomer equilibrium system that was inferred by ESI-MS/MS and potentiometry results in the same pH region. Therefore we assign the two current peaks as follows: the peak at higher potential with the complex consisting of two insular and electrochemically indistinguishable CuII centres, i.e., with Cu2(2GD)2H−3 and the second peak at lower potential with Cu(2GD)H−2. The ∼0.1 V difference may result from the higher effective negative charge per cupric centre in the latter case. This assignment is further supported by the correspondence between the equilibrium pH of Cu2(2GD)2H−3 and Cu(2GD)H−2 calculated from potentiometry (pH = 8.2) and estimated from SWV data (Fig. 5b, grey vertical line, pH ∼ 8.2).
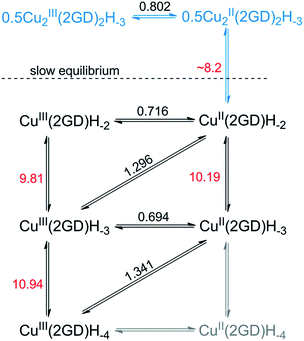
Fitting a modified Nernst equation (see ESI†) to the Enet data points (grey line in Fig. 5b) yields parameters as listed in Table 2. The pKa(red) = 10.2(3) is in satisfactory agreement with the value of 10.56 for CuII(2GD)H−2 determined independently by means of potentiometry. The data can be arranged into a stepladder scheme representing the proton-coupled electron transfer (PCET) processes (Scheme 2, protons and electrons are omitted for clarity).
Electrocatalytic application of Cu–2GD in alkaline phosphate electrolyte
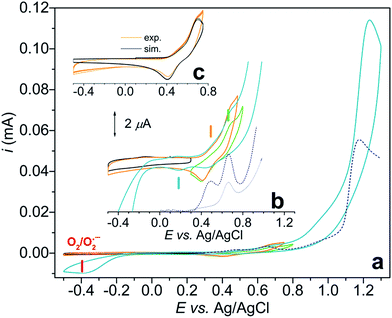
Initially we investigated a broader range of pH and measured the CV response starting from pH 8 (Fig. S1†), under argon. At this pH Cu2(2GD)2H−3 is present predominantly. Although this species exhibits a CuIII/II couple it shows no catalytic activity. Catalysis commences only from pH 10.5, reaches maximum at pH ∼ 11 and drops again from pH 11.3. In this pH range bubble formation was typically visible at the anode and the superoxide/dioxygen reduction current increased within a few cycles (Fig. 6a) in support of O2 formation (rinse test with the GCE was performed to rule out irreversible deposition of Cu-oxide solid and its contribution to catalysis, see Fig. S2†). CPE was also performed at 1.2 V vs. Ag/AgCl with indium-tin-oxide (ITO) working electrode in 0.57 mM solutions of Cu–2GD at pH = 11.02 (Fig. S3†). Dioxygen could be detected shortly after the start of CPE by a fluorescence probe (Fig. S3b†), similarly to our earlier observations.33In order to check the presence of copper at the ITO surface, X-ray photoelectron spectroscopy (XPS) was performed following 0.5 and 6 hours of electrolysis (for details see the ESI, Table S3 and Fig. S4†). A minimal deposition of Cu is evidenced with the binding energies that are typical for Cu bound in a complex and sharply different from that of deposited CuO/Cu(OH) solids.13,33,41,48 Transferring a used ITO after rinse into a fresh phosphate buffer produced a rapidly declining current during a follow-up CPE at 1.2 V vs. Ag/AgCl (Fig. S3a†). On this basis we conclude that the active catalyst is of molecular nature and solid film formation should not play role in the OER, however, reversible adhesion of the complex to the polarized electrode surface might have importance in the complex-to-electrode electron transfer process. The lower limit of the narrow pH window of activity is unambiguously associated with the occurrence of the CuII(2GD)H−3 complex form (pKa ∼ 10.2–10.56) and the maximal activity falls in the pH domain of CuIII(2GD)H−4 (pKa(ox2) = 10.9, Fig. 5b). This strongly suggests that the catalytic cycle involves these complex forms. The decline in activity at higher pH can be associated with the dual role of phosphate as demonstrated by a recent literature example on a Ni-complex.25 The crucial role of phosphate is also apparent from the dependence of the catalytic current peak on the concentration of this electrolyte. The dependence at pH = 11 shows maximum at 0.2 M (Fig. S5†) and drops upon further increase of phosphate concentration. Moreover, the low current region of the CV curves under catalytic conditions reveals features that are consistent with an inhibited complex form (Fig. 6b).
CV scans of a 0.57 mM solution of Cu–2GD were taken from 0.3 to 0.8 V (green curve), from −0.5 to 0.75 (orange curve) and finally, from −0.5 to 1.3 V vs. Ag/AgCl (blue curve) under argon.
In the latter potential range the typical catalytic current peak at ∼1.2 V and a cathodic current peak roughly at −0.4 V (associated with the O2/O2˙− couple)27,66 are clearly seen. The blown-up view of the same current traces that show the split of the CuIII/II redox transitions are seen in Fig. 6b.
SW voltammograms (dashed blue lines in Fig. 6a and b) recorded in the same phosphate electrolyte corroborate with the results of CV and show current peaks at 0.48 and 0.66 V. Note that the CuIII/II transition occurs at 0.67 V as a sole peak in the absence of phosphate (grey SWV curve in Fig. 6b). Therefore the latter peak can be associated with the PCET process of CuII(2GD)H−3 (indicated with a green dash in Fig. 6b), whereas the couple at 0.467 V (orange dash) with an equilibrium species that is formed only in the presence of phosphate.
Further analysis was possible by simulation of the CV curves (Fig. 6c).67 Scheme 3 illustrates the proposed equilibria applied in simulation, while the relevant parameters are listed in the caption of Scheme 3. According to this picture PO43− ejects OH− from the coordination sphere upon the oxidation of the CuII centre thus, besides that phosphate assistance is inevitable in the O2-producing cycle,29,33 it can act as inhibitor of the catalysis to some extent (note that this phenomenon could not be evinced for the Cu–3G or the Cu–2GH system, see as example the inset of Fig. S6†). Lastly, an additional current peak occurs on the cathodic direction near 0.2 V (Fig. 6b, blue dash). A feature like this at 0.38 V vs. NHE (or ∼0.18 V vs. Ag/AgCl) was rendered to a peptide-CuIII(OO)/peptide-CuII(OOH) or peptide-CuIII(OOH)/peptide-CuII(HOOH) couple earlier by Meyer et al.,29 therefore we also assign this peak tentatively to the redox couple of a peroxidic intermediate.
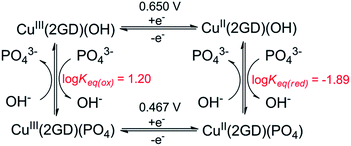 | ||
| Scheme 3 Equilibrium profile applied for CV simulation in Fig. 6c. Fit parameters – Cu(2GD)(OH): α (transfer coefficient) = 0.5, k° = 1.1 × 10⁻³ cms−1; Cu(2GD)(PO4): α = 0.5, k° = 0.9 10−3 cms−1; Keq(ox) = kf/kb = 70/4.38; Keq(red) = kf/kb = 40/0.52. | ||
The hypothesis on the dual role of phosphate is further supported by the current peaks in the cathodic direction in CVs taken at varying phosphate concentration (Fig. S5,† inset). The peak at ∼0.4 V (associated with the inhibited complex form) becomes more pronounced with increasing phosphate concentration, in parallel the peak at ∼0.2 V tentatively attributed to the peroxide species is rather proportional to the catalytic current at ∼1.2 V, i.e., its ratio to the peak of the inhibited form reaches a maximum at 0.2 M phosphate concentration then it is quenched together with the catalytic peak. (Note that experiments with newly synthesized ligand analogues 2DG and 3D that contain multiple carboxylate functions showed that catalysis is impeded by additional anionic groups. See ESI for details and Fig. S8†) Perception of phosphate interfering with the substrate activation led us to make CV experiments with increasing amounts of added NaCl to solutions of Cu–2GD and Cu–3G (Fig. S6 and S7†). This anion may also interfere with the OER. Importantly, no significant influence of Cl− could be detected on the catalytic current peak and the shape of CV responses.
On the mechanism of electrocatalysis by Cu–2GD
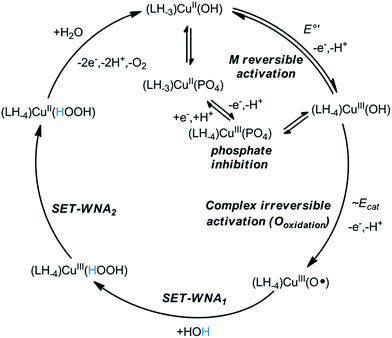
The concentration dependence in Cu–2GD has been investigated by CV (Fig. S9†). Interestingly, above ∼0.5 mM the catalytic current peak at ∼1.2 V vs. Ag/AgCl reaches maximum indicating the existence of a pre-equilibrium step in the M reversible activation phase (Scheme 4, E°′). The reverse change of icat normalized by the square root of the scan rate (ν−0.5) with ν implies that the rate limiting step in the catalytic cycle is of chemical nature (Fig. S10†).29,33 Earlier it has been proposed that this step could be water nucleophilic attack (WNA) at a (L)CuIII–O˙ species with electrophilic character that is generated in a second 1e oxidation.28–30,33 Most recently, Llobet and Maseras provided an overview of water oxidation mechanisms including a new alternative, SET-WNA (single electron transfer WNA).68 According to DFT calculations this mechanism is especially favoured in the case of first row transition metals, where higher oxidation states are unlikely to occur upon the second oxidation, i.e., the complex irreversible activation phase. This phase occurs in our system at ∼1.2 V vs. Ag/AgCl, but, like for the previous complexes, it is hidden under the catalytic current peak (Scheme 4, Ecat). Taken together, the SET-WNA mechanism seems plausible for the mechanistic description for the catalysis by the Cu–2GD system (Scheme 4). The H-atoms in blue may be subject to base-assisted dissociation in accordance with the explanation given earlier by others.29 The turnover frequency (TOF or kcat, s−1) was also calculated by means of the Randles-Sevcik equation.33 The TOF = 15.7(1.1) s−1 (Fig. S9,† inset) is lower than those for the previous complexes that we attribute to the pronounced inhibition effect of phosphate.As it was mentioned before, the copper binding structural motif in Cu–2GD is analogical to the linear peptide, H-GGD-NH2 (Scheme S1†) that is only capable of forming 5,5,6-chelate. In fact, this short peptide was applied in the 1![[thin space (1/6-em)]](https://www.rsc.org/images/entities/char_2009.gif) :
:![[thin space (1/6-em)]](https://www.rsc.org/images/entities/char_2009.gif) 1 ligand-to-copper system (Cu–GGD) under catalytic conditions as reference. The Cu–GGD system exhibits remarkably similar behaviour to that of Cu–2GD that is illustrated in Fig. S11.† There is quantitative difference, however, in favour of Cu–2GD (i) in the catalytic current peak and rate (TOF of ∼1.6×), (ii) in the phosphate inhibition (∼6× difference in Keq(ox), see Scheme S4†) and (iii) in the formal potential of the CuIII/II couples, directly pointing to the advantages of branching in C-terminally functionalised peptides.
1 ligand-to-copper system (Cu–GGD) under catalytic conditions as reference. The Cu–GGD system exhibits remarkably similar behaviour to that of Cu–2GD that is illustrated in Fig. S11.† There is quantitative difference, however, in favour of Cu–2GD (i) in the catalytic current peak and rate (TOF of ∼1.6×), (ii) in the phosphate inhibition (∼6× difference in Keq(ox), see Scheme S4†) and (iii) in the formal potential of the CuIII/II couples, directly pointing to the advantages of branching in C-terminally functionalised peptides.
Conclusions
Presented above are the solution equilibrium and electrocatalysis studies on Cu–2GD, a new electrocatalyst of the OER. This substance represents a third archetype of Cu-binding pockets at moderately basic pH formed by functionalization of the C-terminus (Scheme S1†). In addition, the effect of Asp residues at the N-termini was also briefly investigated (ligands 2DG and 3D, see ESI†). The peptide branching and the selected C-terminal extensions affect the catalytic ability of Cu differently (TOFs are 23, 54 and 16 s−1, respectively for 3G, 2GH and 2GD at pH = 11, and a pronounced phosphate assistance-inhibition dualism can be proposed for Cu–2GD). The metal ion is bound by two of the arms in this quasi 3D-architecture (by an N-terminal and the C-terminal, like in the linear domain, H-GGD-NH2), however, by much higher stability that is paired with increased catalytic activity. The latter fact points out that the impact of the branched structure is not confined to the build-up of a ligand framework that can be multiplied to pseudo-dendrimeric structures or functionalised with additional sequences, e.g., with electrode surface anchoring tags. Importantly, and in sharp contrast to their C-terminal positioning, carboxylates at the N-termini in 2DG and 3D cease catalysis. Therefore this comparison study can help to understand some design principles of singly branched units that in turn are crucial for the future development of structures capable of binding multiple metal ions. In natural systems the same metal ion may play very different roles, e.g., catalytic site, electron reservoir or structural cofactor, which is tuned by the coordination sphere and the access control to substrate molecules. Peptide technology offers advanced design options for the donor environments of the active site, similar to enzymes, but may be also greatly extended by the application of non-standard (non-canonical) amino acids meaning further alternatives.Finally, based on our long-term electrolysis and coupled XPS investigations, tuning the affinity of the complex for the polarized electrode surface may be an interesting aspect of catalyst developments, since it has been demonstrated with appropriate polyelectrolyte additives that the layer-by-layer approach is a viable strategy to fabricate OER electrodes.48,69
Acknowledgements
This study was supported by a Polish Foundation of Science within the BRIDGE program co-financed by the European Union within European Regional Development Fund (BRIDGE/2012-5/9). We would like to thank Prof. Wieslaw Malinka for his support. J. S. Pap is grateful for the Bolyai János Research Scholarship from the Hungarian Academy of Sciences and D. Srankó for the support of the National Research, Development and Innovation Office (NKFIH PD 121318).References
- M. Kondo and S. Masaoka, Chem. Lett., 2016, 45, 1220–1231 CrossRef CAS.
- M. D. Karkas and B. Akermark, Dalton Trans., 2016, 45, 14421–14461 RSC.
- B. M. Hunter, H. B. Gray and A. M. Müller, Chem. Rev., 2016, 116, 14120–14136 CrossRef CAS PubMed.
- P. Du and R. Eisenberg, Energy Environ. Sci., 2012, 5, 6012 CAS.
- M. Natali and F. Scandola, in Applied Photochemistry: When Light Meets Molecules, ed. G. Bergamini and S. Silvi, Springer International Publishing, Cham, 2016, pp. 1–66 Search PubMed.
- W. Kim, E. Edri and H. Frei, Acc. Chem. Res., 2016, 49, 1634–1645 CrossRef CAS PubMed.
- M. K. Brennaman, R. J. Dillon, L. Alibabaei, M. K. Gish, C. J. Dares, D. L. Ashford, R. L. House, G. J. Meyer, J. M. Papanikolas and T. J. Meyer, J. Am. Chem. Soc., 2016, 138, 13085–13102 CrossRef CAS PubMed.
- H. Dau, C. Limberg, T. Reier, M. Risch, S. Roggan and P. Strasser, ChemCatChem, 2010, 2, 724–761 CrossRef CAS.
- J. Su and L. Vayssieres, ACS Energy Lett., 2016, 1, 121–135 CrossRef CAS.
- I. C. Man, H.-Y. Su, F. Calle-Vallejo, H. A. Hansen, J. I. Martínez, N. G. Inoglu, J. Kitchin, T. F. Jaramillo, J. K. Nørskov and J. Rossmeisl, ChemCatChem, 2011, 3, 1159–1165 CrossRef CAS.
- M. W. Kanan and D. G. Nocera, Science, 2008, 321, 1072–1075 CrossRef CAS PubMed.
- M. Dinca, Y. Surendranath and D. G. Nocera, Proc. Natl. Acad. Sci. U. S. A., 2010, 107, 10337–10341 CrossRef CAS PubMed.
- Z. Chen and T. J. Meyer, Angew. Chem., Int. Ed., 2013, 52, 700–703 CrossRef CAS PubMed.
- J. D. Blakemore, R. H. Crabtree and G. W. Brudvig, Chem. Rev., 2015, 115, 12974–13005 CrossRef CAS PubMed.
- T. K. Michaelos, H. M. C. Lant, L. S. Sharninghausen, S. M. Craig, F. S. Menges, B. Q. Mercado, G. W. Brudvig and R. H. Crabtree, ChemPlusChem, 2016, 81, 1129–1132 CrossRef CAS.
- Y. Gao, R. H. Crabtree and G. W. Brudvig, Inorg. Chem., 2012, 51, 4043–4050 CrossRef CAS PubMed.
- G. C. Dismukes, R. Brimblecombe, G. A. N. Felton, R. S. Pryadun, J. E. Sheats, L. Spiccia and G. F. Swiegers, Acc. Chem. Res., 2009, 42, 1935–1943 CrossRef CAS PubMed.
- P. Xu, T. Zhou, N. Natalia, S. Hu and X. Zheng, J. Phys. Chem. A, 2016, 120, 10033–10042 CrossRef CAS PubMed.
- J. Lloret-Fillol and M. Costas, Nat. Energy, 2016, 1, 16023 CrossRef CAS.
- B. Das, B.-L. Lee, E. A. Karlsson, T. Åkermark, A. Shatskiy, S. Demeshko, R.-Z. Liao, T. M. Laine, M. Haukka, E. Zeglio, A. F. Abdel-Magied, P. E. M. Siegbahn, F. Meyer, M. D. Kärkäs, E. V. Johnston, E. Nordlander and B. Åkermark, Dalton Trans., 2016, 45, 13289–13293 RSC.
- K. G. Kottrup and D. G. H. Hetterscheid, Chem. Commun., 2016, 52, 2643–2646 RSC.
- J. L. Fillol, Z. Codolà, I. Garcia-Bosch, L. Gómez, J. J. Pla and M. Costas, Nat. Chem., 2011, 3, 807–813 CrossRef CAS PubMed.
- D. Das, S. Pattanayak, K. K. Singh, B. Garai and S. Sen Gupta, Chem. Commun., 2016, 52, 11787–11790 RSC.
- C. Gimbert-Suriñach, D. Moonshiram, L. Francàs, N. Planas, V. Bernales, F. Bozoglian, A. Guda, L. Mognon, I. López, M. A. Hoque, L. Gagliardi, C. J. Cramer and A. Llobet, J. Am. Chem. Soc., 2016, 138, 15291–15294 CrossRef PubMed.
- J.-W. Wang, X.-Q. Zhang, H.-H. Huang and T.-B. Lu, ChemCatChem, 2016, 8, 3287–3293 CrossRef CAS.
- M. Zhang, M.-T. Zhang, C. Hou, Z.-F. Ke and T.-B. Lu, Angew. Chem., Int. Ed., 2014, 53, 13042–13048 CrossRef CAS PubMed.
- S. M. Barnett, K. I. Goldberg and J. M. Mayer, Nat. Chem., 2012, 4, 498–502 CrossRef CAS PubMed.
- M. K. Coggins, M.-T. Zhang, Z. Chen, N. Song and T. J. Meyer, Angew. Chem., Int. Ed., 2014, 53, 12226–12230 CrossRef CAS PubMed.
- M.-T. Zhang, Z. Chen, P. Kang and T. J. Meyer, J. Am. Chem. Soc., 2013, 135, 2048–2051 CrossRef CAS PubMed.
- L.-Z. Fu, T. Fang, L.-L. Zhou and S.-Z. Zhan, RSC Adv., 2014, 4, 53674–53680 RSC.
- P. Garrido-Barros, I. Funes-Ardoiz, S. Drouet, J. Benet-Buchholz, F. Maseras and A. Llobet, J. Am. Chem. Soc., 2015, 137, 6758–6761 CrossRef CAS PubMed.
- V. K. K. Praneeth, M. Kondo, P. M. Woi, M. Okamura and S. Masaoka, ChemPlusChem, 2016, 81, 1123–1128 CrossRef CAS.
- J. S. Pap, Ł. Szyrwiel, D. Srankó, Z. Kerner, B. Setner, Z. Szewczuk and W. Malinka, Chem. Commun., 2015, 51, 6322–6324 RSC.
- X.-J. Su, M. Gao, L. Jiao, R.-Z. Liao, P. E. M. Siegbahn, J.-P. Cheng and M.-T. Zhang, Angew. Chem., Int. Ed., 2015, 54, 4909–4914 CrossRef CAS PubMed.
- L. A. Stott, K. E. Prosser, E. K. Berdichevsky, C. J. Walsby and J. J. Warren, Chem. Commun., 2017, 53, 651–654 RSC.
- T.-T. Li and Y.-Q. Zheng, Dalton Trans., 2016, 45, 12685–12690 RSC.
- L. Zhu, J. Du, S. Zuo and Z. Chen, Inorg. Chem., 2016, 55, 7135–7140 CrossRef CAS PubMed.
- C. Lu, J. Du, X.-J. Su, M.-T. Zhang, X. Xu, T. J. Meyer and Z. Chen, ACS Catal., 2016, 6, 77–83 CrossRef CAS.
- D. L. Gerlach, S. Bhagan, A. A. Cruce, D. B. Burks, I. Nieto, H. T. Truong, S. P. Kelley, C. J. Herbst-Gervasoni, K. L. Jernigan, M. K. Bowman, S. Pan, M. Zeller and E. T. Papish, Inorg. Chem., 2014, 53, 12689–12698 CrossRef CAS PubMed.
- T. Zhang, C. Wang, S. Liu, J.-L. Wang and W. Lin, J. Am. Chem. Soc., 2014, 136, 273–281 CrossRef CAS PubMed.
- A. Prevedello, I. Bazzan, N. Dalle Carbonare, A. Giuliani, S. Bhardwaj, C. Africh, C. Cepek, R. Argazzi, M. Bonchio, S. Caramori, M. Robert and A. Sartorel, Chem.–Asian J., 2016, 11, 1281–1287 CrossRef CAS PubMed.
- J. J. Stracke and R. G. Finke, J. Am. Chem. Soc., 2011, 133, 14872–14875 CrossRef CAS PubMed.
- C. J. M. van der Ham, F. Işık, T. W. G. M. Verhoeven, J. W. Hans Niemantsverdriet and D. G. H. Hetterscheid, Catal. Today DOI:10.1016/j.cattod.2016.12.042.
- X. Liu, H. Jia, Z. Sun, H. Chen, P. Xu and P. Du, Electrochem. Commun., 2014, 46, 1–4 CrossRef CAS.
- T. J. Meyer, Nat. Chem., 2011, 3, 757–758 CrossRef CAS PubMed.
- R. Brimblecombe, G. F. Swiegers, G. C. Dismukes and L. Spiccia, Angew. Chem., Int. Ed., 2008, 47, 7335–7338 CrossRef CAS PubMed.
- M. M. Najafpour, M. Zarei Ghobadi, B. Sarvi, S. Madadkhani, D. Jafarian Sedigh, P. Rafighi, M. Tavahodi, J.-R. Shen and S. I. Allakhverdiev, Int. J. Hydrogen Energy, 2016, 41, 5504–5512 CrossRef CAS.
- E. Farkas, D. Srankó, Z. Kerner, B. Setner, Z. Szewczuk, W. Malinka, R. Horvath, Ł. Szyrwiel and J. S. Pap, Chem. Sci., 2016, 7, 5249–5259 RSC.
- Ł. Szyrwiel, Ł. Szczukowski, J. S. Pap, B. Setner, Z. Szewczuk and W. Malinka, Inorg. Chem., 2014, 53, 7951–7959 CrossRef PubMed.
- Á. Dancs, N. V. May, K. Selmeczi, Z. Darula, A. Szorcsik, F. Matyuska, T. Páli and T. Gajda, New J. Chem., 2017, 41, 808–823 RSC.
- L. Szyrwiel, M. Shimura, J. Shirataki, S. Matsuyama, A. Matsunaga, B. Setner, L. Szczukowski, Z. Szewczuk, K. Yamauchi, W. Malinka, L. Chavatte and R. Lobinski, Metallomics, 2015, 7, 1155–1162 RSC.
- Ł. Szyrwiel, J. S. Pap, Ł. Szczukowski, Z. Kerner, J. Brasuń, B. Setner, Z. Szewczuk and W. Malinka, RSC Adv., 2015, 5, 56922–56931 RSC.
- A. Lakatos, B. Gyurcsik, N. V. Nagy, Z. Csendes, E. Weber, L. Fulop and T. Kiss, Dalton Trans., 2012, 41, 1713–1726 RSC.
- P. Gans, A. Sabatini and A. Vacca, Talanta, 1996, 43, 1739–1753 CrossRef CAS PubMed.
- F. Neese, Quant. Chem. Progr. Exch. Bull., 1995, 136, 5 Search PubMed.
- J. S. Pap and Ł. Szyrwiel, Comments Inorg. Chem., 2016, 1–19 Search PubMed.
- E. Armani, R. Marchelli, A. Dossena, G. Casnati and F. Dallavalle, Helv. Chim. Acta, 1986, 69, 1916–1922 CrossRef CAS.
- H. Sigel and R. B. Martin, Chem. Rev., 1982, 82, 385–426 CrossRef CAS.
- B. D.-L. Reverend, A. Lebkiri, C. Livera and L. D. Pettit, Inorg. Chim. Acta, 1986, 124, L19–L22 CrossRef.
- E. Prenesti, P. G. Daniele, S. Berto and S. Toso, Polyhedron, 2006, 25, 2815–2823 CrossRef CAS.
- Comprehensive coordination chemistry: the synthesis, reactions, properties & applications of coordination compounds; [in 7 volumes]. 5: Late transition elements, ed. G. Wilkinson, R. D. Gillard and J. A. McCleverty, Pergamon Press, Oxford, 1st edn, 1987, vol. 5 Search PubMed.
- A. B. Caballero, L. Terol-Ordaz, A. Espargaró, G. Vázquez, E. Nicolás, R. Sabaté and P. Gamez, Chem.–Eur. J., 2016, 22, 7268–7280 CrossRef CAS PubMed.
- C. Hureau, H. Eury, R. Guillot, C. Bijani, S. Sayen, P.-L. Solari, E. Guillon, P. Faller and P. Dorlet, Chem.–Eur. J., 2011, 17, 10151–10160 CrossRef CAS PubMed.
- A. Lakatos, B. Gyurcsik, N. V. Nagy, Z. Csendes, E. Wéber, L. Fülöp and T. Kiss, Dalton Trans., 2012, 41, 1713–1726 RSC.
- F. P. Bossu, K. L. Chellappa and D. W. Margerum, J. Am. Chem. Soc., 1977, 99, 2195–2203 CrossRef CAS PubMed.
- M. D. Kärkäs, O. Verho, E. V. Johnston and B. Åkermark, Chem. Rev., 2014, 114, 11863–12001 CrossRef PubMed.
- ZIVE SIM4U, Digital Cyclic Voltammetry Simulation Software, ZIVE LAB Search PubMed.
- I. Funes-Ardoiz, P. Garrido-Barros, A. Llobet and F. Maseras, ACS Catal., 2017, 7, 1712–1719 CrossRef CAS.
- J. C. Hidalgo-Acosta, M. D. Scanlon, M. A. Méndez, V. Amstutz, H. Vrubel, M. Opallo and H. H. Girault, Phys. Chem. Chem. Phys., 2016, 18, 9295–9304 RSC.
Footnotes |
| † Electronic supplementary information (ESI) available: Tables S1–S3, fitting of the SWV data, XPS analysis, Fig. S1–S11, Schemes S1–S4. See DOI: 10.1039/c7ra03814c |
| ‡ Present address: Riken SPring-8 Center, Hyogo, Japan, 1-1-1 Kouto, Sayo, Hyogo 679-5148, Japan. |
| This journal is © The Royal Society of Chemistry 2017 |


