 Open Access Article
Creative Commons Attribution 3.0 Unported Licence
Multimode microsensors based on Ag–TiO2–graphene materials used for the molecular recognition of carcinoembryonic antigen in whole blood samples
Livia Alexandra Gugoasaa,
Ahmed Jassim Muklive AĺOgaidib,
Raluca-Ioana Stefan-van Staden *ab,
Ahed El-Khatibc,
Marcela-Corina Rosud and
Stela Pruneanud
aLaboratory of Electrochemistry and PATLAB, National Institute of Research for Electrochemistry and Condensed Matter, 202 Splaiul Independentei Str., Bucharest-6, 060021, Romania. E-mail: ralucavanstaden@gmail.com; Fax: +40 213163113; Tel: +40 751507779
bFaculty of Applied Chemistry and Material Science, Politehnica University of Bucharest, Bucharest, Romania
cUniversity of Medicine and Pharmacy “Carol Davila”, Bucharest, Romania
dNational Institute for Research and Development of Isotopic and Molecular Technologies, Donat Street, No. 67-103, Cluj-Napoca, RO-400293, Romania
First published on 30th May 2017
Abstract
Ag–TiO2–graphene pastes modified with inulin, and L-alanine tert-butyl ester nitrate (L-Ala-C4-L-Lac), respectively, were proposed for the molecular recognition of carcinoembryonic antigen (CEA) from whole blood samples. High levels of CEA are associated with different types of cancer, one of them being colorectal cancer. Both sensors gave high reliability for the measurements, and also high sensitivity and selectivity were recorded. The modes used were stochastic mode for qualitative and quantitative analysis of CEA, and differential pulse voltammetry for the quantitative measurement of CEA. The lowest limit of determination (20.5 fg mL−1) was recorded when the multimode sensor based on Ag–TiO2–graphene paste was modified with the inulin IQ.
Introduction
Carcinoembryonic antigen (CEA) is a glycoprotein encoded by a gene from the superfamily of immunoglobulins1 and it can be found in the chromosome 19q.2 CEA is the most common tumor marker used in the diagnosis of several types of cancer. After its discovery in 1964 (ref. 3 and 4) over expression of CEA levels were mainly used in gastrointestinal cancer with focus on colorectal tumors.Determination of this biomarker in bodily fluids plays a crucial role in biomedical research. To date, CEA was determined using various analytical methods (Table 1) from serum samples. A fast screening method is needed for both diagnosis of patients as well as checking the efficiency of cancer treatment.
| Method | Biological samples | Detection limit | Reference |
|---|---|---|---|
| Electrochemiluminescence (ECL) | Serum | 1.52 fg mL−1 | 5 |
| Electrochemistry-immunosensor | 8 pg mL−1 | 6 | |
| 90 pg mL−1 | 7 | ||
| 0.2 fg mL−1 | 8 | ||
| Electrochemistry-biosensor | 8 pg mL−1 | 9 | |
| 30 pg mL−1 | 10 | ||
| Surface Plasmon Resonance (SPR) | 1 ng mL−1 | 11 | |
| Fluorescence | 3 pg mL−1 | 12 | |
| 0.3 ng mL−1 | 13 | ||
| Lateral-flow immunoassay (LFIA) | 0.25 ng mL−1 | 14 | |
| Fluorescence-spectroscopy | 49 pg mL−1 | 15 |
The group of Stefan-van Staden proposed multimode sensors as new reliable tools for the analysis of biomarkers from biological samples.16,17 This new type of sensors can perform in more than one mode, e.g., differential pulse voltammetry (DPV), stochastic mode, potentiometric mode, measurements of one or more analytes from the same sample. Multimode sensors offer a qualitative and a quantitative analysis by their response obtained in stochastic mode and a second quantitative analysis by their response in either amperometric or potentiometric modes. Because of this, stochastic mode is used first for the qualitative analysis, and the first quantification of the analyte(s). For this paper the second mode was amperometric mode with DPV measurements.
In this paper, we proposed two multimode microsensors based on Ag–TiO2–graphene (Ag–TiO2/rGO) materials modified with inulin IQ and L-alanine tert-butyl ester L-lactate (L-Ala-C4-Lac) for the screening tests of whole blood samples for CEA. The selection of the modifiers was done based on their properties: possibility to form channels for stochastic sensing, and also good electrocatalytic activity needed on DPV mode. The modification of graphene material with Ag–TiO2 nanoparticles facilitated the increasing the surface of the sensors, as well as the producing of channels, and increasing of the conductivity of graphene. The modes used were stochastic and differential pulse voltammetry (DPV).
Experimental
Materials and reagents
Carcinoembryonic antigen (CEA), inulin, L-alanine tert-butyl ester L-lactate (L-Ala-C4-Lac), sodium azide, monosodium and disodium phosphate were purchased from Sigma Aldrich (Milwaukee, USA) and paraffin oil (d4,20 0.86 g cm−1) from Fluka (Buchs, Switzerland). TiO2-P25 powder was purchased from Degussa (Germany). Triton X-100 and acetylacetone, used as organic additives, were bought from Fluka (Switzerland) and Merck (Germany), respectively. Silver nitrate (AgNO3) was obtained from Alfa-Aesar (Germany). Ascorbic acid (C6H8O6) and ethanol were acquired from Fluka (Germany). Graphene oxide (GO) was prepared from natural graphite (Sigma Aldrich, Germany) using a modified Hummer's method.18Monosodium and disodium phosphates were used for the preparation of 0.1 mol L−1 phosphate buffer solution (PBS) of pH = 7.4. Deionized water obtained from a Millipore Direct-Q 3 System (Molsheim, France) was used for the preparation of all solutions. All standard solutions were prepared in buffer solution pH = 7.4, with NaN3 0.1% in a ratio water![[thin space (1/6-em)]](https://www.rsc.org/images/entities/char_2009.gif) :
:![[thin space (1/6-em)]](https://www.rsc.org/images/entities/char_2009.gif) buffer solution of 1
buffer solution of 1![[thin space (1/6-em)]](https://www.rsc.org/images/entities/char_2009.gif) :
:![[thin space (1/6-em)]](https://www.rsc.org/images/entities/char_2009.gif) 1 (v/v). Serial dilution technique was used for the preparation of solutions of different concentrations (2.05 × 10⁻¹⁴ g mL−1 to 5.00 × 10⁻⁶ g mL−1). CEA solutions were stored in the fridge at 2–8 °C. All chemicals were of analytical grade.
1 (v/v). Serial dilution technique was used for the preparation of solutions of different concentrations (2.05 × 10⁻¹⁴ g mL−1 to 5.00 × 10⁻⁶ g mL−1). CEA solutions were stored in the fridge at 2–8 °C. All chemicals were of analytical grade.
Preparation of Ag–TiO2 graphene (Ag–TiO2/rGO) nanocomposite
In the first step, Ag–TiO2 nanoparticles were obtained by a combined chemical/thermal approach. A suspension of TiO2 nanoparticles in double-distilled water (0.15 g mL−1) was added to a mixture of Triton X-100 and acetylacetone (3![[thin space (1/6-em)]](https://www.rsc.org/images/entities/char_2009.gif) :
:![[thin space (1/6-em)]](https://www.rsc.org/images/entities/char_2009.gif) 2 v/v) and magnetically stirred at room temperature. Then, silver nitrate (AgNO3) and ascorbic acid (C6H8O6) (1
2 v/v) and magnetically stirred at room temperature. Then, silver nitrate (AgNO3) and ascorbic acid (C6H8O6) (1![[thin space (1/6-em)]](https://www.rsc.org/images/entities/char_2009.gif) :
:![[thin space (1/6-em)]](https://www.rsc.org/images/entities/char_2009.gif) 2 mass ratio) were added into the TiO2 homogenous suspension. AgNO3 acted as Ag nanoparticles precursor and C6H8O6 as reducing agent for Ag+ ions. The final Ti
2 mass ratio) were added into the TiO2 homogenous suspension. AgNO3 acted as Ag nanoparticles precursor and C6H8O6 as reducing agent for Ag+ ions. The final Ti![[thin space (1/6-em)]](https://www.rsc.org/images/entities/char_2009.gif) :
:![[thin space (1/6-em)]](https://www.rsc.org/images/entities/char_2009.gif) Ag molar ratio was 50
Ag molar ratio was 50![[thin space (1/6-em)]](https://www.rsc.org/images/entities/char_2009.gif) :
:![[thin space (1/6-em)]](https://www.rsc.org/images/entities/char_2009.gif) 1. The mixture was magnetically stirred at 80 °C until the color changed from white to dark gray, indicating the chemical reduction of Ag+ to Ago. Finally, the dried powder was thermally treated at 450 °C for 2 h, in the air. The resulted gray material, denoted as Ag–TiO2, was naturally cooled to room temperature.
1. The mixture was magnetically stirred at 80 °C until the color changed from white to dark gray, indicating the chemical reduction of Ag+ to Ago. Finally, the dried powder was thermally treated at 450 °C for 2 h, in the air. The resulted gray material, denoted as Ag–TiO2, was naturally cooled to room temperature.
In the second step, Ag–TiO2 nanoparticles were mixed with graphene oxide (GO) and then thermally treated, in order to obtain Ag–TiO2/reduced graphene oxide (Ag–TiO2/rGO). Briefly, GO and Ag–TiO2 nanoparticles (20![[thin space (1/6-em)]](https://www.rsc.org/images/entities/char_2009.gif) :
:![[thin space (1/6-em)]](https://www.rsc.org/images/entities/char_2009.gif) 1 mass ratio) were dispersed in 20% ethanol (Fluka, Germany) solution and the suspension was ultrasonicated for 30 minutes. Then, the suspension was magnetically stirred at 50 °C, until complete drying. Following, the material was subjected to 1 hour thermal treatment at 550 °C, in argon/hydrogen controlled atmosphere. The thermal treatment is necessary for the reduction of GO which is an insulating material. The reduced graphene oxide (rGO) obtained after the thermal treatment has a low content of oxygen-containing groups and high conductivity, being beneficial for charge transfer.19
1 mass ratio) were dispersed in 20% ethanol (Fluka, Germany) solution and the suspension was ultrasonicated for 30 minutes. Then, the suspension was magnetically stirred at 50 °C, until complete drying. Following, the material was subjected to 1 hour thermal treatment at 550 °C, in argon/hydrogen controlled atmosphere. The thermal treatment is necessary for the reduction of GO which is an insulating material. The reduced graphene oxide (rGO) obtained after the thermal treatment has a low content of oxygen-containing groups and high conductivity, being beneficial for charge transfer.19
Design of multimode microsensors based on carbon matrices
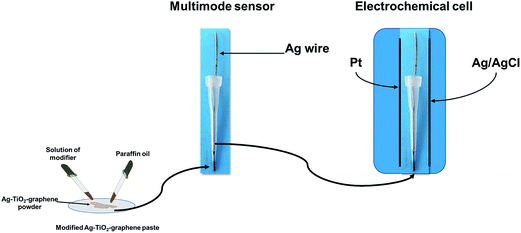
Paraffin oil was added to the Ag–TiO2/rGO powder until a homogenous paste was formed. To each 50 mg paste were added 50 μL of modifier (10−3 mol L−1 solution of either inulin, or ionic liquid: L-alanine tert-butyl ester L-lactate (L-Ala-C4-Lac)) to give the modified paste. Each modified paste was inserted in a plastic tip with a diameter of the active site of 300 μm (Fig. 1). The electric contact was done using an Ag wire. When not in use, the multimode sensors were stored at room temperature, in a dry place.Apparatus and methods
All measurements were performed with AUTOLAB/PGSTAT 12 (Methrom) connected to a computer. A three electrode system electrochemical cell was employed (Fig. 1). Ag/AgCl (0.1 mol L−1 KCl) electrode serves as a reference electrode in the cell and a Pt wire as auxiliary electrode in the cell, respectively.A stochastic mode was used for the measurements of the qualitative parameter toff and the quantitative parameter ton, at a constant potential (125 mV vs. Ag/AgCl) and was used for both qualitative and quantitative analysis of CEA (Fig. 2). The known value of toff was followed in each stochastic diagram to identify CEA and further for its quantification using the recorded ton value (1/ton = f(conc.)).
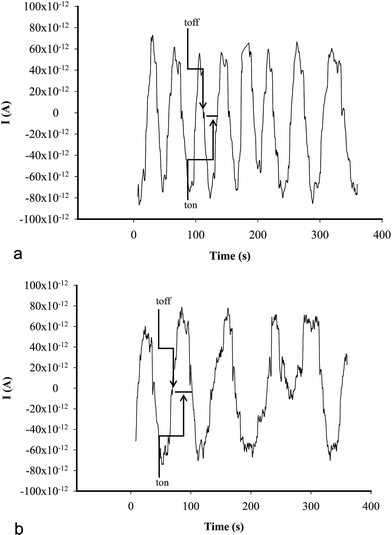 | ||
| Fig. 2 Examples of stochastic diagrams for the assay of CEA in whole blood samples using (a) inulin IQ/Ag–TiO2/rGO, (b) L-AlaC4-Lac/Ag–TiO2/rGO. | ||
Differential pulse voltammetry (DPV) was used for the quantitative analysis of CEA in whole blood samples. All parameters used for DPV scans are summarized in Table 2. The unknown concentrations of CEA from whole blood samples were determined from the calibration graphs H = f(conc.), where H is the value of peak height (Fig. 3).
| Parameter | Microsensors based on | |
|---|---|---|
| Inulin-IQ/Ag–TiO2/rGO | L-Ala-C4-L-Lac/Ag–TiO2/rGO | |
| Potential range (mV) | 400 to >1500 | 1000 to >2200 |
| Scan rate (mV s−1) | 50 | 50 |
| Modulation amplitude (mV) | 10 | 10 |
| Step potential (mV) | 10 | 10 |
| Peak position (mV) | 1650 | 1570 |
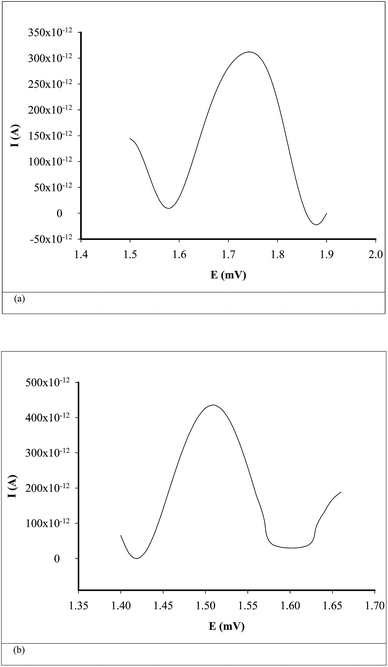 | ||
| Fig. 3 Examples of voltammograms for the assay of CEA in whole blood samples using (a) inulin IQ/Ag–TiO2/rGO, (b) L-AlaC4-Lac/Ag–TiO2/rGO. | ||
TEM images were obtained with an H-7650 120 kV Automatic Microscope-Hitachi while STEM-EDX images were obtained with an SU-8230 STEM system, Hitachi (Japan). Before investigations, the samples were diluted in ethanol then dropped on copper grid (200 mesh) and dried at room temperature for several minutes.
Phase formation and crystalline properties of the composite sample were reveled by X-ray powder diffraction, using a Bruker X-ray diffractometer (Bruker, Germany) with CuKα radiation (λ = 1.54056 Å).
Samples
Eleven blood samples were collected from patients confirmed with colon cancer from the University Hospital in Bucharest (Ethics committee approval nr 75/2015). Informed consent was obtained from all patients. The samples were screened using the multimode sensors, without any treatment sampling procedure.Results and discussions
TEM and XRD characterization of Ag–TiO2/rGO composite
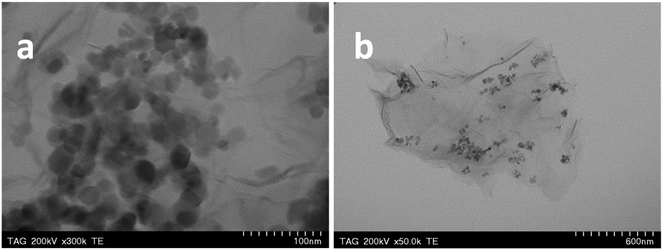
Fig. 4a and b show representative TEM images of TiO2 and Ag–TiO2 nanoparticles, respectively. One can see that there are no major morphological differences between TiO2 and Ag–TiO2 nanoparticles. The majority of nanoparticles have round shape, with the size below 50 nm. Due to the low concentration of AgNO3 used in the synthesis of the composite material, only a small number of silver nanoparticles were identified by EDX mapping (Fig. 4c). The elemental maps of Ti, O and Ag in the Ag–TiO2 sample can be seen in Fig. 4d–f, respectively.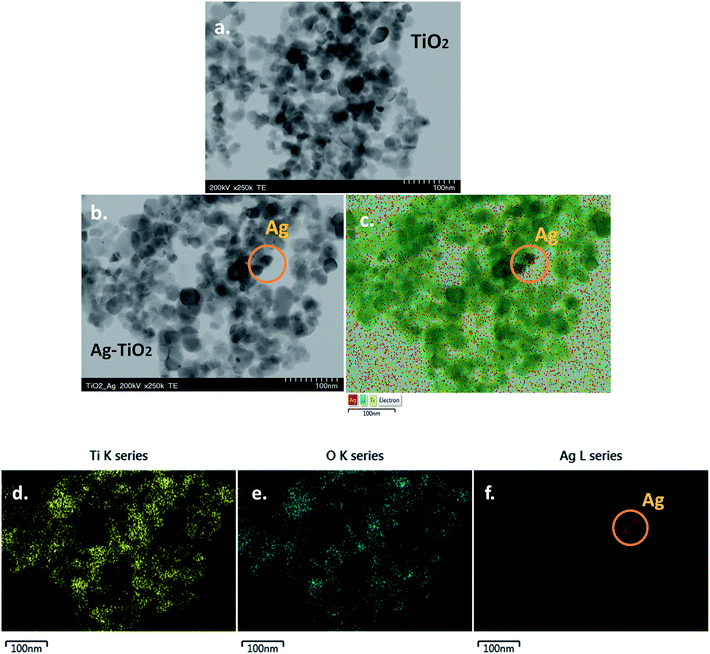 | ||
| Fig. 4 TEM image of: TiO2 nanoparticles (a) and Ag–TiO2 nanoparticles (b); elemental maps of Ti, O and Ag in Ag–TiO2 sample (c–f); scale bar 100 nm (a–f). | ||
As known, the Ag+ has a larger ionic radius (1.29 Å) than that of Ti4+ (0.745 Å)20 therefore silver ions are not readily incorporated at Ti sites in the TiO2 lattice, but mostly deposited on TiO2 surface. In addition, the substitution of Ti4+ by Ag+ would be accompanied by an important lattice expansion, due to the large difference between them. This was not observed in our XRD measurement.
The Ag–TiO2 nanoparticles were mixed with graphene oxide then the material was thermally reduced at 550 °C, resulting the final Ag–TiO2/rGO composite (Fig. 5a and b). The interaction between Ag–TiO2 nanoparticles and the sp2 carbon network of rGO is mainly physical. As a result of the oxygen-containing group removal from the GO structure, the graphene sheets are closely associated and stacked via van der Waals' interactions. The two representative TEM images of composite indicate that the Ag–TiO2 nanoparticles are uniformly dispersed on the graphene surface. The high transparency of the synthesized material suggests that graphene sheets are very thin being composed of 2–3 layers. Also, the wrinkles and folding of the layers, specific to graphene, can be clearly seen. TiO2 and Ag attached to graphene have beneficial effects, by increasing the surface area of the composite material (Ag–TiO2/rGO).
Phase formation and crystalline properties of the composite sample were next studied by X-ray powder diffraction. The X-ray pattern of Ag–TiO2 powder illustrates the presence of both anatase (PDF card no. 21-1272) and rutile (PDF card no. 21-1276) crystalline phases of TiO2, denoted as TiO2-A and TiO2-R, respectively (Fig. 6). By comparison, Ag–TiO2/rGO composite exhibits only the diffraction peaks of TiO2 anatase crystalline phase. No peaks related to the presence of silver nanoparticles were identified, due to the low concentration of Ag in the composites (Ag–TiO2 and Ag–TiO2/rGO).
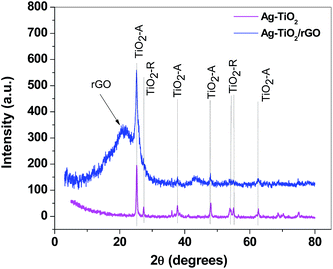 | ||
| Fig. 6 X-ray diffraction patterns of Ag–TiO2 (magenta) and Ag–TiO2/rGO (blue) composites, showing the characteristic peaks of TiO2 (anatase and rutile) and of reduced graphene oxide (rGO). | ||
The broad peak at 2θ = 21.25° can be attributed to reduced graphene oxide (rGO). Its position correlates with the distance between the graphene layers (d-spacing) which was found to be 0.43 nm (slightly higher than the distance between graphene layers in graphite – 0.335 nm). The graphene crystallite size was estimated from the FWHM of the rGO diffraction peak, using Scherrer equation21 and was determined to be 0.8 nm. By taking into account the d-spacing value (0.43 nm) we determined that the graphene crystallites are composed of two layers. Such finding was in excellent agreement with TEM results which clearly revealed the transparent morphology of graphene sheets (few-layer graphene).
Response characteristics of multimode microsensors used in stochastic mode
Stochastic response relies on the conductivity of channels when the analyte is going through it: under an applied potential, the molecule of the analyte is extracted from the solution to the membrane–solution interface. Molecular recognition of the analyte takes place in 2 stages. In the first stage the molecule of the analyte blocks the entrance in the pore (the current is dropping to zero) for a certain period of time which is called toff and represents the qualitative parameter of the analyte. In the second stage the molecule is binding to the pore wall and the following equation of equilibrium takes place:| Ch(i) + CEA(i) ⇔ Ch × CEA(i) |
In Table 3 are presented the response characteristics of the multimode microsensors in stochastic mode. The best multimode microsensor for stochastic mode was the one based on inulin IQ/Ag–TiO2/rGO, because it had the highest sensitivity and the lowest determination limit (20.5 fg mL−1), making it a good choice for early detection of CEA.
| Microsensors based on | Calibration equation and correlation coefficient (r) | Linear concentration range (μg mL−1) | toff | Sensitivity (s−1/mol L−1) | Limit of determination (μg mL−1) |
|---|---|---|---|---|---|
| a 〈1/ton〉 = s−1; 〈C〉 = μg mL−1. | |||||
| L-Ala-C4-L-Lac/Ag–TiO2/rGO | 1/ton = 0.01 + 2.91 × 10⁻¹ × C, r = 0.9991 | 1.60 × 10⁻³ to 2.00 × 10⁻¹ | 2.5 | 2.91 × 10⁻¹ | 1.6 × 10⁻³ |
| Inulin-IQ/Ag–TiO2/rGO | 1/ton = 0.018 + 9.40 × 10⁴ × C, r = 0.9999 | 2.05 × 10⁻⁸ to 5.12 × 10⁻⁷ | 2 | 9.40 × 10⁴ | 2.05 × 10⁻⁸ |
Response characteristics of multimode microsensors used in DPV mode
Response characteristics of the multimode microsensors in DPV mode are given in Table 4. For the assay of CEA (Table 4), the microsensor based on inulin IQ/Ag–TiO2/rGO showed the lowest determination limit (1.02 fg mL−1). The same microsensor had covered the widest linear concentration range (1.02 fg mL−1 to 0.20 μg mL−1) for the assay of CEA.| Sensor based on | Equation of calibrationa and correlation coefficient (r) | E (mV) | Limit of detection (μg mL−1) | Limit of determination (μg mL−1) | Linear conc. range (μg mL−1) |
|---|---|---|---|---|---|
| a 〈H〉 = A; 〈C〉 = mg mL−1. | |||||
| L-Ala-C4-L-Lac/Ag–TiO2/rGO | H = 6.1 × 10⁻⁹ + 4.0 × 10⁻⁹ × C, r = 0.9996 | 1570 | 4.77 × 10⁻⁵ | 1.60 × 10⁻³ | 1.60 × 10⁻³ to 2.00 × 10⁻¹ |
| Inulin-IQ/Ag–TiO2/rGO | H = 1.2 × 10⁻⁸ + 6.5 × 10⁻⁶ × C, r = 0.9981 | 1650 | 4.78 × 10⁻⁷ | 1.02 × 10⁻⁷ | 1.02 × 10⁻⁷ to 1.60 × 10⁻³ |
Both types of modifiers – ionic liquids and inulins are nanostructured materials, which can give the necessary pores needed for stochastic sensing, but the inulins had also a ring in their structures which can function as channel, and therefore they are better materials for the design of stochastic sensors; this property was also reflected on the response characteristics of the proposed sensors.
Based on the experimental data, the multimode microsensor of choice, which can be used reliable for both modes is the one based on Ag–TiO2/rGO modified with inulin IQ.
The reliability of the design was checked by construction and evaluation of 5 different sensors of each category. For each category, the sensitivity was evaluated initially, and every day, when the % RSD values recorded were lower than 1.0% for 3 months.
Interferences were checked versus CA19-9, p53, and HER-1. For stochastic mode, different toff values were recorded with the proposed sensors for the compounds proposed as interferences and CEA, and accordingly the proposed sensors and selective in the stochastic mode. Also, measurements performed in mixed solution methods for the DPV mode shown that the amperometric selectivity coefficients recorded were lower than 10−4, proving that the sensors are selective also in this mode, and accurate measurements can be performed.
Although the limits of determination are a bit higher than those reported to date in the literature,5,8 the advantages of the proposed sensors and method are: simplicity, the biological fluid can be used as taken from the patients, there is a first step of qualitative analysis based on identification of the signature of the analyte which indicates reliable the presence of CEA, also the quantitative analysis used for the assay of concentration is performed using two techniques: stochastic mode and DPV mode – and this is increasing the precision and accuracy of the determination.
Interferences
The multimode sensors' selectivity was checked using both modes: stochastic and DPV, versus other cancer biomarkers: p53, KRAS, HER-1, NSE, and CYFRA-21. For the stochastic mode, the signatures (toff values) obtained for the specified possible interferences were different from the one obtained for CEA using the proposed sensors; accordingly, the sensors are selective in the stochastic mode.Mixed solution method was selected for the determination of the selectivity amperometric coefficients of the proposed sensors in the DPV mode. The results presented in Table 5 for the amperometric selectivity coefficients shown that the other cancer biomarkers did not interfere in the assay of CEA using the DPV mode.
| Sensor based on | Kampsel | ||||
|---|---|---|---|---|---|
| P53 | KRAS | HER-1 | NSE | CYFRA-21 | |
| L-Ala-C4-L-Lac/Ag–TiO2/rGO | 5.16 × 10⁻³ | 6.70 × 10⁻³ | 6.77 × 10⁻³ | 6.96 × 10⁻³ | 6.52 × 10⁻³ |
| Inulin-IQ/Ag–TiO2/rGO | 5.22 × 10⁻³ | 6.68 × 10⁻³ | 9.52 × 10⁻⁵ | 5.87 × 10⁻³ | 5.90 × 10⁻³ |
Analytical applications
Normal levels of CEA in a healthy patient are less than 2.5 ng mL−1. High levels of CEA in blood predict colon cancer tumors, therefore a fast, simple and cheap method to analyse the concentration of CEA in hospitalized patients can help physicians to ask the patients to do further investigations for a fast diagnostic. Results obtained from the screening of whole blood samples, using multimode sensors, in stochastic and DPV mode are shown in Table 6. Statistical analysis based on pair t-test was performed for a confidence level of 99.00%. The results have shown that there is no significant difference between the values obtained using the multimode microsensors used in either stochastic or DPV modes, and ELISA (standard method) at 99.00% confidence level (ttheoretical = 4.032). Accordingly, the proposed sensors are a good alternative for ELISA, for screening tests and quantitative assay of CEA in whole blood samples.| Nr | Inulin IQ/Ag–TiO2/rGO, ng mL−1 | L-AlaC4-Lac/Ag–TiO2/rGO, ng mL−1 | ELISA, ng mL−1 | t-Test | ||
|---|---|---|---|---|---|---|
| Stochastic mode | DPV mode | Stochastic mode | DPV mode | |||
| a All values are average of three determinations. | ||||||
| 1 | 96.40 ± 0.21 | 98.40 ± 0.32 | 96.50 ± 0.22 | 99.00 ± 0.32 | 95.95 ± 0.54 | 1.49 |
| 2 | 116.00 ± 0.17 | 114.96 ± 0.35 | 113.90 ± 0.20 | 111.16 ± 0.30 | 110.02 ± 0.55 | 1.30 |
| 3 | 69.80 ± 0.18 | 67.55 ± 0.27 | 68.49 ± 0.13 | 68.09 ± 0.23 | 67.00 ± 0.52 | 1.78 |
| 4 | 29.06 ± 0.20 | 28.90 ± 0.20 | 27.10 ± 0.16 | 27.90 ± 0.20 | 27.22 ± 0.60 | 1.27 |
| 5 | 87.50 ± 0.23 | 91.80 ± 0.43 | 93.30 ± 0.20 | 89.20 ± 0.29 | 87.50 ± 0.46 | 1.92 |
| 6 | 63.10 ± 0.18 | 66.00 ± 0.37 | 63.73 ± 0.22 | 66.56 ± 0.42 | 62.59 ± 0.51 | 1.68 |
| 7 | 17.50 ± 0.09 | 15.23 ± 0.27 | 15.03 ± 0.12 | 17.18 ± 0.11 | 15.29 ± 0.50 | 1.03 |
| 8 | 68.96 ± 0.21 | 68.30 ± 0.22 | 68.25 ± 0.21 | 66.67 ± 0.25 | 66.50 ± 0.47 | 1.60 |
| 9 | 13.40 ± 0.08 | 13.36 ± 0.19 | 13.56 ± 0.14 | 13.80 ± 0.27 | 13.23 ± 0.40 | 0.98 |
| 10 | 96.40 ± 0.21 | 101.92 ± 0.32 | 100.00 ± 0.22 | 102.96 ± 0.30 | 99.87 ± 0.42 | 1.27 |
| 11 | 0.30 ± 0.05 | 0.31 ± 0.08 | 0.32 ± 0.07 | 0.32 ± 0.09 | 0.27 ± 0.12 | 1.02 |
Conclusions
In this paper we proposed two multimode microsensors for the molecular recognition of carcinoembryonic antigen (CEA). For the design of the proposed multimode sensors an Ag–TiO2/rGO paste was modified with inulin IQ or two types of ionic liquids. The best multimode sensor which reached very low limits of determination in both stochastic and DPV modes (LOQs in the magnitude orders of fg mL−1) was the one based on Ag–TiO2/rGO modified with inulin IQ. The proposed method is more simple, fast, and accurate compared with those proposed previously and can be used for the screening of the whole blood samples, as taken from the patients.Acknowledgements
This work was supported by UEFISCDI, Partnership 22/2014 and by a grant of CNCS/CCCDI – UEFISCDI, project number PN-III-P2-2.1-PED-2016-0392, within PNCDI III. The authors want to thank Alin Sebastian Porav for performing the TEM investigation.References
- D. M. P. Thomson, J. Krupey, S. O. Freedman and P. Gold, The radioimmunoassay of circulating carcinoembryonic antigen of the human digestive system, Proc. Natl. Acad. Sci. U. S. A., 1969, 64, 161–167 CrossRef CAS.
- J. A. Thompson, F. Grunert and W. Zimmermann, Carcinoembryonic antigen gene family: molecular biology and clinical perspective, J. Clin. Lab. Anal., 1991, 5, 344–366 CrossRef CAS PubMed.
- P. Gold and S. O. Freedman, Demonstration of tumor-specific antigens in human colonic carcinomata by immunological tolerance and absorption techniques, J. Exp. Med., 1965, 121, 439–462 CrossRef CAS PubMed.
- P. Gold and S. O. Freedman, Specific carcinoembryonic antigens of the human digestive system, J. Exp. Med., 1965, 122, 467–481 CrossRef CAS PubMed.
- D. Wang, Y. Li, Z. Lin, B. Qiu and L. Guo, Surface-Enhanced Electrochemiluminescence of Ru@SiO2 for Ultrasensitive Detection of Carcinoembryonic Antigen, Anal. Chem., 2015, 87, 5966–5972 CrossRef CAS PubMed.
- D. Feng, L. Li, X. Fang, X. Han and Y. Zhang, Dual signal amplification of horseradish peroxidase functionalized nanocomposite as trace label for the electrochemical detection of carcinoembryonic antigen, Electrochim. Acta, 2014, 127, 334–341 CrossRef CAS.
- J. Liu, J. Wang, T. Wang, D. Li, F. Xi, J. Wang and E. Wang, Three-dimensional electrochemical immunosensor for sensitive detection of carcinoembryonic antigen based on monolithic and macroporous graphene foam, Biosens. Bioelectron., 2015, 65, 281–286 CrossRef CAS PubMed.
- S. Samanman, A. Numnuam, W. Limbut, P. Kanatharana and P. Thavarungkul, Highly-sensitive label-free electrochemical carcinoembryonic antigen immunosensor based on a novel Au nanoparticles–graphene–chitosan nanocomposite cryogel electrode, Anal. Chim. Acta, 2015, 853, 521–532 CrossRef CAS PubMed.
- J. Huang, J. Tian, Y. Zhao and S. Zhao, Ag/Au nanoparticles coated graphene electrochemical sensor for ultrasensitive analysis of carcinoembryonic antigen in clinical immunoassay, Sens. Actuators, B, 2015, 206, 570–576 CrossRef CAS.
- G. Li, Q. Xue, J. Feng and W. Sui, Electrochemical biosensor based on nanocomposites film of thiol graphene–thiol chitosan/nano gold for the detection of carcinoembryonic antigen, Electroanalysis, 2015, 27, 1245–1252 CrossRef CAS.
- R. Li, F. Feng, Z. Chen, Y. Bai, F. F. Guo, F. I. Wu and G. Zhau, Sensitive detection of carcinoembryonic antigen using surface plasmon resonance biosensor with gold nanoparticles signal amplification, Talanta, 2015, 140, 143–149 CrossRef CAS PubMed.
- X. Yang, Y. Zhuo, S. Zhu, Y. Luo, Y. Feng and Y. Xu, Selectively assaying CEA based on a creative strategy of gold nanoparticles enhancing silver nanoclusters' fluorescence, Biosens. Bioelectron., 2015, 64, 345–351 CrossRef CAS PubMed.
- H. Miao, L. Wang, Y. Zhuo, Z. Zhou and X. Yang, Label-free fluorimetric detection of CEA using carbon dots derived from tomato juice, Biosens. Bioelectron., 2016, 86, 83–89 CrossRef CAS PubMed.
- F. Liu, H. Zhang, Z. Wu, H. Dong, L. Zhou, D. Yang, Y. Ge, C. Jia, H. Liu, Q. Jin, J. Zhao, Q. Zhang and H. Mao, Highly sensitive and selective lateral flow immunoassay based on magnetic nanoparticles for quantitative detection of carcinoembryonic antigen, Talanta, 2016, 161, 205–210 CrossRef CAS PubMed.
- W. Qin, K. Wang, K. Xiao, Y. Hou, W. Lu, H. Xu, Y. Wo, S. Feng and D. Cui, Carcinoembryonic Antigen Detection with “Handing”-Controlled Fluorescence Spectroscopy Using a Color Matrix for Point-of-care Applications, Biosens. Bioelectron., 2016, 90, 508–515 CrossRef PubMed.
- R. I. Stefan-van Staden, L. A. Gugoasa, B. Calenic, J. F. van Staden and J. Legler, Screening of children saliva samples for bisphenol A using stochastic, amperometric and multimode microsensors, Anal. Chem. Res., 2014, 1, 1–7 CrossRef.
- L. A. Gugoasa, R. I. Stefan-van Staden, B. Calenic and J. Legler, Multimode sensors as new tools for assessing the levels of testosterone, dihydrotestosterone and estradiol in children's saliva, J. Mol. Recognit., 2015, 28, 10–19 CrossRef CAS PubMed.
- F. Pogacean, C. Socaci, S. Pruneanu, A. R. Biris, M. Coros, L. Magerusan, G. Katona, R. Turcu and G. Borodi, Graphene based nanomaterials as chemical sensors for hydrogen peroxide – A Comparison study of their intrinsic peroxidase catalytic behavior, Sens. Actuators, B, 2015, 213, 474–483 CrossRef CAS.
- S. Pei and H.-M. Cheng, The reduction of graphene oxide, Carbon, 2012, 50, 3210–3228 CrossRef CAS.
- F. Bensouici, T. Souier, A. A. Dakhel, A. Iratni, R. Tala-Ighil and M. Bououdina, Synthesis, characterization and photocatalytic behavior of Ag doped TiO2 thin film, Superlattices Microstruct., 2015, 85, 255–265 CrossRef CAS.
- H. P. Klug and L. E. Alexander, X-ray diffraction procedures for polycrystalline and amorphous materials, John Wiley & Sons, New York, 1974 Search PubMed.
| This journal is © The Royal Society of Chemistry 2017 |

