 Open Access Article
Creative Commons Attribution 3.0 Unported Licence
A simple methodology to predict the tunneling conductivity of polymer/CNT nanocomposites by the roles of tunneling distance, interphase and CNT waviness
Yasser Zare a and
Kyong Yop Rhee*b
aYoung Researchers and Elites Club, Science and Research Branch, Islamic Azad University, Tehran, Iran
bDepartment of Mechanical Engineering, College of Engineering, Kyung Hee University, Giheung, Yongin 446-701, Gyeonggi, Republic of Korea. E-mail: rheeky@khu.ac.kr; Fax: +82 31 202 6693; Tel: +82 31 201 2565
First published on 12th July 2017
Abstract
In this work, a simple methodology is presented that describes the main tunneling conductivity of polymer/CNT nanocomposites (PCNT) assuming the tunneling distance, interphase surrounding the CNT, and CNT waviness. The conductivity related to the tunneling distance is obtained by a simple equation, and its role is considered by using an extended CNT (including CNT and the tunneling space). Additionally, the effects of the interphase and CNT waviness on the percolation threshold, effective filler fraction, and percentages of percolated CNT are expressed by simple equations. The suggested model is evaluated by experimental results and the influences of CNTs and interphase parameters on the conductivity are plotted and justified. The predictions demonstrate good agreement with the experimental results, which allow the estimation of percolation threshold, interphase thickness, and tunneling distance. The conductivity changes from 0 to 350 S m−1 at different parameter ranges, where the best conductivity is obtained by the smallest waviness and the shortest tunneling distance. Generally, the high concentration of thin, long, straight, and super-conductive CNT, thick interphase, dense network, short tunneling distance, and poor percolation threshold present desirable conductivity.
1 Introduction
Many promising applications have been suggested for polymer/carbon nanotube (PCNT) nanocomposites due to the exceptional properties of CNTs, including their electrical conductivity and mechanical performances; this has led to an increased level of research in this field.1–4 CNTs commonly form a three-dimensional (3D) continuous network in polymer matrices above a critical concentration, which indicates the percolation threshold.5,6 The value of the percolation threshold is heavily dependent on the aspect ratio of the CNTs (length divided by diameter) and their dispersion extent in the polymer matrix. Thus, a high CNT aspect ratio (about 500–1000) causes the development of a conductive nanocomposite when very low CNT loadings are used. However, it has been reported that the improvement in the conductivity at very low CNT fractions is limited, which is due to the deficient dispersion of CNT in the polymer matrix.7,8 The percolation level can be experimentally assessed by measuring the electrical conductivity at dissimilar CNT concentrations. The CNT concentration at which the electrical conductivity sharply increases denotes the percolation threshold. The key mechanism for electrical conductivity in PCNT was determined to be electron tunneling, where electrons are transported between nanotubes by the tunneling effect.9 Although the nanotubes are not physically connected, neighboring CNT transfer charges by electron jumping. Therefore, the conductivity of PCNT mainly depends on the distance between nanotubes, which can promote electron tunneling.From a modeling point of view, several models have been suggested to predict the electrical conductivity in polymer composites. The best-known model is a power-law equation based on conventional percolation theory, which depends on the conductivity-to-filler concentration, percolation threshold, and an exponent.10 This model also displays good agreement with the electrical conductivity of PCNT, as reported by (ref. 11–13). Although this model can follow the conductivity of PCNT, it cannot consider the physical properties of CNT, such as its nano-size or interphase. Some people have also developed micromechanics models that can predict the electrical conductivity of PCNT by assuming more parameters such as the waviness of CNT and the tunneling effect;14–16 however, these employed complicated equations that are not applicable for practical applications. Moreover, these previous models commonly did not reflect the influence of the interphase, which can change the percolation level and the percentages of percolated nanotubes.
The formation of interphase regions in polymer nanocomposites has been described in many studies;17–19 this is related to the exceptional surface area of the nanofiller and the robust interfacial interaction between the polymer matrix and nanoparticles. It was also reported that the mechanical properties of polymer nanocomposites, such as the tensile modulus and strength, directly depend on the interphase level.20–23 Some simple models were established based on micromechanics models to predict the roles of the interphase dimensions and stiffness on the tensile properties.24,25 Interphase regions have also been shown to have a positive effect on the percolation level in some studies.26–28 Interphase regions create a continuous network and cause the percolation threshold to occur before the actual joining of nanoparticles. Although the role of interphase percolation on the mechanical properties of PCNT has been investigated,29,30 the impacts of the interphase on the electrical percolation and conductivity of nanocomposites have not been studied.
As mentioned, some authors have studied the tunneling conductivity of PCNT by assuming the interphase or waviness of CNT, but their complex equations cannot be applied in practice. Accordingly, a simple equation that accurately suggests the tunneling conductivity of PCNT based on the interphase and waviness does not exist. In addition, previous studies did not consider the effects of the interphase and CNT waviness on the percolation threshold, effective concentration of CNT, or the portion of percolated nanotubes. In this study, the tunneling conductivity of PCNT is modeled by a simple methodology that considers the impacts of the interphase surrounding CNT, CNT waviness, and tunneling distance. An extended nanotube is supposed by considering the effects of CNT and the tunneling distance, and its conductivity is obtained from simple equations. In addition, the roles of the interphase and waviness on the percolation threshold, effective filler fraction, and percentages of networked CNT are expressed. The predictions of the suggested approach are compared with many experimental results from the literature and the outputs are discussed. Finally, the present methodology is evaluated by plotting the conductivity at different CNT ranges and interphase parameters.
2 Theoretical approaches
The conductivity of a tunneling distance between CNT can be expressed31 by:
σd = B![[thin space (1/6-em)]](https://www.rsc.org/images/entities/char_2009.gif) exp(−Ad) exp(−Ad)
| (1) |
σd = σN![[thin space (1/6-em)]](https://www.rsc.org/images/entities/char_2009.gif) exp(−2d) exp(−2d)
| (2) |
The electrical resistance of the distance between CNT is also suggested15 as:
 | (3) |
Takeda et al.16 assumed extended nanotubes including CNT and inter-nanotube region in filler networks. They suggested two forms for the distance between nanotubes as shown in Fig. 1. For above form, it was suggested that contact area at overlapping position is (2R)2 (R is CNT radius), while the contact area is about the cross-sectional area of nanotubes as πR2 for another type. As a result, an average contact area can be approximated as 3R2 which results in:
 | (4) |
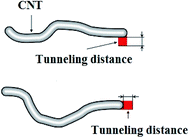 | ||
| Fig. 1 Different forms of tunneling distance between nanotubes, where extended nanotube includes CNT and inter-nanotube region.16 | ||
By substituting of eqn (2) into latter equation, the resistance of tunnel distance between CNT is calculated by:
 | (5) |
In addition, it was suggested that the electrical resistance of effective CNT involves the resistances of CNT and tunneling distance16 as:
| RND = RN + Rd | (6) |
 | (7) |
 | (8) |
The conductivity of extended CNT can be suggested by rewriting of eqn (7) as:
 | (9) |
 | (10) |
By replacing of “RND” from eqn (8) into above equation, the electrical conductivity of extended CNT is estimated by:
 | (11) |
Deng and Zheng14 proposed a model for electrical conductivity of PCNT reinforcing with randomly straight CNT after percolation threshold as:
 | (12) |
By substituting of “σND” from eqn (11) into above equation, it is possible to calculate the conductivity of PCNT by tunneling effect as:
 | (13) |
The percolation threshold for CNT in PCNT containing random dispersion of nanoparticles was proposed33 as:
 | (14) |
“V” and “Vex” in for random distribution of CNT in PCNT were expressed33 as:
| V = πR2l + (4/3)πR3 | (15) |
 | (16) |
However, the interphase layer surrounding CNT speeds up the development of a conductive network in PCNT which should be taken into account in percolation threshold. The interphase zones decrease the excluded volume30 as:
 | (17) |
Moreover, the enormous aspect ratio of CNT (ratio of length to diameter) produces waviness in CNT which decreases their effectiveness. An equivalent length as “leq” can be considered for curved nanotubes based on Fig. 2a. A waviness factor can be also defined as:
 | (18) |
 | ||
| Fig. 2 (a) waved and straight CNT and (b) effective nanotube assuming interphase.15 | ||
When “leq” as the effective length of waved CNT is supposed in eqn (17) by leq = l/u, the excluded volume assuming interphase and CNT waviness is presented as:
 | (19) |
Also, the waviness does not affect the volume of CNT.
Now, the percolation threshold by the influences of interphase and waviness can be suggested as:
 | (20) |
It will be shown in the next section that this equation can suggest useful predictions for percolation threshold of nanoparticles in PCNT.
CNT and surrounding interphase can be included in effective CNT (Fig. 2b) which change the general properties of PCNT. The effective volume fraction of effective CNT assuming the roles of interphase and curvature15 can be expressed as:
 | (21) |
Additionally, only a number of CNT are employed in the continuous network after percolation, while others are dispersed in PCNT. “f” parameter as the percentages of percolated CNT15 is calculated by:
 | (22) |
It was also indicated that the curvature of CNT deteriorates its nature conductivity.14 The role of waviness in “σN” parameter is considered as:
 | (23) |
The suggested equations for “f”, “ϕeff” and “σN” terms can be used in eqn (13) to predict the electrical conductivity of PCNT based on tunneling mechanism by the roles of interphase, waviness and tunneling distance.
3 Results and discussion
The suggested methodology for tunneling conductivity of PCNT can be examined by experimental results. Too, the efficiencies of parameters on the conductivity of PCNT can be revealed by the suggested equations.Fig. 3 demonstrates the experimental results and predictions for epoxy/single walled CNT (SWCNT) (R = 1 nm, l = 2 μm, u = 1.6),34 epoxy/multi walled CNT (MWCNT) (R = 8 nm, l = 30 μm, u = 1.2),35 ultrahigh molecular weight polyethylene/MWCNT (R = 8 nm, l = 8 μm, u = 1.2)36 and polycarbonate/acrylonitrile butadiene styrene/MWCNT (R = 5 nm, l = 1.5 μm, u = 1.2).10 The nature conductivity of both SWCNT and MWCNT are assumed as 106 S m−1. A good agreement between the measurements of conductivity and the calculations are observed in all samples demonstrating the predictability of the suggested model for tunneling mechanism of electrical conductivity in PCNT. Therefore, the presented model can estimate the electrical conductivity of PCNT by tunneling mechanism assuming the influences of CNT curvature, interphase surrounding nanoparticles and tunneling distance.
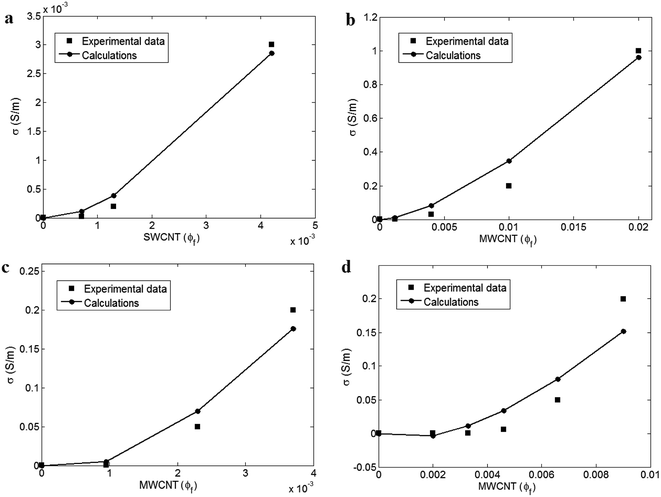 | ||
| Fig. 3 Comparison between experimental results and predictions for (a) epoxy/SWCNT,34 (b) epoxy/MWCNT,35 (c) ultrahigh molecular weight polyethylene/MWCNT36 and (d) polycarbonate/acrylonitrile butadiene styrene/MWCNT10 samples. | ||
The correct predictions of model indicate the formation of interphase in PCNT samples. The values of interphase thickness (t) can be obtained by comparison of experimental percolation threshold with the calculations of eqn (20). The epoxy/SWCNT, epoxy/MWCNT, ultrahigh molecular weight polyethylene/MWCNT and polycarbonate/acrylonitrile butadiene styrene/MWCNT samples show “ϕp” levels of 0.0003, 0.0002, 0.0007 and 0.002 by the experimental levels of conductivity, respectively. Applying eqn (20), the best values of “t” are obtained as 3, 7, 7 and 5 for these samples, correspondingly. So, it is concluded that eqn (20) is valid, because it can predict the percolation level of PCNT by logical interphase thickness. Moreover, it is possible to compare the thickness of interphase in the samples which depends on the interfacial properties,37 i.e. a thicker interphase shows a stronger interaction/bonding between polymer matrix and nanoparticles.
By the properties of CNT and “t” values, the values of “d” can be calculated. The predictions suggest d = 9.7, 8.5, 7.4 and 7.4 nm for epoxy/SWCNT, epoxy/MWCNT, ultrahigh molecular weight polyethylene/MWCNT and polycarbonate/acrylonitrile butadiene styrene/MWCNT samples, respectively. The maximum allowed range for tunneling distance between nanotubes was reported as 10 nm.38 As a result, the suggested model shows proper calculations of tunneling distance for the reported samples confirming its predictability. Conclusively, the suggested methodology can predict the percolation threshold, interphase thickness and tunneling distance by the measurements of electrical conductivity of PCNT.
The effects of different parameters on the electrical conductivity of PCNT can be investigated by the suggested model. In all calculations, the conductivity of CNT is considered as 106 S m−1.
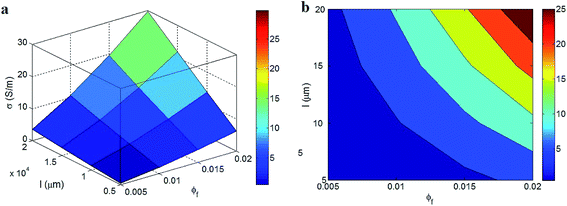
Fig. 4 illustrates the roles of “ϕf” and “l” parameters in the predicted conductivity at R = 10 nm, t = 2 nm, u = 1.25 and d = 6 nm. The best outputs are shown at the highest levels of “ϕf” and “l” parameters, but the low ranges of these parameters decrease the conductivity. A poor conductivity around 0 is observed at ϕf < 0.01 and l < 10 μm demonstrating the negative influences of low “ϕf” and “l” parameters on tunneling conductivity. On the other hand, the best conductivity as 25 S m−1 is obtained at ϕf = 0.02 and l = 20 μm. Therefore, the CNT concentration and length cause positive effects on the electrical conductivity of PCNT.
CNT commonly are much more conductive than polymer matrices. The conductivity of CNT commonly reaches to 106 S m−1, while the conductivity of polymers is reported at about 10−14 S m−1. So, the conductivity of PCNT significantly changes when a low amount of CNT is dispersed in polymer matrix, because a small number of CNT can form a percolated conductive network in polymer matrix which considerably improves the electrical conductivity of PCNT. Obviously, a higher loading of nanoparticles above percolation threshold enlarges the density of network which increases the charge transfer. Other models in literature also showed the similar effect of “ϕf” parameter on conductivity.16,32 In addition, long CNT raise the aspect ratio which decreases the needed number of CNT to form the conductive network. In fact, the longer CNT can be more easily interacted and connected in PCNT compared to short ones which ease their networking. Also, larger nanotubes can produce a bigger and denser network which quickly transports electrons whole of PCNT. The positive role of CNT length in the conductivity of PCNT has been reported in previous studies.39 Accordingly, the suggested approach properly predicts the influences of “ϕf” and “l” parameters on the tunneling conductivity of PCNT.
The variations of conductivity at different levels of “R” and “t” parameters and average ϕf = 0.01, l = 10 μm, u = 1.25 and d = 6 nm are observed in Fig. 5. The different roles of these parameters in conductivity are shown in this illustration, where low “R” and large “t” grow the conductivity. As observed, σ = 7 S m−1 is achieved at R = 10 nm and t = 4 nm, while R > 40 nm and t < 1 nm significantly decrease the conductivity to about 0.6 S m−1. As a result, a high tunneling conductivity is obtained by thin nanotubes and thick interphase, while thick CNT and absence or formation of thin interphase cause poor conductivity.
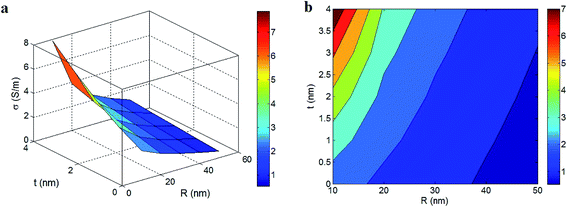 | ||
| Fig. 5 The conductivity of PCNT as a function of “R” and “t” parameters at average ϕf = 0.01, l = 10 μm, u = 1.25 and d = 6 nm: (a) 3D and (b) contour patterns. | ||
The effect of “R” parameter on the conductivity is attributed to its roles in percolation threshold (eqn (20)), effective filler fraction (eqn (21)) and the percentages of percolated filler (eqn (22)). In fact, thin nanotubes produce a low percolation level, more effective CNT and a high number of networked CNT. On the other hand, the conductivity of PCNT improves by poor percolation threshold and the high levels of effective and networked nanotubes. As a result, it is logical to obtain a strong conductivity by thin CNT. The previous articles have related the effect of CNT radius on percolation level and conductivity of PCNT by aspect ratio.24 They reported a similar trend between percolation effect and CNT radius which confirms the suggested model.
The interphase thickness also plays a positive role in percolation threshold, effective CNT and the percentages of networked CNT. The interphase creates a layer around nanotubes which approaches the nanotubes and produces a conductive network at low filler fraction. In addition, a thick interphase thickens the effective CNT (Fig. 2b) which enlarges “ϕeff” parameter. Since the interphase employs many nanotubes for networking, it effectively increases the level of percolated CNT in the network. Accordingly, a high level of interphase thickness undoubtedly raises the conductivity of PCNT. The effects of interphase on percolation threshold and effective CNT were indicated in the literature,15 but its role in tunneling conductivity was not shown in the preceding works. Conclusively, the roles of “R” and “t” parameters in tunneling conductivity of PCNT are well justified which show the correctness of the presented approach.
Fig. 6 exhibits the influences of “u” and “d” parameters on the tunneling conductivity of PCNT at ϕf = 0.01, R = 10 nm, l = 10 μm and t = 2 nm. As observed, the high levels of “u” and “d” cannot improve the conductivity of PCNT, but the least values of these parameters significantly improve the conductivity. As shown, u > 2.5 and d < 5.2 nm cannot promote the conductivity of PCNT, while σ = 350 S m−1 is achieved at u = 1 and d = 4 nm. As a result, “u” and “d” parameters show direct effects on tunneling conductivity revealing that the conductivity is negatively related to the high levels of waviness and tunneling distance. It means that the small levels of these parameters are necessary in practice to obtain a high level of conductivity in PCNT.
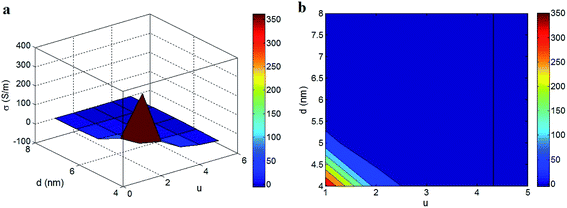 | ||
| Fig. 6 (a) 3D and (b) contour plans for the roles of “u” and “d” parameters in the conductivity of PCNT at ϕf = 0.01, R = 10 nm, l = 10 μm and t = 2 nm. | ||
“u” parameter determines the effective length of nanotubes in PCNT. A low level of “u” shows a poor waviness, but a high “u” demonstrates the more curvature of CNT in PCNT which decreases the effectiveness of CNT. A high level of waviness negatively affects the percolation threshold, effective nanoparticles and the number of CNT in the conductive network, due to the reduced length of an equivalent nanotube. Moreover, it was mentioned that the waviness reduces the conductivity of CNT according to eqn (23). Therefore, the waviness of CNT weakens the effects of CNT on the network levels which results in an insulate network. The detrimental effects of waviness on the electrical and mechanical properties of PCNT were also reported in different papers.40,41 So, the suggested model properly shows the negative effect of waviness on the tunneling conductivity of PCNT.
The electron tunneling in PCNT extremely depends on the separation distance between CNT. When the separation distance is larger than a critical level, the nanotubes cannot cause tunneling and PCNT is insulated. However, the separate distance between CNT decreases when CNT volume fraction growths, where CNT can form conductive networks even by a distance of 2 nm.15 Moreover, the percolated CNT are still in electrical contact rather than physical attachments, due to van der Waals attractions among CNT. Therefore, the separation distance between nanotubes is an important parameter which manages the electrical conductivity, because the high distance cannot cause tunneling effect. In fact, “d” parameter is a border of conductivity and insulating in PCNT, as well observed by the suggested model. Some authors studied the tunneling distance, but they did not explicitly show the effect of this parameter on conductivity. However, the presented methodology reasonably reveals the role of tunneling distance in electrical conductivity of PCNT.
The variations of conductivity by different values of “ϕp” and “ϕeff” at u = 1.25, l = 10 μm and d = 6 nm are also shown in Fig. 7. A low “ϕeff” mainly decreases the conductivity, but the small level of “ϕp” and the great value of “ϕeff” increase the conductivity. As a result, the lowest ϕeff < 0.014 produces the slightest conductivity as about 0, while the best conductivity as 30 S m−1 is observed at ϕp = 0.001 and ϕeff = 0.05. Generally, it can be stated that “ϕp” and “ϕeff” parameters inversely and directly affect the conductivity, respectively.
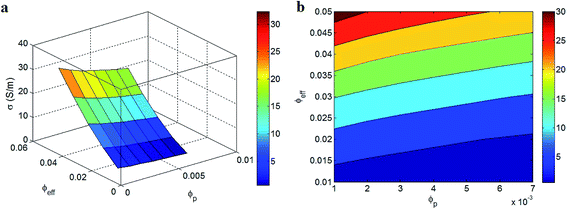 | ||
| Fig. 7 The tunneling conductivity of PCNT as a function of “ϕp” and “ϕeff” parameters at u = 1.25, l = 10 μm and d = 6 nm by (a) 3D and (b) contour plots. | ||
“ϕp” is a critical fraction of nanoparticles which causes the conductivity in PCNT. Also, a low level of “ϕp” induces good effect on the fraction of percolated CNT demonstrating that a poor percolation threshold causes positive influences on the properties of network in PCNT. Accordingly, a slight percolation threshold clearly leads to a high level of conductivity in PCNT. The literature reports have extensively calculated the percolation threshold by a conventional power-law model,32,34 but they rarely evaluated the effect of percolation threshold on the network extent and electrical conductivity of PCNT. Generally, the suggested methodology shows an inverse relation between “ϕp” parameter and electrical conductivity which shows a good agreement with other suggested models.34 In addition, a high level of “ϕeff” is calculated by thin and long CNT as well as thick interphase based on eqn (21) and Fig. 2b. It is clear a better level of conductivity is achieved by a greater “ϕeff”, because it indicates the optimistic contributions of CNT and interphase in performances of PCNT. As a result, “ϕeff” parameter is a sign of effective CNT in PCNT which directly changes the conductivity of PCNT.
Fig. 8 also reveals the influences of “f” and “σN” parameters on the conductivity of PCNT at average levels of other factors. The best conductivity is obtained by the highest levels of these parameters. The maximum levels of f = 0.5 and σN = 106 S m−1 result in the best conductivity of 14 S m−1. However, the little levels of these parameters as f < 0.2 and σN < 3 × 10⁵ S m−1 decrease the conductivity to about 0. Therefore, the conductivity of PCNT directly depends on the fraction of percolated network and the conductivity of CNT. These evidences indicate that the researchers should attempt to provide a high level of networked fraction and use super-conductive CNT to promote the conductivity of nanocomposites.
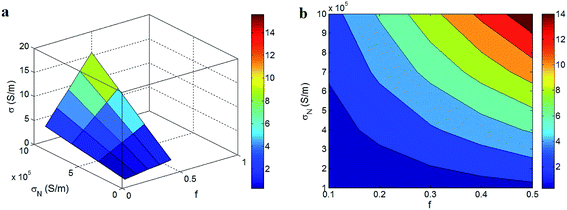 | ||
| Fig. 8 The conductivity of PCNT at different levels of “f” and “σN” parameters at ϕf = 0.01, R = 10 nm, l = 10 μm, t = 2 nm, u = 1.25 and d = 6 nm. | ||
The electron transportation in PCNT is performed by the network of CNT. Clearly, a large and dense network can effectively transfer the electrons, while a poor network decreases the level of electron current in PCNT. As a result, the conductivity of PCNT highly depends on the network level, because it manages the electron transportation. A higher level of “f” shows the presence of more nanotubes in network phase which produces high conductivity, while a low “f” demonstrates the formation of a small network which negatively affects the conductivity. Some authors have reported the direct effects of network properties on the electrical conductivity of polymer nanocomposites.9
On the other hand, the electrical conductivity of PCNT reasonably depends on the nature conduction of CNT, because CNT conduction lonely determines the conductivity of filler networks and PCNT and polymer matrices are insulate. Accordingly, the higher-conductive CNT more improve the conductivity of PCNT, whereas a less filler conductivity cannot change the conductivity of produced composite. However, it was reported that the conductivity of CNT depends on their size, curvature and defects,42 where thin, straight and less-defective CNT show the best conduction. Therefore, it is important to provide thin, straight and perfective CNT to use the full advantages of nanoparticles such as big surface area and conductivity in PCNT. Generally, the influences of “f” and “σN” parameters on tunneling conductivity of PCNT are acceptable which confirm the predictions of the suggested approach.
4 Conclusions
A simple model was presented to predict the tunneling conductivity of polymer/CNT nanocomposites by assuming the effects of the tunneling distance, interphase, and CNT waviness. The conductivity of CNT and tunneling distance were considered by using an extended CNT. Moreover, the roles of interphase thickness and CNT waviness on the percolation threshold, effective filler fraction, and percentages of percolated CNT were considered in the suggested model.The predictions of the suggested methodology agree with the experimental conductivity results. Also, it is possible to calculate some parameters, such as the percolation threshold, interphase thickness, and tunneling distance, by applying the experimental results to the suggested model. A poor conductivity near 0 is observed at ϕf < 0.01 and l < 10 μm, while the best conductivity (25 S m−1) is obtained at the highest ϕf = 0.02 and l = 20 μm. Also, σ = 7 S m−1 is obtained at R = 10 nm and t = 4 nm, whereas R > 40 nm and t < 1 nm result in σ = 0.6 S m−1. Moreover, u > 2.5 and d < 5.2 nm cannot increase the conductivity of PCNT, while σ = 350 S m−1 is attained at u = 1 and d = 4 nm. A low ϕeff < 0.014 produces σ = 0, but the best conductivity (30 S m−1) is observed at ϕp = 0.001 and ϕeff = 0.05. The best conductivity (14 S m−1) is also obtained with the highest levels of f = 0.5 and σN = 106 S m−1. However, small values of f < 0.2 and σN < 3 × 10⁵ S m−1 result in σ = 0. Conclusively, the concentration, length, waviness, and conductivity of CNT, interphase thickness, effective filler fraction, and network density play direct roles in the tunneling conductivity of PCNT. Moreover, a high conductivity is obtained with thin CNT, a low tunneling distance, and a slight percolation threshold.
Acknowledgements
This research was supported by the Ministry of Trade, Industry & Energy (MOTIE), Korean Institute for Advancement of Technology (KIAT) through the Encouragement Program for The Industries of Economic Co-operation Region.References
- E. N. Zare, M. M. Lakouraj, S. Ghasemi and E. Moosavi, Emulsion polymerization for the fabrication of poly(o-phenylenediamine)@ multi-walled carbon nanotubes nanocomposites: characterization and their application in the corrosion protection of 316L SS, RSC Adv., 2015, 5, 68788–68795 RSC.
- S. V. Ebadi, A. Fakhrali, S. O. Ranaei-Siadat, A. A. Gharehaghaji, S. Mazinani, M. Dinari and J. Harati, Immobilization of acetylcholinesterase on electrospun poly(acrylic acid)/multi-walled carbon nanotube nanofibrous membranes, RSC Adv., 2015, 5, 42572–42579 RSC.
- J. Yang, Y. Zhang, Z. Wang and P. Chen, Influences of high aspect ratio carbon nanotube network on normal stress difference measurements and extrusion behaviors for isotactic polypropylene nanocomposite melts, RSC Adv., 2014, 4, 1246–1255 RSC.
- A. Rostami, M. Masoomi, M. J. Fayazi and M. Vahdati, Role of multiwalled carbon nanotubes (MWCNTs) on rheological, thermal and electrical properties of PC/ABS blend, RSC Adv., 2015, 5, 32880–32890 RSC.
- M. M. Shokrieh and R. Rafiee, On the tensile behavior of an embedded carbon nanotube in polymer matrix with non-bonded interphase region, Compos. Struct., 2010, 92, 647–652 CrossRef.
- Q.-Q. Ni, C.-s. Zhang, Y. Fu, G. Dai and T. Kimura, Shape memory effect and mechanical properties of carbon nanotube/shape memory polymer nanocomposites, Compos. Struct., 2007, 81, 176–184 CrossRef.
- A. Abdolmaleki, S. Mallakpour and S. Borandeh, Amino acid-functionalized multi-walled carbon nanotubes for improving compatibility with chiral poly(amide-ester-imide) containing l-phenylalanine and l-tyrosine linkages, Appl. Surf. Sci., 2013, 287, 117–123 CrossRef CAS.
- C. Choi, S. Park and H. Choi, Carbon nanotube/polyaniline nanocomposites and their electrorheological characteristics under an applied electric field, Curr. Appl. Phys., 2007, 7, 352–355 CrossRef.
- F. Du, R. C. Scogna, W. Zhou, S. Brand, J. E. Fischer and K. I. Winey, Nanotube networks in polymer nanocomposites: rheology and electrical conductivity, Macromolecules, 2004, 37, 9048–9055 CrossRef CAS.
- S. Maiti, N. K. Shrivastava and B. Khatua, Reduction of percolation threshold through double percolation in melt-blended polycarbonate/acrylonitrile butadiene styrene/multiwall carbon nanotubes elastomer nanocomposites, Polym. Compos., 2013, 34, 570–579 CrossRef CAS.
- M. L. Clingerman, J. A. King, K. H. Schulz and J. D. Meyers, Evaluation of electrical conductivity models for conductive polymer composites, J. Appl. Polym. Sci., 2002, 83, 1341–1356 CrossRef CAS.
- L. Chang, K. Friedrich, L. Ye and P. Toro, Evaluation and visualization of the percolating networks in multi-wall carbon nanotube/epoxy composites, J. Mater. Sci., 2009, 44, 4003–4012 CrossRef CAS.
- S. Kara, E. Arda, F. Dolastir and Ö. Pekcan, Electrical and optical percolations of polystyrene latex–multiwalled carbon nanotube composites, J. Colloid Interface Sci., 2010, 344, 395–401 CrossRef CAS PubMed.
- F. Deng and Q.-S. Zheng, An analytical model of effective electrical conductivity of carbon nanotube composites, Appl. Phys. Lett., 2008, 92, 071902 CrossRef.
- C. Feng and L. Jiang, Micromechanics modeling of the electrical conductivity of carbon nanotube (CNT)–polymer nanocomposites, Composites, Part A, 2013, 47, 143–149 CrossRef CAS.
- T. Takeda, Y. Shindo, Y. Kuronuma and F. Narita, Modeling and characterization of the electrical conductivity of carbon nanotube-based polymer composites, Polymer, 2011, 52, 3852–3856 CrossRef CAS.
- Y. Zare, Development of Nicolais–Narkis model for yield strength of polymer nanocomposites reinforced with spherical nanoparticles, Int. J. Adhes. Adhes., 2016, 70, 191–195 CrossRef CAS.
- Y. Zare, Effects of imperfect interfacial adhesion between polymer and nanoparticles on the tensile modulus of clay/polymer nanocomposites, Appl. Clay Sci., 2016, 129, 65–70 CrossRef CAS.
- P. Jahanmard and A. Shojaei, Mechanical properties and structure of solvent processed novolac resin/layered silicate: development of interphase region, RSC Adv., 2015, 5, 80875–80883 RSC.
- Y. Zare, “a” interfacial parameter in Nicolais–Narkis model for yield strength of polymer particulate nanocomposites as a function of material and interphase properties, J. Colloid Interface Sci., 2016, 470, 245–249 CrossRef CAS PubMed.
- Y. Zare, Modeling approach for tensile strength of interphase layers in polymer nanocomposites, J. Colloid Interface Sci., 2016, 471, 89–93 CrossRef CAS PubMed.
- Y. Zare, A Two-Step Method Based on Micromechanical Models to Predict the Young's Modulus of Polymer Nanocomposites, Macromol. Mater. Eng., 2016, 301, 846–852 CrossRef CAS.
- B. Mortazavi, J. Bardon and S. Ahzi, Interphase effect on the elastic and thermal conductivity response of polymer nanocomposite materials: 3D finite element study, Comput. Mater. Sci., 2013, 69, 100–106 CrossRef CAS.
- Y. Zare, An approach to study the roles of percolation threshold and interphase in tensile modulus of polymer/clay nanocomposites, J. Colloid Interface Sci., 2017, 486, 249–254 CrossRef CAS PubMed.
- Y. Zare, The roles of nanoparticles accumulation and interphase properties in properties of polymer particulate nanocomposites by a multi-step methodology, Composites, Part A, 2016, 91, 127–132 CrossRef CAS.
- Y. Zare and K. Y. Rhee, Accounting the reinforcing efficiency and percolating role of interphase regions in the tensile modulus of polymer/CNT nanocomposites, Eur. Polym. J., 2017, 389–397 CrossRef CAS.
- Y. Zare and K. Y. Rhee, The mechanical behavior of CNT reinforced nanocomposites assuming imperfect interfacial bonding between matrix and nanoparticles and percolation of interphase regions, Compos. Sci. Technol., 2017, 144, 18–25 CrossRef CAS.
- Y. Zare and K. Y. Rhee, Development of a conventional model to predict the electrical conductivity of polymer/carbon nanotubes nanocomposites by interphase, waviness and contact effects, Composites, Part A, 2017, 305–312 CrossRef CAS.
- R. Qiao and L. C. Brinson, Simulation of interphase percolation and gradients in polymer nanocomposites, Compos. Sci. Technol., 2009, 69, 491–499 CrossRef CAS.
- S. C. Baxter and C. T. Robinson, Pseudo-percolation: Critical volume fractions and mechanical percolation in polymer nanocomposites, Compos. Sci. Technol., 2011, 71, 1273–1279 CrossRef CAS.
- N. Ryvkina, I. Tchmutin, J. Vilčáková, M. Pelíšková and P. Sáha, The deformation behavior of conductivity in composites where charge carrier transport is by tunneling: theoretical modeling and experimental results, Synth. Met., 2005, 148, 141–146 CrossRef CAS.
- S. Maiti, S. Suin, N. K. Shrivastava and B. Khatua, Low percolation threshold in polycarbonate/multiwalled carbon nanotubes nanocomposites through melt blending with poly (butylene terephthalate), J. Appl. Polym. Sci., 2013, 130, 543–553 CrossRef CAS.
- L. Berhan and A. Sastry, Modeling percolation in high-aspect-ratio fiber systems. I. Soft-core versus hard-core models, Phys. Rev. E, 2007, 75, 041120 CrossRef CAS PubMed.
- F. H. Gojny, M. H. Wichmann, B. Fiedler, I. A. Kinloch, W. Bauhofer, A. H. Windle and K. Schulte, Evaluation and identification of electrical and thermal conduction mechanisms in carbon nanotube/epoxy composites, Polymer, 2006, 47, 2036–2045 CrossRef CAS.
- Y. J. Kim, T. S. Shin, H. Do Choi, J. H. Kwon, Y.-C. Chung and H. G. Yoon, Electrical conductivity of chemically modified multiwalled carbon nanotube/epoxy composites, Carbon, 2005, 43, 23–30 CrossRef CAS.
- M. Lisunova, Y. P. Mamunya, N. Lebovka and A. Melezhyk, Percolation behaviour of ultrahigh molecular weight polyethylene/multi-walled carbon nanotubes composites, Eur. Polym. J., 2007, 43, 949–958 CrossRef CAS.
- Y. Zare, Development of Halpin-Tsai model for polymer nanocomposites assuming interphase properties and nanofiller size, Polym. Test., 2016, 51, 69–73 CrossRef CAS.
- J. Li, P. C. Ma, W. S. Chow, C. K. To, B. Z. Tang and J. K. Kim, Correlations between percolation threshold, dispersion state, and aspect ratio of carbon nanotubes, Adv. Funct. Mater., 2007, 17, 3207–3215 CrossRef CAS.
- R. Arenhart, G. Barra and C. Fernandes, Simulation of percolation threshold and electrical conductivity in composites filled with conductive particles: Effect of polydisperse particle size distribution, Polym. Compos., 2016, 37, 61–69 CrossRef CAS.
- D.-L. Shi, X.-Q. Feng, Y. Y. Huang, K.-C. Hwang and H. Gao, The effect of nanotube waviness and agglomeration on the elastic property of carbon nanotube-reinforced composites, J. Eng. Mater. Technol., 2004, 126, 250–257 CrossRef CAS.
- R. Rafiee, Influence of carbon nanotube waviness on the stiffness reduction of CNT/polymer composites, Compos. Struct., 2013, 97, 304–309 CrossRef.
- C. J. Lee, R. Salehiyan, D. S. Ham, S. K. Cho, S.-J. Lee, K. J. Kim, Y. Yoo, K. Hyun, J. H. Lee and W. J. Choi, Influence of carbon nanotubes localization and transfer on electrical conductivity in PA66/(PS/PPE)/CNTs nanocomposites, Polymer, 2016, 84, 198–208 CrossRef CAS.
| This journal is © The Royal Society of Chemistry 2017 |

