
 Open Access Article
 This Open Access Article is licensed under a Creative Commons Attribution-Non Commercial 3.0 Unported Licence
Improved electrochemical performance of LiFe0.4Mn0.6PO4/C with Cr3+ doping
Peng Xiao ,
Yuanyuan Cai,
Xueping Chen,
Zhaomin Sheng and
Chengkang Chang*
,
Yuanyuan Cai,
Xueping Chen,
Zhaomin Sheng and
Chengkang Chang*
School of Materials Science and Engineering, Shanghai Institute of Technology, 100 Haiquan Road, Shanghai 201418, China. E-mail: ckchang@sit.edu.cn
First published on 21st June 2017
Abstract
LiFe0.4Mn0.6−xCrxPO4/C (x ≤ 0.01) cathode materials with different Cr-doping were synthesized by a nano-milling assisted solid-state method. The experimental results demonstrated that Cr-doping can significantly improve the electrochemical performance of the target material. Among the samples synthesized, the LiFe0.4Mn0.595Cr0.005PO4/C (with 0.5 atm% of Cr) sample exhibited the highest specific capacity and the best rate performance. It delivered initial discharge capacities of 164.0, 156.2, 147.5 and 139.3 mA h g−1 at 0.1C, 0.5C, 2C and 5C, respectively. Moreover, it showed the best cycle stability with capacity retention of 99.2% after 50 cycles at 0.1C. Such enhancement can be ascribed to the improvements in not only the electronic conductivity, but also the Li ion diffusion coefficient. Powder conductivity tests revealed that the conductivity of the powder sample with 0.5% Cr doping presents the highest conductivity of 5.91 × 10⁻⁵ S cm−1, which is almost 5.3 times that of the pristine sample. Calculations of diffusion coefficients using the EIS data also suggested a highest Li ion diffusion coefficient of 4.36 × 10⁻¹⁰ cm2 s−1 for the sample with 0.5% Cr doping, which is almost 4.6 times that of the pristine sample. The synthesized LiFe0.4Mn0.595Cr0.005PO4/C with such excellent electrochemical performance showed great potential for application in high-power devices.
Introduction
In recent years, phosphate-based cathode materials have attracted considerable attention as potential alternatives to commercial layered cathode materials due to their superiorities in structural stability, cost effectiveness and environmental friendliness. Olivine-structured LiFePO4 has attracted wide attention and been widely studied since 1997,1 due to its relatively high theoretical capacity (∼170 mA h g−1), high safety, and low cost. However, its energy density related to a low cell voltage (3.4 V vs. Li/Li+) limits its use in electronic vehicles.2–5 LiMnPO4 has a higher energy density than LiFePO4 because of its higher operating voltage (4.1 V vs. Li/Li+) for the Mn3+/Mn2+ couple, about 20% higher than that of the Fe3+/Fe2+ couple.5–8 However, LiMnPO4 is an insulator with about 2 eV energy band gap9 and the inevitable John–Teller effect occurring at the mismatched interface of LiMnPO4/MnPO4 during charge/discharge creates a large kinetic barrier for ion and electron hopping, which leads to its low electronic conductivity.10 LiFePO4 is regarded as a semiconductor with about 0.3 eV energy band gap. The electronic conductivity of LiMnPO4 (<10−10 S cm−1) is much lower in comparison with that of LiFePO4 (∼10−8 S cm−1),11,12 resulting in a much poorer electrochemical performance. There have been many efforts in recent years to increase the electronic conductivity of LiMnPO4 by decreasing the particle size,13–16 coating with electronically conducting agents,17–21 or doping with cations such as Mg2+, Fe2+, Cu2+, Co2+, Ni2+, Ca2+ and Zn2+.22–26 Decreasing the particle size could reduce the transport distance of electrons and Li-ions, which can enhance the rate performance. Coating with electronically conducting agents can increase the surface conductivity. Cation doping is also considered as the significant way since it can introduce defects into the crystal lattice and therefore greatly increase the bulk conductivity. At present, the solid solution LiFexMn1−xPO4 that could operate at voltages of 3.5–4.1 V is regarded as a promising alternative choice,27–35 because the solid solution combines the advantages of relative high electronic conductivity of LiFePO4 and relative high voltage of LiMnPO4.Although the development of LiFexMn1−xPO4 solid solution can improve the electrochemical performance, the result is not so satisfying, further works are still needed before it could be considered for industrialization. The effect of partial doping of LiFePO4 or LiMnPO4 with Cr on the structural and electrochemical performance of has been investigated by several groups,35–39 but no work on the solid solution LiFe1−xMnxPO4 was reported. It is anticipated by the previous works that Cr doping might allow the formation of more stable phase and enhance the electronic conductivity, which would improve the electrochemical performance, including enhanced specific capacity at high rates and superior cyclic performance. Shi et al. used first principle method to calculate the electronic band structure for Cr-doped LiFePO4, and their calculation indicated that an enhancement of the electronic conductivity up to eight orders of magnitude could be achieved when lithium ions were replaced by cations with Cr3+.36 Wu et al. prepared LiMn1−xCrxPO4/C (x = 0, 0.01, 0.03, and 0.05), and the result confirmed that LiMn0.97Cr0.03PO4/C exhibited the best electrochemical performance.37
In an earlier study, we also reported the enhanced electrochemical performance of LiMn1−xFexPO4 solid solutions.40 It was found that LiFe0.4Mn0.6PO4/C showed the best performance. In this study, detailed investigation on the effects of Cr doping on the electrochemical performances was carried out. Partial replacing of Mn2+ ions by Cr3+ ions is applied and LiFe0.4Mn0.6−xCryPO4 (x = 0, x = 0.002, x = 0.005, x = 0.01) samples were synthesized by a nano-milling assisted solid-state method. The experimental results demonstrated that Cr doping is an effective way to improve the electrochemical behavior and LiFe0.4Mn0.595Cr0.005PO4/C cathode material exhibits the best electrochemical behavior in terms of specific capacity and rate performance, due to the enhancement in both the electronic conductivity and the Li ion diffusion coefficient.
Results and discussion
The XRD patterns of LiFe0.4Mn0.6−xCrxPO4/C (x = 0, x = 0.002, x = 0.005, x = 0.01) are shown in Fig. 1. The crystal structures of all samples consistent with standard olivine structure of PDF #01-072-7844, and no feature peaks of impurities are observed, which indicates pure phased powders were synthesized through the experimental process. The sharp peaks indicate that all the samples are well crystallized. In the XRD patterns, no peaks can be associated with the surface carbon coating, which may be attributed to the low content and amorphous nature of the carbon coating layer. In order to obtain more detailed information for the structure of the samples, lattice parameters and unit cell volumes are acquired by Rietveld refinement of XRD. The refinement was carried out by assumption of Cr at Mn site (4b) in this work. Table 1 lists the lattice parameters and the Mn/Cr atoms of occupying of the samples. When the confidence factor Rwp is blow 10%, the refinement results are reliable and acceptable. So, in our case, the small Rwp demostrated the proposed structural model is correct. From Table 1, it can be seen that no significant change in the lattice parameters is observed, due to the low content of Cr doping. Furthermore, it can be seen from the table that the content of Cr obtained by refinement is consistent with the nominal composition (Fig. 2).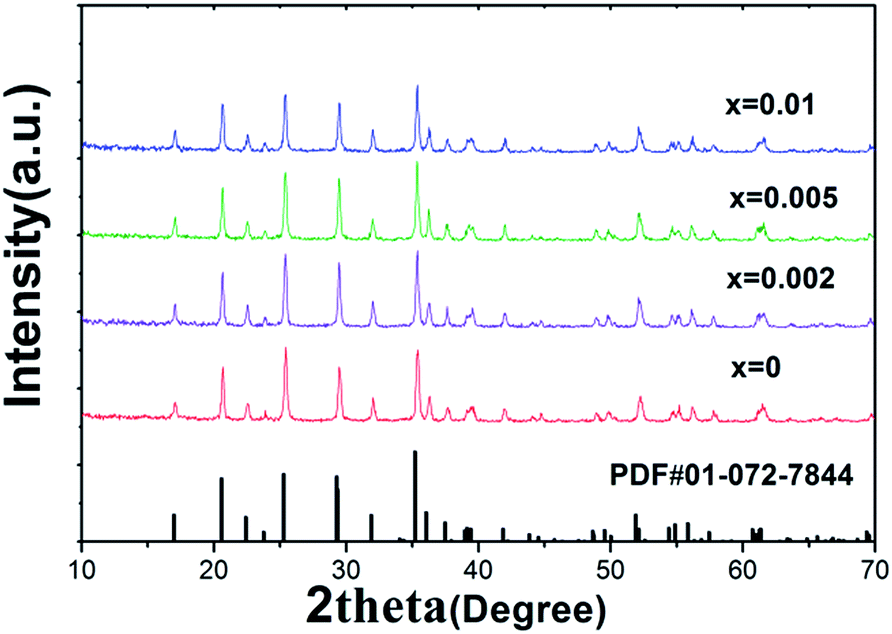 | ||
| Fig. 1 X-ray patterns of LiFe0.4Mn0.6−xCrxPO4/C samples (x = 0, x = 0.002, x = 0.005, x = 0.01) reference peak (PDF #01-072-7844) is given in the bottom. | ||
| Sample | ||||
|---|---|---|---|---|
| x = 0 | x = 0.002 | x = 0.005 | x = 0.01 | |
| a (Å) | 4.72449 | 4.72302 | 4.72151 | 4.71996 |
| b (Å) | 10.40054 | 10.39894 | 10.39473 | 10.39252 |
| c (Å) | 6.06376 | 6.05998 | 6.06138 | 6.05595 |
| V (Å3) | 297.96 | 297.63 | 297.49 | 297.06 |
| Atom | ||||||||
|---|---|---|---|---|---|---|---|---|
| Mn | Cr | Mn | Cr | Mn | Cr | Mn | Cr | |
| x/a | 0.97362 | — | 0.97362 | 0.97361 | 0.97360 | 0.97051 | 0.97362 | 0.97361 |
| y/b | 0.28199 | — | 0.28199 | 0.28198 | 0.28195 | 0.28203 | 0.28199 | 0.28199 |
| z/c | 0.25 | — | 0.25 | 0.25 | 0.25 | 0.25 | 0.25 | 0.25 |
| Occupancy | 0.6 | — | 0.59813 | 0.00187 | 0.59492 | 0.00508 | 0.58576 | 0.0124 |
| Rwp | 9.75% | 9.89% | 9.85% | 9.96% |
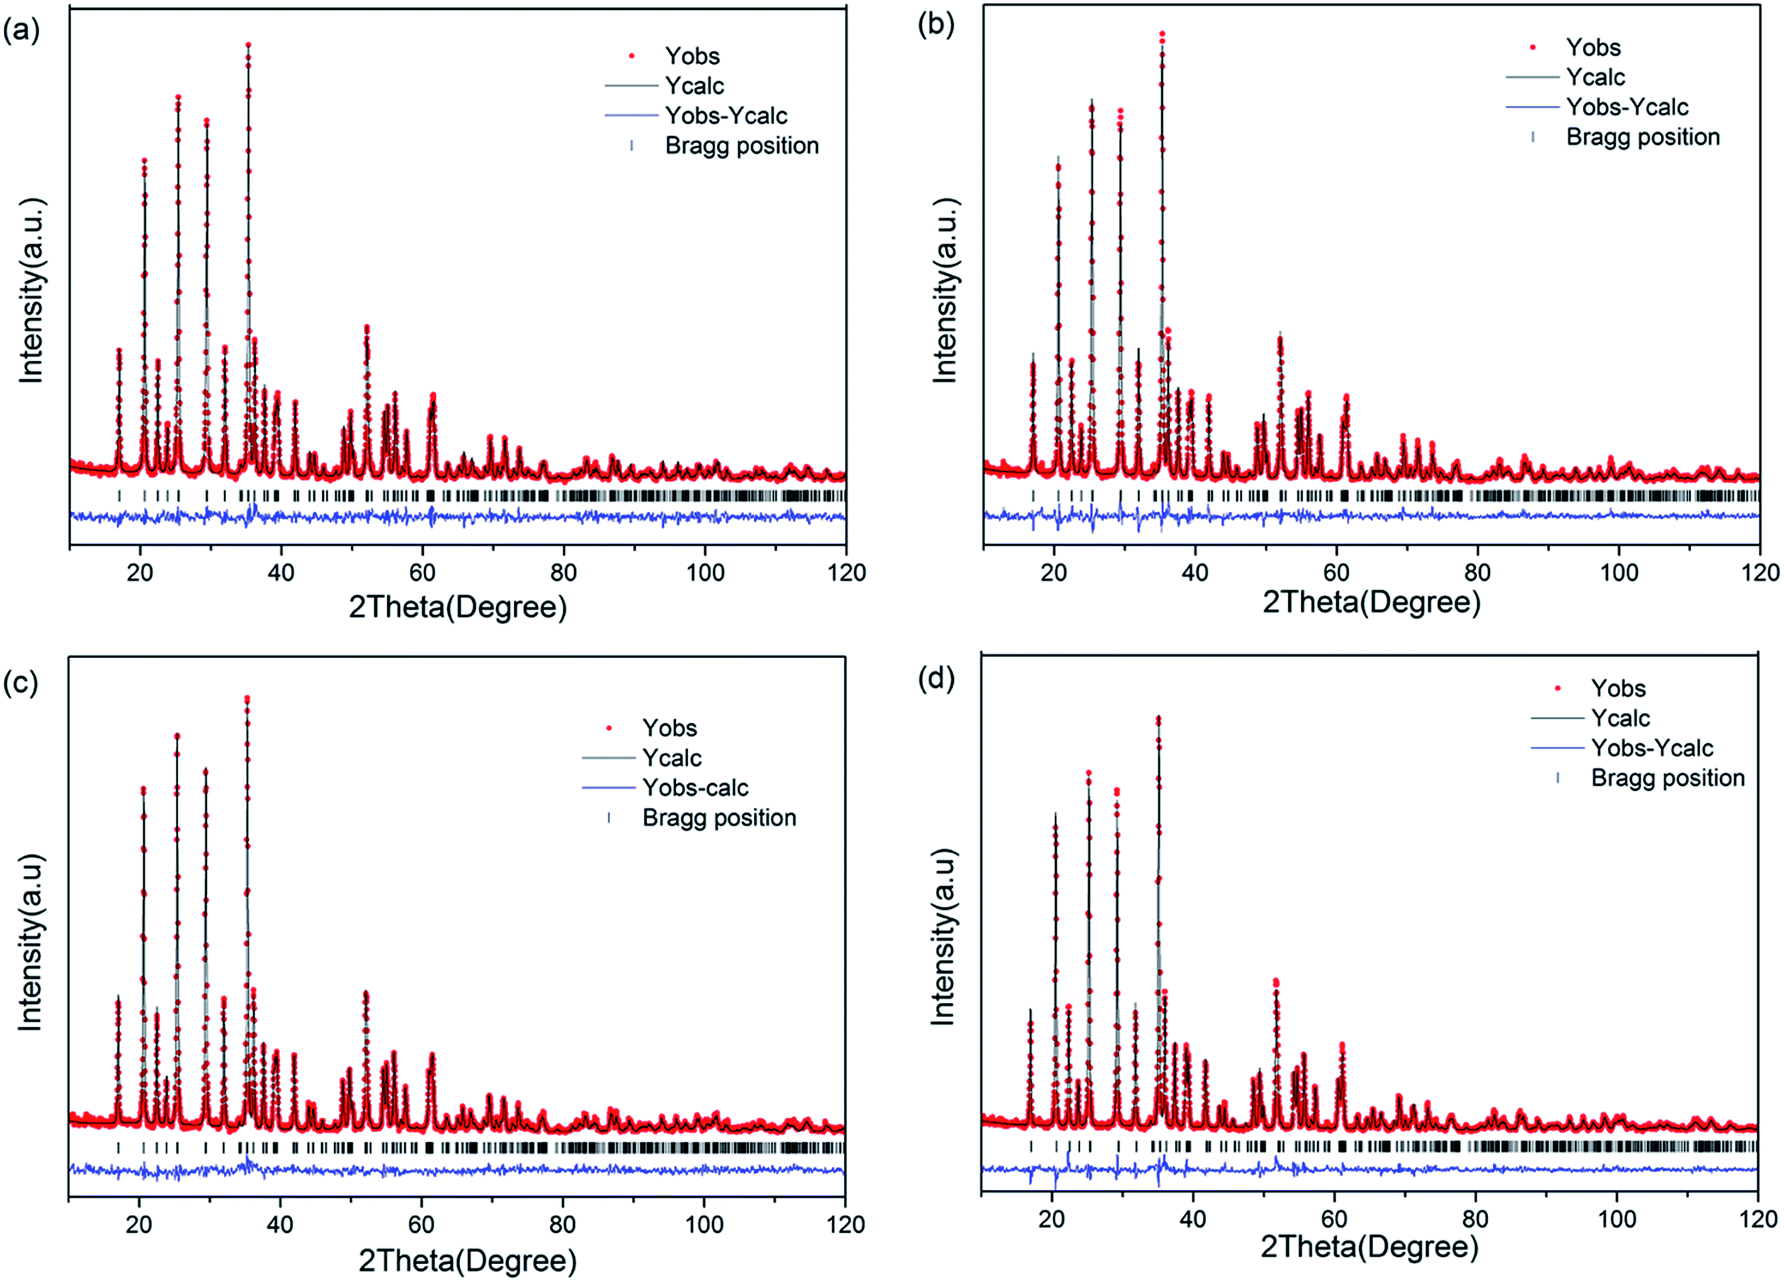 | ||
| Fig. 2 Rietveld refinement of LiFe0.4Mn0.6−xCrxPO4/C samples: (a) x = 0; (b) x = 0.002; (c) x = 0.005; (d) x = 0.01. | ||
To investigate the morphology and elemental distribution of the samples, SEM and EDS analysis were carried out on LiFe0.4Mn0.595Cr0.005PO4/C in Fig. 3. All the samples revealed similar morphology and close particle size distribution. It can be clearly seen that the sample powder is composed of porous microspheres with size of about 2–5 μm in Fig. 3(a), and these microspheres are constructed by numerous nanoparticles that have a particle size distributed from 20 nm to 50 nm in Fig. 3(b). The porous microspheres of the sample will have excellent cycle stability during the charge–discharge process due to stable three-dimension framework, and the numerous nanoparticles which aggregate to form porous microspheres can enhance the transmission of Li ions by providing a short path for the intercalation/deintercalation of lithium ions. Interconnected mesopores were also confirmed among the primary particles. The existence of such mesopores is good for infiltration of liquid electrolyte and thus increases the transportation rate of the Li+ in the microspheres.
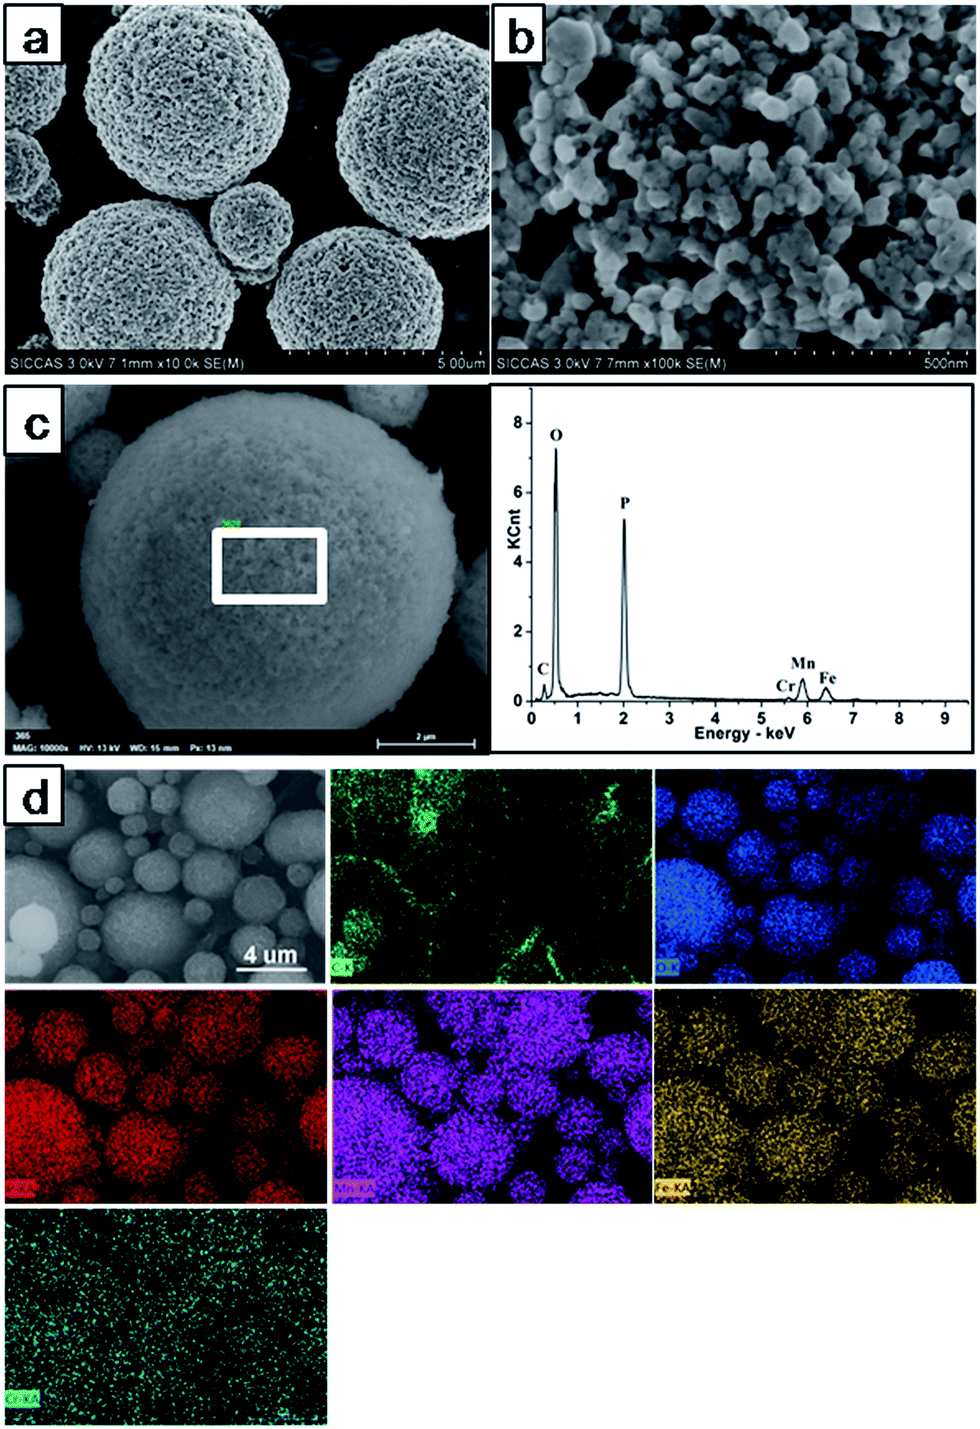 | ||
| Fig. 3 SEM and EDS characterization of LiFe0.4Mn0.595Cr0.005PO4/C: (a) and (b) SEM images; (c) EDS images of the selective area; (d) the elemental mapping of C, O, P, Mn, Fe and Cr. | ||
EDS analysis were performed and the results are shown in Fig. 3(c) and (d). The typical C, O, P, Mn, Fe and Cr peaks can be observed from Fig. 3(c), which reveals the presence of C, O, P, Mn, Fe and Cr in the LiFe0.4Mn0.595Cr0.005PO4/C sample. From the EDS mapping results (Fig. 3(d)), it can be clearly seen that Mn, Fe and Cr are uniformly distributed in the LiFe0.4Mn0.595Cr0.005PO4/C sample. Moreover, it is also observed a uniform distribution of carbon on the surface of LiFe0.4Mn0.595Cr0.005PO4/C particles.
The metal chemical states of LiFe0.4Mn0.595Cr0.005PO4/C sample was investigated by X-ray photoelectron spectroscopy (XPS). The XPS full spectra of the LiFe0.4Mn0.595Cr0.005PO4/C sample in Fig. 4(a), we can clearly see the peaks cprresponding to P 2p, C 1s, O 1s, Mn 2p and Fe 2p. In Fig. 4(b), the Mn 2p spectra split into two parts at 653.68 eV (2p1/2) and 641.78 eV (2p3/2) with a satellite peak in 646.38 eV, which are consistent with the characteristic of Mn2+. The Fe 2p spectrum in Fig. 4(c) splits into two peaks at 710.78 eV (Fe 2p3/2) and 724.28 eV (Fe 2p1/2), together with two satellite peaks at 715.18 eV and 729.48 eV, indicating the spin–orbit coupling of Fe2+. The Cr 2p orbital is clearly resolved into Cr 2p3/2 (575.68 eV) and Cr 2p1/2 (587.88 eV) contributions in Fig. 4(d), corresponding to the characteristic of Cr3+.
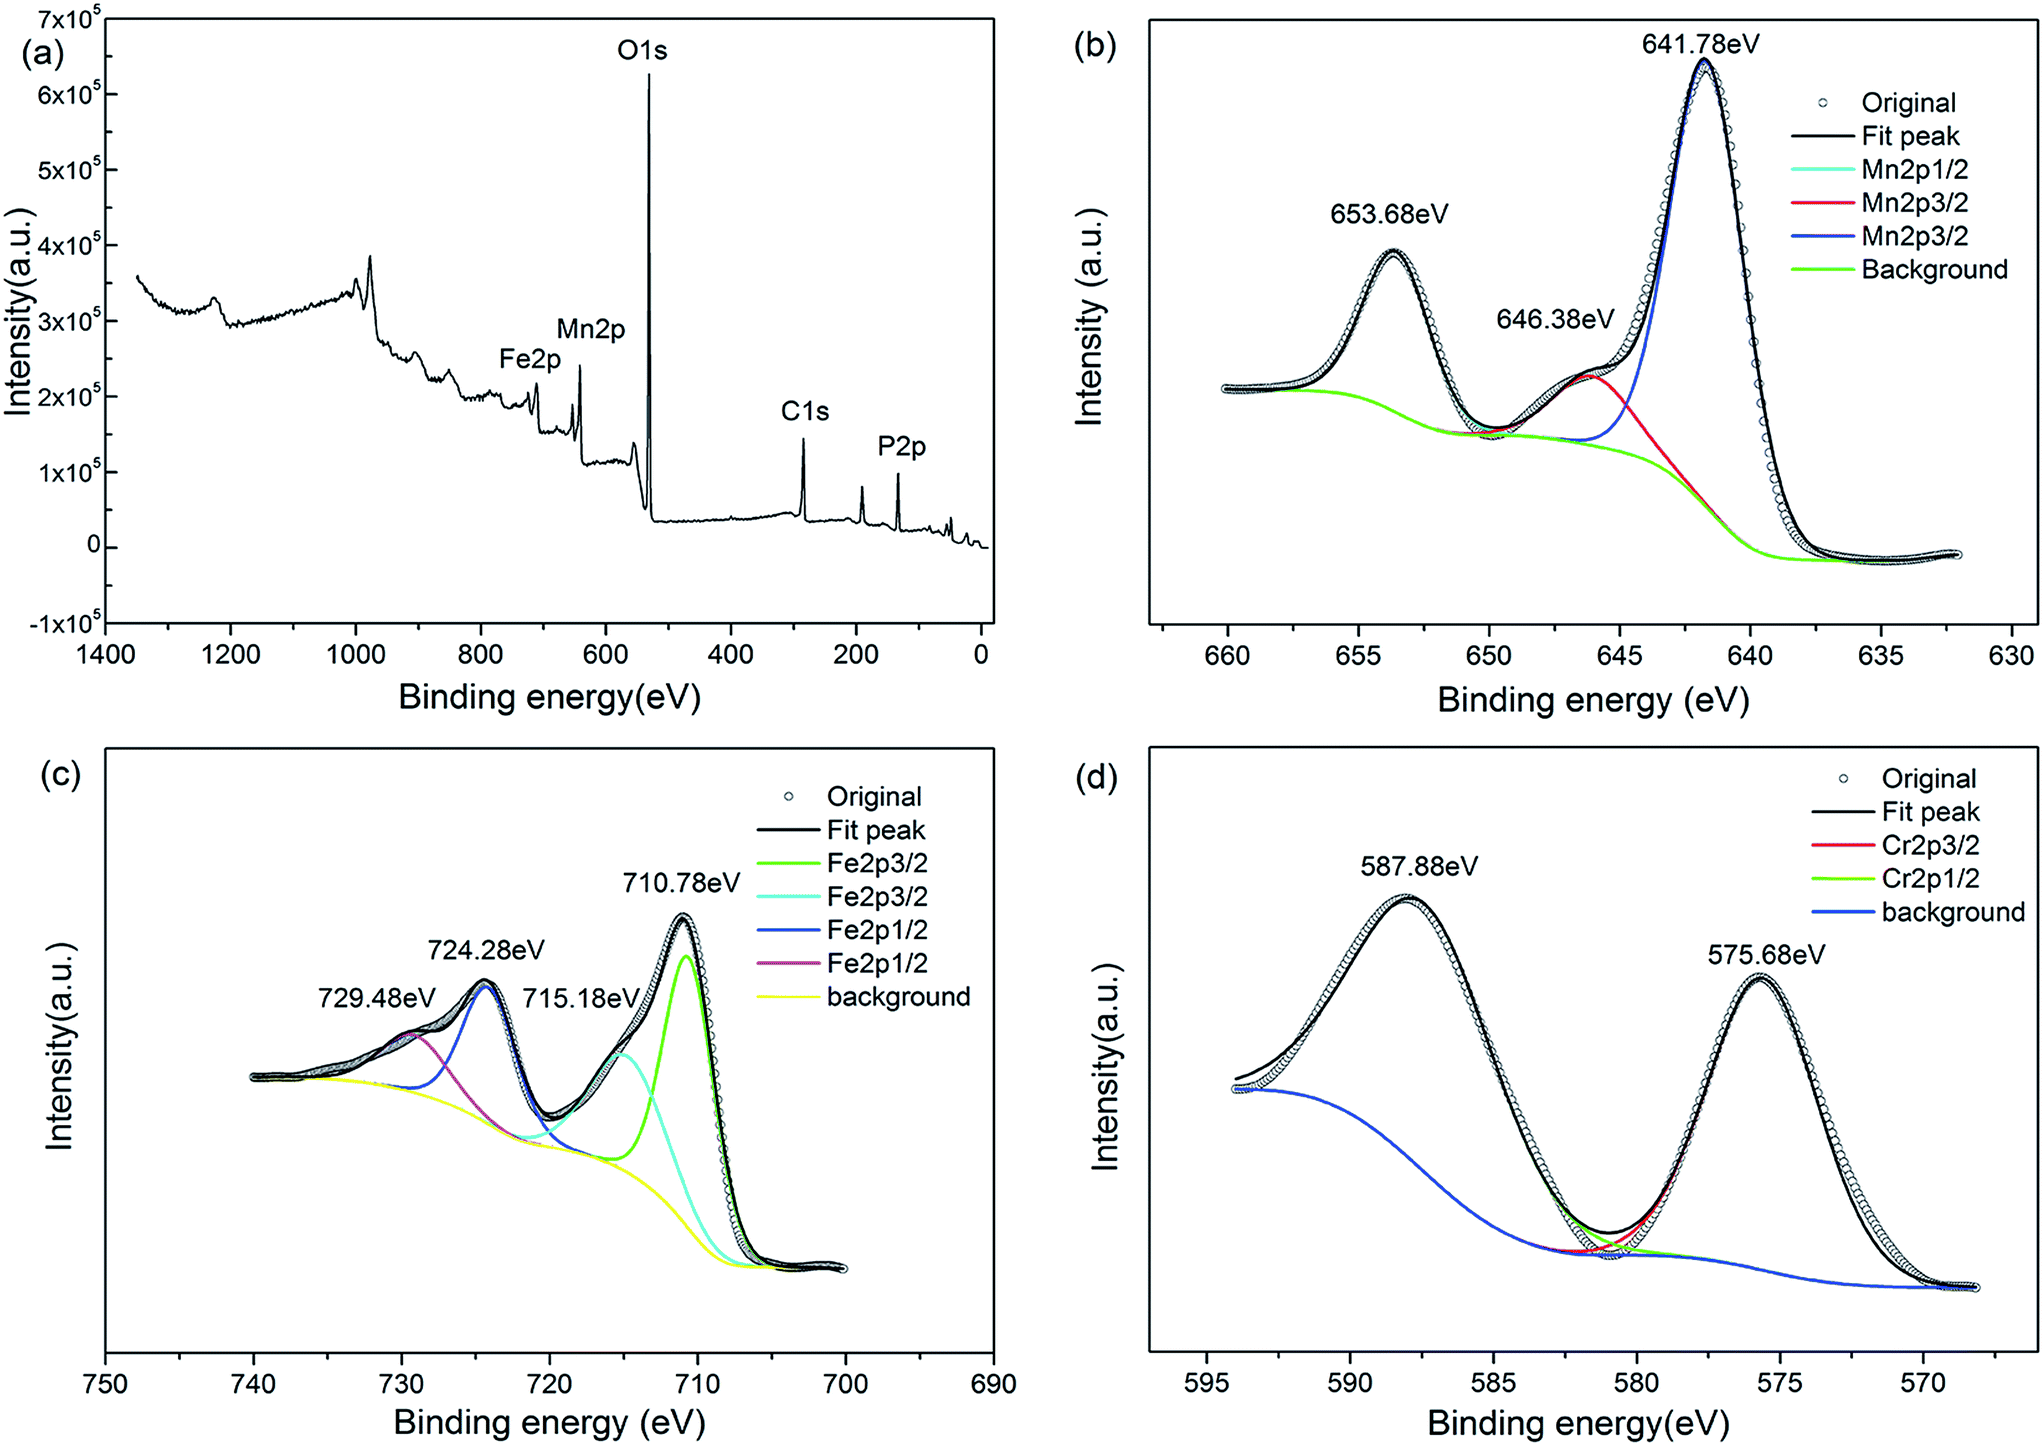 | ||
| Fig. 4 XPS spectra of LiFe0.4Mn0.595Cr0.005PO4/C: (a) whole pattern survey; (b) Mn 2p1/2 and Mn 2p3/2 peaks; (c) Fe 2p1/2 and Fe 2p3/2 peaks; (d) Cr 2p1/2 and Cr 2p3/2 peaks. | ||
Fig. 5 compares the electronic conductivities of the samples. From the figure, the electronic conductivity of four samples is 1.12 × 10⁻⁵ S cm−1 (x = 0), 2.39 × 10⁻⁵ S cm−1 (x = 0.002), 5.91 × 10⁻⁵ S cm−1 (x = 0.005), 1.2 × 10⁻⁵ S cm−1 (x = 0.01), respectively. Significant changes in electronic conductivity were observed. The results indicated that appropriate Cr-doping can effectively improve the electronic conductivity of the cathode material. Moreover, it can be seen that LiFe0.4Mn0.595Cr0.005PO4/C sample with 0.5% Cr doping has a higher electronic conductivity than other samples. That is because the energy band structures are modified when Cr ions were introduced into the crystal lattice to substitute the original Mn/Fe ions. In earlier reports,35,36 incorporating of Cr3+ ion into crystal lattice was confirmed as an effective to increase electronic conductivity of LiFePO4 or LiMnPO4 cathode material. Such promotion happened again in our case, Cr3+ doped LiFe0.4Mn0.6PO4/C solid solution. The improvement in electronic conductivity can be beneficial to the electrochemical performance. So the enhanced electrochemical performance was expectable.
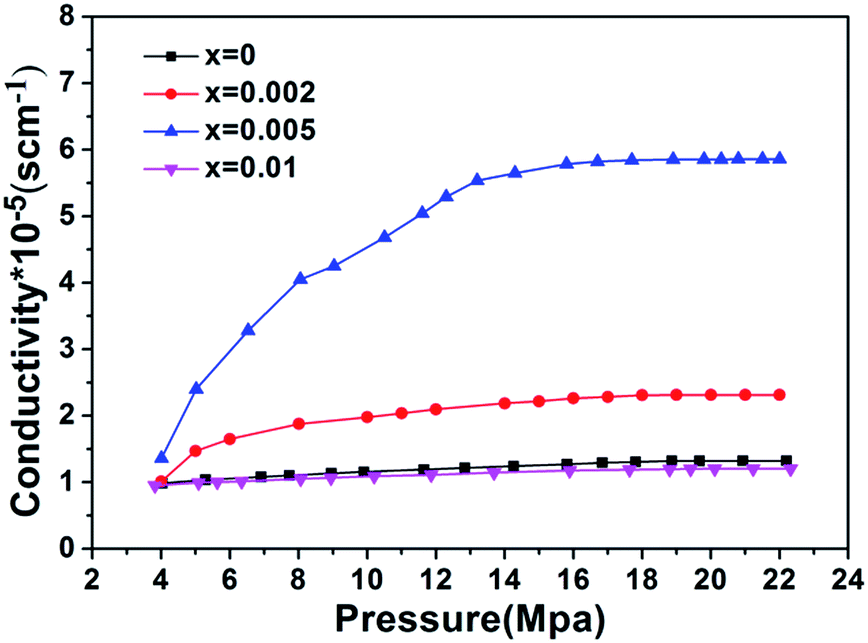 | ||
| Fig. 5 Electronic conductivities of the LiFe0.4Mn0.6−xCrxPO4/C samples. | ||
The electrochemical behaviors of the prepared samples were thereafter investigated. The cells were charged/discharged between 2.2 V and 4.5 V. Fig. 6(a) presents the first charge/discharge curves of all samples at 0.1C. The whole samples exhibited two plateaus at 4.1 V and 3.5 V separately, related to the Mn3+/Mn2+ and Fe3+/Fe2+ redox couples.30,31 The large flat plateau at 4.1 V originates from a two-phase equilibrium between fully lithiated phase LiMnPO4 and fully delithiated phase MnPO4.33 The flat plateau at 3.5 V can be ascribed to the electrochemical behavior of Fe3+/Fe2+ redox couples. It can be seen that the initial discharge capacities increase from 153.0 mA h g−1 to 163.7 mA h g−1 as the Cr content is increased to 0.5%. But the discharge capacity decreases to 146.6 mA h g−1 at a Cr content of 1%. It is important to note that the sample with 0.5% total Cr content exhibit an excellent capability. Generally, the samples with a higher electronic conductivity tend to exhibit a higher capacity. Therefore, the results are in consistence with the above electronic conductivities analysis results. In Fig. 6(b), the cycle performances of the samples were also evaluated at 0.1C. After 50 cycles, the reversible capacity is 148.7 mA h g−1, 154.8 mA h g−1, 162.3 mA h g−1, 142.2 mA h g−1, corresponding to x = 0, 0.002, 0.005, 0.01, respectively. Obviously, the 0.5% Cr doped LiFe0.4Mn0.595Cr0.005PO4/C sample shows much higher reversible capacity than other samples. Moreover, the capacity retention after 50 cycles for the sample of LiFe0.4Mn0.595Cr0.005PO4/C is 99.2%, which is also higher than that of other samples.
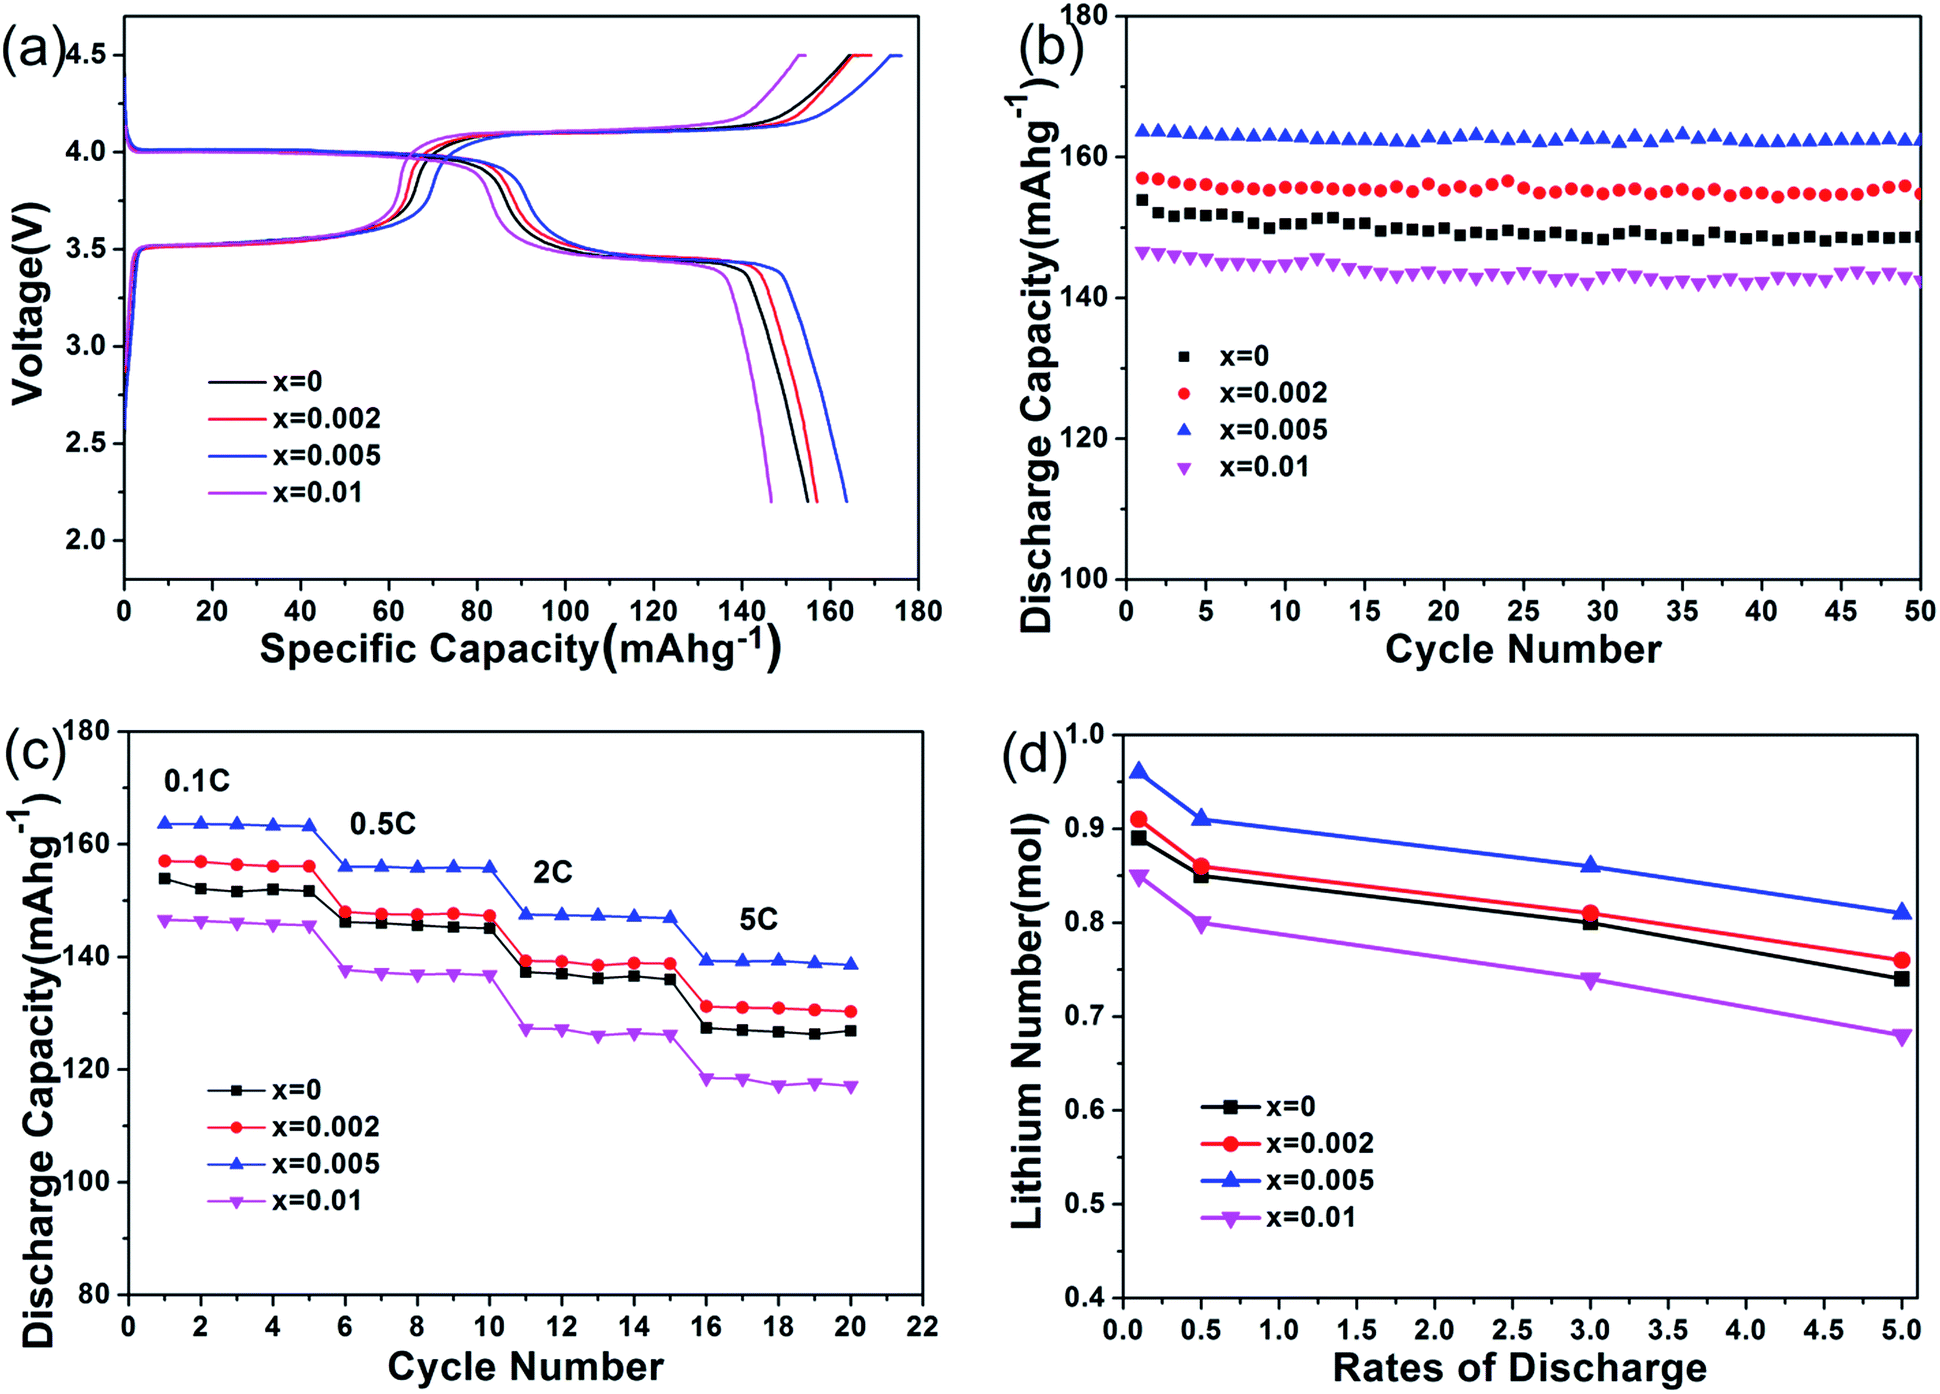 | ||
| Fig. 6 Electrochemical performances of the LiFe0.4Mn0.6−xCrxPO4/C samples: (a) the first charge/discharge curves at 0.1C; (b) cycling performance at 0.1C; (c) rate capabilities; (d) comparison of the lithium numbers of all samples at different rates. | ||
The rate performances of the samples were investigated. As shown in Fig. 6(c), the capacity difference between the samples can be clearly found. It can be seen that LiFe0.4Mn0.595Cr0.005PO4/C has an excellent rate capacity with a discharge capacity of 147.5 mA h g−1 at 2C and 139.3 mA h g−1 even at 5C. When compared with the prestine LiFe0.4Mn0.6PO4/C, increased discharge capacity of 8.89% and 9.45% were confirmed. Such results indicate that LiFe0.4Mn0.595Cr0.005PO4/C has a more excellent cycle performance and rate behavior at high rate than LiFe0.4Mn0.6PO4/C. Meanwhile, the specific capacity of LiFe0.4Mn0.595Cr0.005PO4/C is higher than our previous work in various rate.40 The reason can be explained by the fact that LiFe0.4Mn0.595Cr0.005PO4/C sample has a higher electronic conductivity and Li-ion diffusion coefficient than that prepared in our previous work. Fig. 6(d) compares the lithium numbers of the samples at different rates. The number of lithium of LiFe0.4Mn0.595Cr0.005PO4/C is the largest, which is in accordance with the rate capacity result. Therefore, in general, the electrochemical performances shown in Fig. 6 illustrated the superiority of the LiFe0.4Mn0.595Cr0.005PO4/C over other samples.
To further understand the other reason for the improved performance, electrochemical tests such as CV measurement and EIS were conducted. Fig. 7 displays the CV results of the samples in a voltage range of 2.5–4.6 V vs. Li+/Li, which shows oxidation and reduction peaks for Mn3+/Mn2+ and Fe3+/Fe2+, respectively. Both oxidation and reduction peaks for Mn3+/Mn2+ and Fe3+/Fe2+ of all the samples are sharp, which reflects good reversibility of the electrodes. And the intensities of redox peaks of Mn3+/Mn2+ and Fe3+/Fe2+ gradually increase when the Cr content is increased from 0 to 0.5%, but they decrease when the Cr content reaches up to 1%. Moreover, the potential differences between the pair of redox peaks decreased with the increasing of the Cr content (0 ≤ x ≤ 0.005), which increases with a further increase in Cr content (1% Cr3+). The potential differences between the pair of redox peaks of Mn3+/Mn2+ and Fe3+/Fe2+ are 0.47 V and 0.34 V respectively for the sample with 0% Cr3+, 0.44 V and 0.32 V for the sample with 0.2% Cr3+, 0.4 V and 0.27 V for the sample with 0.5% Cr3+, 0.56 V and 0.43 V for the sample with 1% Cr3+. Therefore, by comparison, it is clear that the sample with 0.5% Cr3+ has a smaller polarization, which is more reversible than other samples. The results confirmed the high stability of the materials towards reactivity with Li ions.
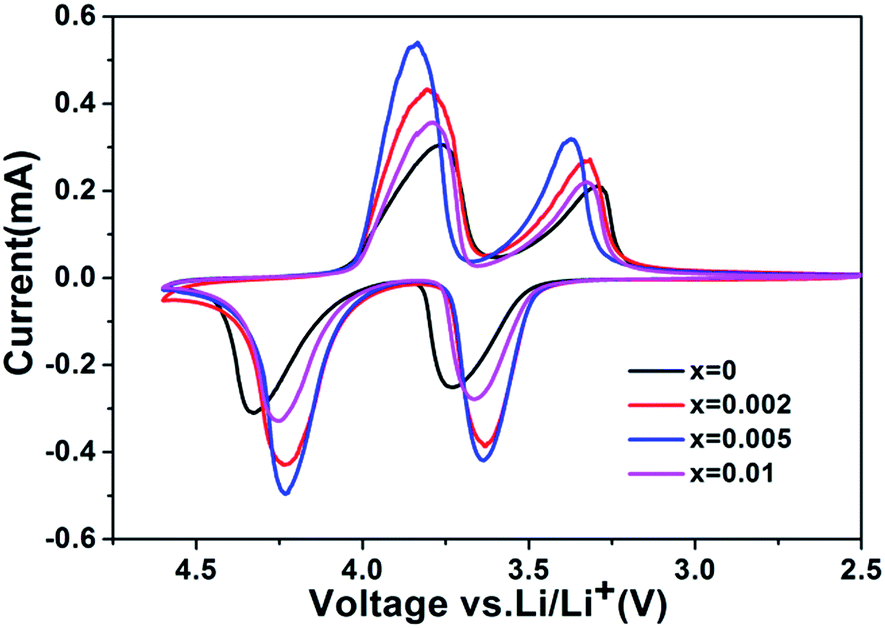 | ||
| Fig. 7 Cyclic voltammograms obtained with scan rate of 0.04 mV·s−1 for LiFe0.4Mn0.6−xCrxPO4/C samples. | ||
Electrochemical Impedance Spectroscopy (EIS) measurements were performed on the cathode electrodes to provide more information for the improved electrochemical performance, as shown in Fig. 8. The spectra of the samples have similar profiles which are composed of a semicircle in the high frequency region and an inclined line in the low frequency region. The high frequency semicircle is related to the charge transfer resistance at the active material interface, while the sloping line at the low frequency indicates the Warburg impedance caused by a semi-infinite diffusion of Li ion in the electrode. Apparently, with a smaller semicircle, LiFe0.4Mn0.595Cr0.005PO4/C electrode exhibits a smaller charge transfer resistance than other samples, which indicates an enhanced interfacial Li+ transfer with improved electrochemical kinetics of Li+ diffusion process in LiFe0.4Mn0.595Cr0.005PO4/C electrode. Such impedance spectra can be simulated with an equivalent circuit as the inset shown in Fig. 8(a), where Rs is the solution resistance; Rct is the charge transfer resistance which is related to the electric conductivity of the prepared electrodes; CPE represents the double layer capacitance and passivation film capacitance; Zw represents the Warburg impedance.41–43 After going through the simulation, all the parameters involved were obtained and listed in Table 2. By comparison, all the values for LiFe0.4Mn0.595Cr0.005PO4/C electrode were the smallest among the four samples, which indicated that both the charge transfer and Li ion exchange at the electrolyte/electrode interface were greatly enhanced.
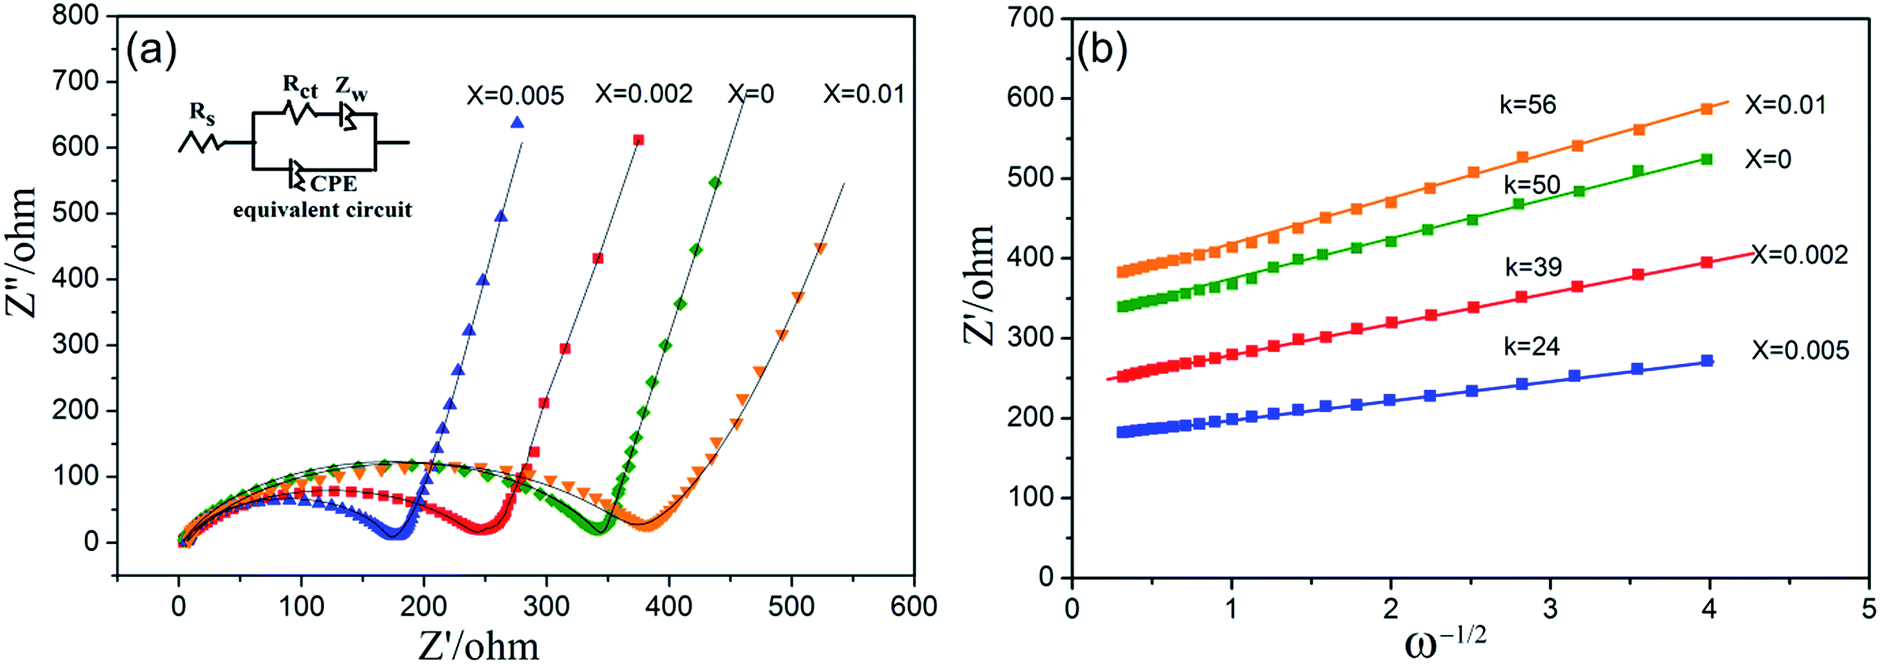 | ||
| Fig. 8 (a) EIS plots of the LiFe0.4Mn0.6−xCrxPO4/C samples in the fresh cells; (b) the linear relationship between the Warburg impedance and the inverse square root of angular frequency, the slopes of the simulated lines are the Warburg constant for the samples. | ||
| Parameters | x = 0 | x = 0.002 | x = 0.005 | x = 0.01 |
|---|---|---|---|---|
| Rs (Ω) | 3.23 | 3.02 | 2.86 | 3.58 |
| Rct (Ω) | 412 | 296 | 208 | 523 |
| CPE | 1.72 × 10⁻⁵ | 1.65 × 10⁻⁵ | 1.78 × 10⁻⁵ | 1.84 × 10⁻⁵ |
| Zw | 0.058 | 0.051 | 0.062 | 0.068 |
| Calculated DLi | 9.57 × 10⁻¹¹ | 1.63 × 10⁻¹⁰ | 4.36 × 10⁻¹⁰ | 7.79 × 10⁻¹¹ |
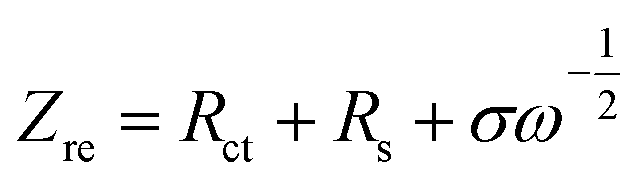
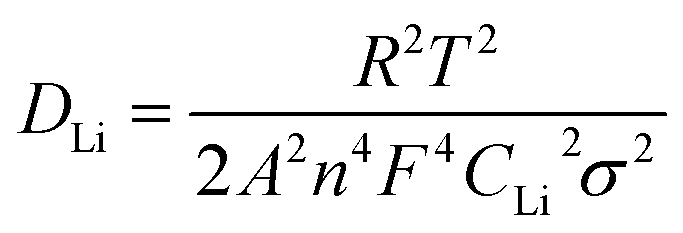
To confirm the enhanced Li ion exchange, the lithium-ion diffusion coefficients were also calculated from the impedance spectra. The straight line in the low frequency region of EIS corresponds to the lithium-ion diffusion (DLi) within the bulk of the cathode materials.44 The lithium-ion diffusion coefficient (DLi) can be calculated from the low frequency plots according to the following equations:45,46
 | (1) |
 | (2) |
According to eqn (1), when plotting Zre against ω−1/2, linear relationship should be observed. Fig. 8(b) shows the relationship between Zre and ω−1/2, from which a good linear characteristic was observed. Therefore, the σ value can be obtained from the slope of Zre versus ω−1/2. In eqn (2), R is the gas constant, A is the surface area of the cathode, T is the absolute temperature, n is the number of electrons per molecule during oxidation, F is the Faraday constant, Rs is the resistance of electrolyte, CLi is the concentration of lithium-ions in solid, ω is the angular frequency, and σ is the Warburg factor, which is used to calculate the lithium-ion diffusion coefficient. To calculate the lithium-ion diffusion coefficient, the obtained σ value was inputted into eqn (2). The lithium-ion diffusion coefficient (DLi) of the four samples were calculated as 9.57 × 10⁻¹¹ cm2 s−1, 1.63 × 10⁻¹¹ cm2 s−1, 4.36 × 10⁻¹⁰ cm2 s−1 and 7.79 × 10⁻¹¹ cm2 s−1, respectively. By comparison, it is clear that the lithium-ion diffusion coefficient of the LiFe0.4Mn0.595Cr0.005PO4/C is increased, and it is almost 4.6 times that value of the pristine solid solution. This result shows that incorporating of Cr3+ into the lattice could also effectively increase the Li ion diffusion coefficient, not only the powder conductivity. Therefore, the enhanced electrochemical performance of the LiFe0.4Mn0.595Cr0.005PO4/C cathode materials in our case can be regarded as the combined results of the two factors, the increased conductivity and improved ion diffusion.
Experimental
Synthesis of materials
LiFe0.4Mn0.6−xCrxPO4/C (x = 0, x = 0.002, x = 0.005, x = 0.01) were synthesized by a nano milling assisted solid-state method. Stoichiometric amount of iron powder was added to H3PO4 (Aldrich, 85%) solution to form a precursor of iron phosphate, which was carried out at 55 °C for several hours with continuous stirring. Then, the above precursor was mixed with stoichiometric amount of LiOH H2O (Aldrich, 99.9%) solution, sucrose solution (LiFe0.4Mn0.6−xCrxPO4: sucrose = 8![[thin space (1/6-em)]](https://www.rsc.org/images/entities/char_2009.gif) :1, weight ratio), Cr(NO3)3 (Aldrich, 99%) solution and MnCO3 (Aldrich, 98%). The atom ratios of the reacting raw materials were kept according to the formula of LiFe0.4Mn0.6−xCryPO4/C (x = 0, x = 0.002, x = 0.005, x = 0.01). After that, the mixture was grinded by ball-milling at a speed of 600–800 rpm for 3 h with ZrO2 beads with diameter of 0.5 mm and finally green slurry was generated. The slurry was subjected to spray-drying and spherical powders were obtained since the moisture evaporated quickly with the heated air flowing. Finally, the prepared spherical powders were placed into a tube furnace and heat-treated at 700 °C for 3 h with N2 flowing. The carbon contents of all the final cathode materials were kept around 2.0 wt%, as confirmed by the carbon-sulfur analysis.
:1, weight ratio), Cr(NO3)3 (Aldrich, 99%) solution and MnCO3 (Aldrich, 98%). The atom ratios of the reacting raw materials were kept according to the formula of LiFe0.4Mn0.6−xCryPO4/C (x = 0, x = 0.002, x = 0.005, x = 0.01). After that, the mixture was grinded by ball-milling at a speed of 600–800 rpm for 3 h with ZrO2 beads with diameter of 0.5 mm and finally green slurry was generated. The slurry was subjected to spray-drying and spherical powders were obtained since the moisture evaporated quickly with the heated air flowing. Finally, the prepared spherical powders were placed into a tube furnace and heat-treated at 700 °C for 3 h with N2 flowing. The carbon contents of all the final cathode materials were kept around 2.0 wt%, as confirmed by the carbon-sulfur analysis.
Characterization
The crystal structures of all samples were characterized through X-ray powder diffraction (TD3500, Dandong) using Cu Kα radiation (V = 40 kV, I = 40 mA) at a scanning rate of 0.02° per second in the 2θ range 10–70°. The morphologies of the samples were investigated by a scanning electronic microscopy (SEM, JEOL, JSM-6700F). Analysis of the elemental distribution of the particles was performed using a SEM based energy-dispersive X-ray spectrometer (EDS). The carbon content of samples was determined by a carbon–sulfur analyzer (HIR-944B). The electronic conductivities of the cylindrical pellets with a diameter of 10 mm of the samples were measured at room temperature using a powder resistivity tester (FT-300/301) under a pressure range 2–25 MPa and a resistivity range 10−4 to 2 × 10⁵ Ω cm. The X-ray photoelectron spectroscopy (XPS, Kratos Axis Ultra DLD) with Al Kα radiation was employed to measure the valence state of metal element.Electrochemical measurements
The electrochemical performances of the samples were evaluated using CR2016 coin-type cells. The cathode electrodes were prepared by mixing 80 wt% active material, 10 wt% acetylene black as conductive material, and 10 wt% polyvinylidene fluoride (PVDF) binder in N-methyl-2-pyrrolidone (NMP) solvent. Then, the slurry was uniformly cast onto an aluminum foil current collector using a doctor blade, and dried for 4 h at 70 °C. After that, the aluminum foil with active material was punched into 12 mm-diameter disks and dried in a vacuum oven at 120 °C for about 12 h. The electrolyte was 1 M LiPF6 in an ethylene carbonate/dimethyl carbonate (EC/DMC 1:1 in volume) solution. Lithium metal served as the working anode. Celgard 2502 membrane was the separator. CR2016 coin cells were assembled in an argon-filled glove box (Master 100 Lab, Braun, Germany). The fabricated cells were tested in a voltage range of 2.2–4.5 V at different current rates on a battery testing system (LAND CT2001A, Wuhan, China). The cyclic voltammetric (CV) measurement was carried out on an electrochemical workstation (CHI660D, CH Instrument) at a scan rate of 0.04 mV s−1 in a voltage of 2.5–4.6 V. Electrochemical Impedance Spectroscopy (EIS) was measured on the electrochemical workstation (Autolab Pgstat302n) over a frequency range of 100 KHz to 0.05 Hz at a discharge state. All the measurements were conducted at room temperature.
Conclusions
We have synthesized nanostructure LiFe0.4Mn0.6−xCrxPO4/C (0 ≤ x ≤ 0.01) with uniform size via a simple nano-milling assisted solid-state method and thoroughly characterized the structure, morphology, elemental distribution, electronic conductivity and electrochemical performance. XRD analysis demonstrated an olivine structure for the prepared samples. SEM-EDS analysis revealed a homogeneous distribution of all the elements in the samples and the carbon is also homogenously coated on the surface of the sample particles. The electrochemical tests showed that the electrochemical performance of the pristine cathode material can be greatly improved by certain amount of Cr3+ doping. The discharge capacity, cycle behaviour and rate capability of LiFe0.4Mn0.6−xCrxPO4/C were very attracting for future application, and the sample with 0.5 atm% Cr doping showed excellent electrochemical performance by presenting a high discharge capacity of 163.7 mA h g−1 at 0.1C and maintained a specific capacity of 139 mA h g−1 even at 5C. Moreover, the cathode showed better cycle performance, with 99.2% capacity retention after 50 cycles. Such excellent electrochemical behaviours of LiFe0.4Mn0.595Cr0.005PO4/C can be attributed to the increase in not only the powder electronic conductivity, but also the Li ion diffusion coefficient, as confirmed by the conductivity measurement and EIS simulation. Powder conductivity tests revealed that conductivity of the powder sample with 0.5% Cr doping presents the highest conductivity of 5.91 × 10⁻⁵ S cm−1, which is almost 5.3 times that of the pristine sample. Calculations of diffusion coefficient using the EIS data also suggested a highest Li ion diffusion coefficient of 4.36 × 10⁻¹⁰ cm2 s−1 for the sample with 0.5% Cr doping, which is almost 4.6 times that of the pristine sample. The synthesized LiFe0.4Mn0.595Cr0.005PO4/C with such excellent electrochemical performance showed great potential for the application in high-power devices.Acknowledgements
The authors are grateful for the financial support with contract number 14520503100, 15ZZ095, 13PJ1407400, 21306113 and 201310-JD-B2-009.References
- A. K. Padhi, K. S. Nanjundaswamy and J. B. Goodenough, J. Electrochem. Soc., 1997, 144, 1188 CrossRef CAS
.
- I. C. Jang, H. H. Lim, S. B. Lee, K. Karthikeyan, V. Aravindan, K. S. Kang, W. S. Yoon, W. I. Cho and Y. S. Lee, J. Alloys Compd., 2010, 497, 321 CrossRef CAS
- H. Shu, M. Chen, Y. Fu, X. Yang, X. Yi, Y. Bai, Q. Liang, Q. Wei, B. Hu, J. Tan, C. Wu, M. Zhou and X. Wang, J. Power Sources, 2014, 252, 73–78 CrossRef CAS
- H. Shu, X. Wang, Q. Wu, B. Hu, X. Yang, Q. Wei, Q. Liang, Y. Bai, M. Zhou, C. Wu, M. Chen, A. Wang and L. Jiang, J. Power Sources, 2013, 237, 149–155 CrossRef CAS
- H. Shu, X. Wang, W. Wen, Q. Liang, X. Yang, Q. Wei, B. Hu, L. Liu, X. Liu, Y. Song, M. Zho, Y. Bai, L. Jiang, M. Chen, S. Yang, J. Tan, Y. Liao and H. Jiang, Electrochim. Acta, 2013, 89, 479–487 CrossRef CAS
- T. Drezen, N. H. Kwon, P. Bowen, I. Teerlinck, M. Isono and I. Exnar, J. Power Sources, 2007, 174, 949 CrossRef CAS
- V. Aravindan, J. Gnanaraj, Y. S. Lee and S. Madhavi, J. Mater. Chem. A, 2013, 1, 3518 CAS
- M. K. Devaraju and I. Honma, Adv. Energy Mater., 2012, 2, 284 CrossRef CAS
- A. Yamada, M. Hosoya, S. C. Chung, Y. Kudo, K. Hinokuma, K. Y. Liu and Y. Nishi, J. Power Sources, 2003, 119–121, 232 CrossRef CAS
- S. L Shang, Y. Wang, Z. G. Mei, X. D. Hui and Z. K. Liu, J. Mater. Chem., 2012, 22, 1142 RSC
- S. P. Ong, V. L. Chevrier and G. Ceder, Phys. Rev. B: Condens. Matter Mater. Phys., 2011, 83, 075112 CrossRef
- C. Delacourt, L. Laffont, R. Bouchet, C. Wurm, J. B. Leriche, M. Morcrette, J. M. Tarascon and C. Masquelier, J. Electrochem. Soc., 2005, 152, A913 CrossRef CAS
- J. Zong and X. J. Liu, Electrochim. Acta, 2014, 116, 9 CrossRef CAS
- X. Fu, Z. Chang, K. Chang, B. Li and H. Tang, Electrochim. Acta, 2015, 178, 420 CrossRef CAS
- K. Zhu, W. Zhang, J. Du, X. Liu, J. Tian, H. Ma, S. Liu and Z. Shan, J. Power Sources, 2015, 300, 139 CrossRef CAS
- F. Wen, H. Shu, Y. Zhang, J. Wan, W. Huang, X. Yang, R. Yu, L. Liu and X. Wang, Electrochim. Acta, 2016, 214, 85–93 CrossRef CAS
- Y. Hong, Z. Tang and Z. Zhang, Electrochim. Acta, 2015, 176, 369 CrossRef CAS
- Z. Zhang, G. Hu, Y. Cao, J. Duan, K. Du and Z. Peng, Solid State Ionics, 2015, 283, 115 CrossRef CAS
- Z. Xie, K. Chang, B. Li, H. Tang, X. Fu, Z. Chang, X. Z. Yuan and H. Wang, Electrochim. Acta, 2016, 189, 205 CrossRef CAS
- J. M. Oh, O. Geiculescu, D. DesMarteau and S. Creager, J. Electrochem. Soc., 2011, 158, A207 CrossRef CAS
- K. Zaghib, M. Trudeau, A. Guerfi, J. Trottier, A. Mauger, R. Veillette and C. M. Julien, J. Power Sources, 2012, 204, 177 CrossRef CAS
- H. Fang, H. Yi, C. Hu, B. Yang, Y. Yao, W. Ma and Y. Dai, Electrochim. Acta, 2012, 71, 266 CrossRef CAS
- H. Yi, C. Hu, X. He and H. Xu, Ionics, 2015, 21, 667 CrossRef CAS
- C. Sronsri, P. Noisong and C. Danvirutai, Spectrochim. Acta, Part A, 2016, 153, 436 CrossRef CAS PubMed
- Y. Zhang, Y. Zhao and L. Deng, Ionics, 2012, 18, 573 CrossRef CAS
- Z. Tan, P. Gao, F. Cheng, H. Luo, J. Chen, H. Zhou and S. Tan, Funct. Mater. Lett., 2011, 04, 299 CrossRef CAS
- H. Wang, Y. Yang, Y. Liang, L. F. Cui, H. S. Casalongue, Y. Li, G. Hong, Y. Cui and H. Dai, Angew. Chem., Int. Ed., 2011, 50, 7364 CrossRef CAS PubMed
- S. M. Oh, H. G. Jung, C. S. Yoon, S. T. Myung, Z. Chen, K. Amine and Y. K. Sun, J. Power Sources, 2011, 196, 6924 CrossRef CAS
- L. Damen, F. De Giorgio, S. Monaco, F. Veronesi and M. Mastragostino, J. Power Sources, 2012, 218, 250 CrossRef CAS
- Y. J. Zhong, J. T. Li, Z. G. Wu, X. D. Guo, B. H. Zhong and S. G. Sun, J. Power Sources, 2013, 234, 217 CrossRef CAS
- J. Zong, Q. Peng, J. Yu and X. Liu, J. Power Sources, 2013, 228, 214 CrossRef CAS
- M. B. Sahana, S. Vasu, N. Sasikala, S. Anandan, H. Sepehri-Amin, C. Sudakar and R. Gopalan, RSC Adv., 2014, 4, 64429 RSC
- A. Yamada, Y. Kudo and K. Y. Liu, J. Electrochem. Soc., 2001, 148, A1153 CrossRef CAS
- J. Hong, F. Wang, X. Wang and J. Graetz, J. Power Sources, 2011, 196, 3659 CrossRef CAS
- S. Li, Z. Su, A. Muslim, X. Jiang and X. Wang, Ceram. Int., 2015, 41, 11132 CrossRef CAS
- S. Shi, L. Liu, C. Ouyang, D. Wang, Z. Wang, L. Chen and X. Huang, Phys. Rev. B: Condens. Matter Mater. Phys., 2003, 68, 195108 CrossRef
- L. Wu, S. Zhong, J. Lu, J. Liu and F. Lv, Ionics, 2013, 19, 1061 CrossRef CAS
- H. C. Shin, S. B. Park, H. Jang, K. Y. Chung, W. I. Cho, C. S. Kim and B. W. Cho, Electrochim. Acta, 2008, 53, 7946 CrossRef CAS
- Y. Gan, C. Chen, J. Liu, P. Bian, H. Hao and A. Yu, J. Alloys Compd., 2015, 620, 350 CrossRef CAS
- Y. Cai, D. Zhang, C. Chang, Z. Sheng and K. Huang, Ionics, 2016, 22, 1011 CrossRef CAS
- A. Y. Shenouda and H. K. Liu, J. Power Sources, 2008, 185, 1386 CrossRef CAS
- A. Y. Shenouda and K. R. Murali, J. Power Sources, 2008, 176, 332 CrossRef CAS
- B. Li, C. Han, Y. B. He, C. Yang, H. Du, Q. H. Yang and F. Kang, Energy Environ. Sci., 2012, 5, 9595 CAS
- Y. R. Zhu, L. C. Yin, T. F. Yi, H. P. Liu, Y. Xie and R. S. Zhu, J. Alloys Compd., 2013, 547, 107 CrossRef CAS
- M.-J. Lee, M. Noh, M.-H. Park, M. Jo, H. Kim, H. Nam and J. Cho, J. Mater. Chem. A, 2015, 3, 13453 CAS
- J. Li, Q. T. Qu, L. F. Zhang, L. Zhang and H. H. Zheng, J. Alloys Compd., 2013, 579, 377 CrossRef CAS
| This journal is © The Royal Society of Chemistry 2017 |