 Open Access Article
The structure, electrical properties and chemical stability of porous Nb-doped SrTiO3 – experimental and theoretical studies†
Ewa Drożdż * and
Andrzej Koleżyński
AGH University of Science and Technology, Faculty of Materials Science and Ceramics, al. A. Mickiewicza 30, 30-059 Kraków, Poland. E-mail: edrozdz@agh.edu.pl; Fax: +48 12 617 52 36; Tel: +48 12 617 25 37
First published on 1st June 2017
Abstract
A series of porous SrTi1−xNbxO3 samples (with x = 0, 1, 2 and 3 mol%) were prepared by wet synthesis and sintered at 1573 K. Single phase samples were obtained for each composition, as confirmed by XRD measurements. For all samples, aging tests in CO2/H2O atmosphere and electrochemical impedance spectroscopy measurements in air and hydrogen (reduced) atmosphere were carried out. Simultaneously, for model superstructures corresponding to 2 and 3 mol% experimental compositions, FP-LAPW DFT calculations of electronic structure and bonding properties (using QTAiM approach) were performed. Both experimental and theoretical results show an increase of cell parameters with increasing niobium amount. The influence of the amount of niobium on the microstructure of the synthesized samples as well as on their chemical stability was also observed. Electrical properties measurements showed different conduction mechanism for synthetic air and reduced atmosphere, i.e. mixed ionic-electron conduction and dominating electron conduction, respectively.
Introduction
SrTiO3 is one of the best known and most widely used perovskite materials with interesting properties primarily resulting from structure doping with aliovalent additives. Nowadays, the studies devoted to its potential use, among others, as materials for energy conversion (therein mixed ionic-electronic conductors1–3 and thermoelectric materials4,5) are becoming increasingly important from applicational viewpoint. The modification of various properties of SrTiO3 material can be achieved by its carefully designed doping in one (or simultaneously both) cationic sublattices with various admixtures. A lot of papers have been devoted to studies on defects and electrical properties of bulk Nb–SrTiO3 materials (inter alia6–8) but they concerned dense materials consisting of grains with at least micrometer sizes. Only a few papers [e.g.9,10] put stress on the microstructure (grain size and porosity) in the context of these properties. Abrantes et al.9 observed, during evaluation of response time of Nb-doped materials in different atmospheres, that the transient response of very porous samples with 5 mol% Nb after suddenly changing from reducing to oxidizing conditions are much shorter than in the case of bulk ones. Thus dense materials react slowly to changes in the atmosphere, while in the porous materials respective changes are much faster (the diffusion time inside individual grains becomes even around six order of magnitude smaller). This information is valuable from applicational viewpoint – in the case of the solid–gas reactions, the porous microstructure provides large surface for the possible reaction. This makes porous Nb-doped SrTiO3 very interesting materials from the viewpoint of its possible use as composite component for SOFC anodes or oxide membranes in gas sensors (e.g. it is well known that in the case of SOFC materials the most important factor is the amount/effective area of TPB – Triple Phase Boundaries, directly related to porosity level which is required to be higher than 30 vol% and grain size which has to be nanosized).The drawback of expanded surface materials is, however, an increase of the yield of competitive, disturbing reactions. One of the fundamental property of this type of perovskite materials is their pure stability in atmosphere containing carbon dioxide and water vapor.11–13 This factor is especially important for materials that would potentially work in hydrocarbon environment due to a possibility of oxidation of organic carbon to carbon dioxide. Compared to ceranes, titanates, they exhibit higher chemical stability (in CO2 and H2O atmosphere) and, what is more, strontium titanate is one of the most stable representatives of this perovskite group. To our best knowledge, the effect of aliovalent dopant introduction to titanium sub-lattice on chemical stability of SrTiO3 in the presence of CO2/H2O has not been studied so far. On the other hand, the only study on introduction of donor dopant to strontium sub-lattice showed that substituting strontium with yttrium does not lower the chemical stability of strontium titanate.14 Analogous studies on donor doping influence on chemical stability were conducted with respect to other perovskite systems (cobaltite,15 ferrite16) and their results indicate that the niobium dopant in B sublattice stabilizes such systems. The authors of these works took into consideration thermodynamical aspect of niobium addition based on average metal–oxygen bond energy (ABE). The idea of such calculations (ABE) was originally proposed by Voorhoeve et al.17 to estimate the binding energy of oxygen with metal ions in perovskite oxides.
There are also many theoretical studies reported in literature (based on both, DFT and HF calculations), devoted to various properties of niobium doped SrTiO3 materials. One can find theoretical papers analyzing structural, electrical and catalytic properties of doped and undoped perovskite structures, including Nb-doped strontium titanate.18–21 Based on various computational methods, insulator to metal transition, the position of Nb dopants (Ti, Sr or interstitial initial sites) within Nb-doped SrTiO3 structure, partial ionic charges and unit cell size dependence on dopant as well as doping mechanism and properties and formation energies of substitutional or vacancy defects and dependence of electrical and optical properties on point defects has been studied.22–28
Most of theoretical papers devoted to electrical properties of Nb-doped SrTiO3 contain detailed analysis of electronic structure properties (DOS and bandstructure).22,23,29 However, these papers were concerned with some heavy doping models (high niobium concentrations), most probably due to prohibitive requirements for computer power in the case of big supercell calculations, necessary to model (low dopant concentration) and only recently, the calculations of electronic structure and optical properties for smaller niobium concentration (0.74–2.5 at% of niobium, corresponding to approx. 4–14 at% of titanium atoms substituted by niobium) has been reported.28 Moreover, these works report some opposite findings, like e.g. opposite tendency of partial, charge transfer due to titanium substitution with niobium, towards oxygen or niobium22,23 (HF or DFT ones).
Although Delugas et al.29 stated that high-Nb doping concentration in SrTiO3 are experimentally achievable and apparently keen to reach of high electron mobility, in practice, niobium concentration in titanium perovskite structures is limited to few per cents, due to interference with other phases being synthesized simultaneously, resulting in synthesis of multiphase, inhomogeneous materials.6,30,31 Therefore much more realistic are the simulations of the systems with much lesser amount of doping agent. In this work, the results of WIEN2k FP-LAPW DFT calculations of electronic structure and topological properties of electron density, carried out for Nb doped SrTiO3 model structures (for 0.42 at% and 0.56 at% of niobium, corresponding to approx. 2 mol% and 3 mol% of Ti substituted by Nb) and used in analysis of experimental results are presented.
Experimental
Synthesis
Porous undoped and Nb-doped SrTiO3 materials were obtained by wet synthesis – sol–gel method. Ti(O–iPr)4—titanium(IV) isopropoxide and niobium ethoxide were applied as precursors of titanium and niobium respectively. These two reagents were dissolved in anhydrous methanol and next cations were complexed by addition of citric acid. Then the aqueous solution of strontium nitrate (the concentration was confirmed by gravimetric analysis) was introduced into methanol solution containing titanium and niobium cations. The obtained sol was heated on magnetic stirrer at around 453 K until its densification (transition to a gel). After the calcination (1173 K) the pallets under pressure 5 × 10⁵ Pa were formed and next sintered at 1573 K for 8 hours.All reagents used for the synthesis were analytically pure (provided by Aldrich or Avantor Company).
A series of samples SrTi1−xNbxO3 where x = 0, 1, 2, 3 mol% were obtained and characterized.
Methods
Phase composition and unit cell parameters were determined based on XRD measurements carried out on Philips X'Pert Pro diffractometer with monochromatized Cu-Kα radiation for diffraction angles 2θ, within the range from 20 to 100. Using Rietveld phase analysis, the amounts of observed phases and crystallographic parameters were determined quantitatively. The crystallite sizes were estimated from the X-ray line broadening of the selected peaks, using Scherrer's approach.The observation of pallets fracture morphology was performed using scanning electron microscopy (SEM) (Nova NanoSEM 200 FEI and Oxford Instruments) coupled with X-ray energy dispersive spectroscopy (EDAX company apparatus). The pallets porosity was measured using Archimedes method and specific surface by BET method.
The electrical properties of obtained samples were examined by means of impedance spectroscopy (Solartron, FRA 1260 with dielectric interface 1294). Before measurements, platinum paste was applied on the pallets (sintered at 1573 K, 10 mm in diameter and a thickness of 2.5 mm) and fired. The measurements were performed in temperature range of 573–973 K in synthetic air and mixture of 10% H2 in Ar. The frequency range was 0.1 Hz–1 MHz and the amplitude of the sinusoidal voltage was 10 mV. Before the actual test the samples were initially annealed at hydrogen/argon atmosphere for 24 h (heated to 1023 K, kept at this temperature for an hour and then cooled to room temperature). Moreover, samples were equilibrated for 30 min at the specific temperature before actual EIS measurement.
In order to determine the chemical stability in CO2 and H2O atmosphere, the undoped and Nb-doped SrTiO3 pallets were exposed to carbon dioxide and water vapour-containing atmosphere (7% CO2 and 100% HR) for 700 h at room temperature. In order to check the stability of samples (original and subjected to aging procedure), thermogravimetric measurements (on SDT 2960 TA Instruments apparatus) coupled with mass spectroscopy (QMD 300 ThermoStar Balzers mass spectrometer) were used. All samples weighing around 50 mg were placed in SDT apparatus in platinum crucible and heated in synthetic air atmosphere with 10 deg min−1 heating rate.
Computational details
Ab initio calculations were carried out using Full Potential Augmented Plan Wave Method (FP-LAPW) within Density Functional Theory formalism, as implemented in Wien2k package.32 The calculations were carried out for three model structures: undoped SrTiO3 and Nb-doped SrTiO3 (with Nb/Ti ratio of 1/47 and 1/35), using 3 × 3 × 3, 3 × 4 × 4 and 3 × 3 × 4 supercells, respectively, with single Ti atom substituted by niobium (the latter two correspond to nominal Nb content of 2 mol% and 3 mol%, respectively, comparable with the experimental ones). The calculations for 1 mol% Nb content were not carried out due to a very prohibitive time and memory requirements posed on supercomputer system by respective model supercell structure (4 × 5 × 5 supercell with 500 atoms and Nb/Ti ratio 1/99, where for even smaller RKmax parameter set to 5, single SCF cycle took many hours, while to obtain relaxed structure one needs to run many single point energy SCF calculations consisting of many cycles). Geometry optimization was performed by multi-step process (alternate equilibrium cell size determination for given atomic positions and atomic positions relaxation for fixed equilibrium unit cell size from previous step, until no further changes were observed) with following parameters: PBESol exchange correlation potential,33 muffin-tin radii RMT [a.u.]: 2.33 for strontium and 1.73 for titanium and niobium, RKmax = 6.0, Gmax = 14, k-mesh: 6 × 6 × 6, 5 × 5 × 6 and 6 × 6 × 5, for SrTiO3, SrTi0.98Nb0.02O3 and SrTi0.97Nb0.03O3, respectively and the convergence criteria for SCF calculations set to ΔESCF ≤ 10−5 Ry for total energy and ΔρSCF ≤ 10−5 e for electron density topology analysis. For all relaxed structures, the electronic structure (density of states and band structures) have been calculated and effective masses determined and Bader's QTAiM topological analysis34 of total electron density carried out (using Critic2 (ref. 35) program).Results & discussions
Structure and microstructure properties
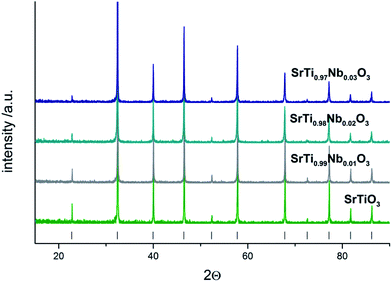
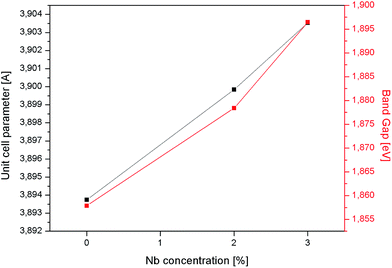
The analysis of diffractograms obtained for SrTi1−xNbxO3 pallets sintered at 1573 K showed, in the case of all synthesized materials, the presence of cubic (space group Pm3m) SrTiO3 phase only (Fig. 1).Based on the comparison of ionic radii in 6-fold coordination (as is for B-cation in perovskite structure) for Ti(IV) and Nb(V), 74.5 pm and 78 pm, respectively, one can expect a slight increase of unit cell parameter with niobium substitution for titanium. The structural data determined using Rietveld method as well as theoretical calculations (details in next paragraph) confirmed the expected changes of cell parameters (Fig. 2). Furthermore, based on X-ray diffraction, using Scherrer equation, the crystallite sizes were calculated. As one can observe, there is a close relation between amount of introduced admixture and crystallite sizes (Fig. 2). With the addition of niobium, the mean crystallite size decreases and in the case of 3 mol% Nb-doped system reaches approx. half of the value assessed for the undoped material. The similar effect of grain size decrease with increasing amount of niobium introduced to SrTiO3 structure was reported for dense samples sintered at 1800 K with much bigger grains.36 The SEM microphotographs of pallets fractures obtained for our samples show porous materials with irregular pore structure (Fig. 3). The total porosities determined on the basis of geometric measurements and samples' weights were equal to 22 ± 3 vol%, BET surface area around 2.0 ± 0.4 m2 g−1 and no dependency on the amount of niobium introduced was observed. The presence of niobium in the series of Nb-doped SrTiO3 were confirmed by EDS microanalysis.
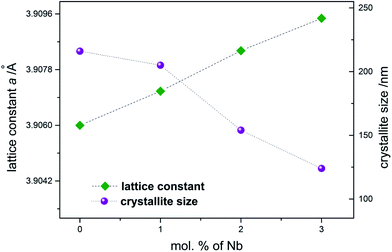 | ||
| Fig. 2 Unit cell parameter and crystallite size as a function of the amount of niobium substituting titanium in SrTiO3 samples. | ||
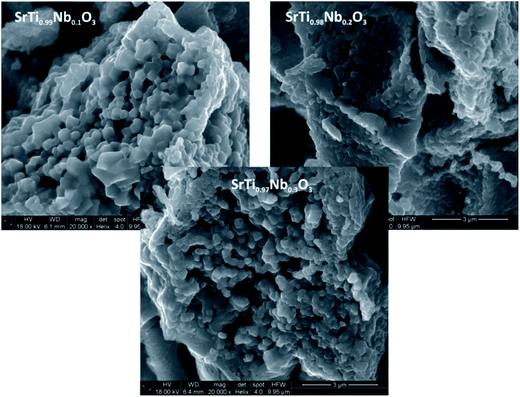 | ||
| Fig. 3 SEM microphotographs of fractures of Nb-doped SrTiO3 pallets (1, 2 and 3 mol% of Nb). All microphotographs were prepared at the same magnification (20 000×). | ||
FP-LAPW DFT calculations
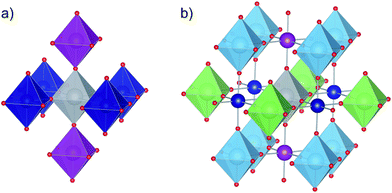
![[3 with combining macron]](https://www.rsc.org/images/entities/char_0033_0304.gif) m, space group no. 221), 4 × 4 × 3 (P4/mmm, sg no. 123) and 3 × 3 × 4 (P4/m, sg. 83) supercells, respectively. In the latter two structures one titanium atom was substituted by niobium, which corresponds to 2.13 mol% and 2.86 mol% of titanium atoms substituted (0.42 at% and 0.56 at% wrt total number of atoms), respectively. The obtained results show (Fig. 4) that the unit cell size increases with increasing amount of niobium which is in agreement with the experimental results (Fig. 2). This is a direct result of local structure modification in niobium proximity: while niobium ions are only slightly bigger than titanium ones (78 vs. 74.5 pm), Nb–O bonds are visibly bigger than Ti–O bonds (∼1.965 Å vs. ∼1.95 Å, Table 2.) and so are their octahedra. Moreover, since niobium and titanium polyhedra are corner-shared, the increased length of Nb–O bonds leads to a shrinkage of respective Ti–O bonds and titanium polyhedra deformation. In the case of perovskite materials in order to determine the extent of polyhedral deformation one can use the so called polyhedra deformation indicators:37–39 distortion index D, quadratic elongation <λ>, bond angle variance σ2 and effective coordination number ECoN (detailed description can be found in ESI†). The results of structural analysis based on the above descriptors are presented in Table 1 (only first two coordination spheres are shown, since 3rd coordination sphere with 8 titanium atoms has approx. 6.75 Å and 6.77 Å radius for 2 mol% and 3 mol% Nb-doped SrTiO3, respectively, which is more than a half of the nearest distance between two niobium atoms in these structure, equal to 11.68 Å and 11.71 Å respectively). When we look closer at the detailed information about the properties of titanium octahedra in 1st and 2nd coordination sphere of niobium polyhedron (depicted on Fig. 5), we can observe that in both doped structures, 6 titanium polyhedra in 1st coordination sphere are visibly more distorted (octahedron elongation, bond length distortion, bond angle variance) than 12 belonging to 2nd coordination sphere, for which this distortion is almost negligible.
m, space group no. 221), 4 × 4 × 3 (P4/mmm, sg no. 123) and 3 × 3 × 4 (P4/m, sg. 83) supercells, respectively. In the latter two structures one titanium atom was substituted by niobium, which corresponds to 2.13 mol% and 2.86 mol% of titanium atoms substituted (0.42 at% and 0.56 at% wrt total number of atoms), respectively. The obtained results show (Fig. 4) that the unit cell size increases with increasing amount of niobium which is in agreement with the experimental results (Fig. 2). This is a direct result of local structure modification in niobium proximity: while niobium ions are only slightly bigger than titanium ones (78 vs. 74.5 pm), Nb–O bonds are visibly bigger than Ti–O bonds (∼1.965 Å vs. ∼1.95 Å, Table 2.) and so are their octahedra. Moreover, since niobium and titanium polyhedra are corner-shared, the increased length of Nb–O bonds leads to a shrinkage of respective Ti–O bonds and titanium polyhedra deformation. In the case of perovskite materials in order to determine the extent of polyhedral deformation one can use the so called polyhedra deformation indicators:37–39 distortion index D, quadratic elongation <λ>, bond angle variance σ2 and effective coordination number ECoN (detailed description can be found in ESI†). The results of structural analysis based on the above descriptors are presented in Table 1 (only first two coordination spheres are shown, since 3rd coordination sphere with 8 titanium atoms has approx. 6.75 Å and 6.77 Å radius for 2 mol% and 3 mol% Nb-doped SrTiO3, respectively, which is more than a half of the nearest distance between two niobium atoms in these structure, equal to 11.68 Å and 11.71 Å respectively). When we look closer at the detailed information about the properties of titanium octahedra in 1st and 2nd coordination sphere of niobium polyhedron (depicted on Fig. 5), we can observe that in both doped structures, 6 titanium polyhedra in 1st coordination sphere are visibly more distorted (octahedron elongation, bond length distortion, bond angle variance) than 12 belonging to 2nd coordination sphere, for which this distortion is almost negligible.
| SrTi0.98Nb0.02O3 | Nb–Ti distance [Å] | Nb–Nb distance: 11.67856 Å | ||||||
|---|---|---|---|---|---|---|---|---|
| Coord. sphere | No. of Ti atoms | TiO6 octahedron | ||||||
| Average bond length [Å] | Volume [Å3] | Distortion index D (bond length) | Quadratic elongation <λ> | Bond angle variance σ2 [deg2] | Eff. coord. number | |||
| 1 | 2 | 3.9263 | 1.9415 | 9.7541 | 0.0049 | 1.0003 | 0.8207 | 5.9878 |
| 4 | 3.9387 | 1.9431 | 9.7751 | 0.0066 | 1.0005 | 1.5605 | 5.9747 | |
| 2 | 8 | 5.5066 | 1.9474 | 9.8470 | 0.0010 | 1 | 0.0212 | 5.9997 |
| 4 | 5.5076 | 1.9472 | 9.8436 | 0.0013 | 1 | 0.0251 | 5.9995 | |
| SrTi0.97Nb0.03O3 | Nb–Ti distance [Å] | Nb–Nb distance: 11.71069 Å | ||||||
|---|---|---|---|---|---|---|---|---|
| Coord. sphere | No. of Ti atoms | TiO6 octahedron | ||||||
| Average bond length [Å] | Volume [Å3] | Distortion index D (bond length) | Quadratic elongation <λ> | Bond angle variance σ2 [deg2] | Eff. coord. number | |||
| 1 | 4 | 3.9334 | 1.9480 | 9.8543 | 0.0045 | 1.0002 | 0.6124 | 5.9896 |
| 2 | 3.9457 | 1.9493 | 9.8711 | 0.0061 | 1.0004 | 1.1804 | 5.9777 | |
| 2 | 4 | 5.5220 | 1.9530 | 9.9326 | 0.0008 | 1 | 0.0063 | 5.9998 |
| 8 | 5.5231 | 1.9528 | 9.9284 | 0.0012 | 1 | 0.0133 | 5.9996 | |
| mol% of Nb | R [Å] | ρ(rBCP) [a.u.] | ∇2ρ(rBCP) [a.u.] | ||||||
|---|---|---|---|---|---|---|---|---|---|
| Sr–O | Nb–O | Ti–O | Sr–O | Nb–O | Ti–O | Sr–O | Nb–O | Ti–O | |
| 0 | 2.750 | — | 1.947 | 0.0215 | — | 0.1088 | 0.0871 | — | 0.3895 |
| 2 | 2.753 | 1.964 | 1.946 | 0.0216 | 0.1378 | 0.1114 | 0.0864 | 0.3016 | 0.2458 |
| 3 | 2.760 | 1.965 | 1.951 | 0.0227 | 0.1286 | 0.1100 | 0.0876 | 0.2709 | 0.2462 |
Electronic structure
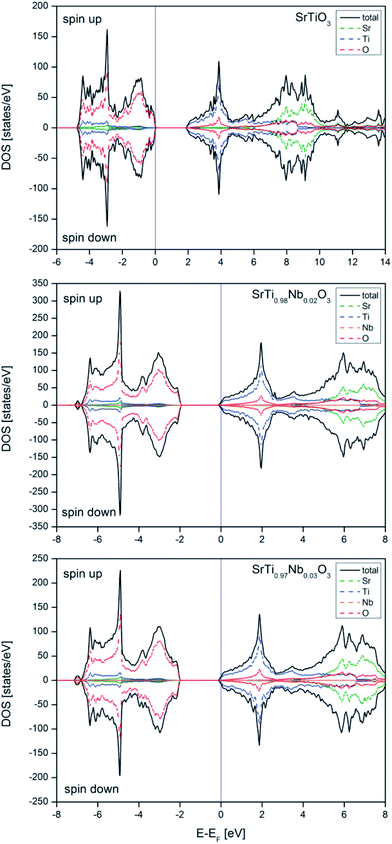
 for higher doped structure (this is in very good agreement with experimental results presented in next paragraph for conductivity measurements carried out in synthetic air atmosphere – Fig. 7).
Electrical properties
 ,
,  and
and  ) in undoped SrTiO3 obtained during synthesis in air atmosphere, this material is known as acceptor-doped system. The hole carriers at lower temperatures (below 550 K according to42) are created as a consequence of ionization of strontium vacancies:
 | (1) |
 | (2) |
Further increase of temperature leads to an equilibrium shift to the left and to change of conduction mechanism as a result of ionic conductivity appearance.
The substitution of niobium in titanium site results in incorporation of additional electrons:
 | (3) |
 and (b)
  ); create small polarons localized at titanium site. The latter effect (with additional, possible introduction of oxygen to the structure) are most probable under oxidizing atmosphere.
Simultaneously with niobium, a larger amount of oxygen (in comparison with undoped SrTiO3 structure) is introduced to the structure. As a consequence the strontium and/or titanium vacancies can be created. According to43 the formation energy for titanium vacancies is higher than for strontium ones, so the latter are more energetically favorable and the process occurring in air atmosphere can be described by the following equation:
 | (4) |
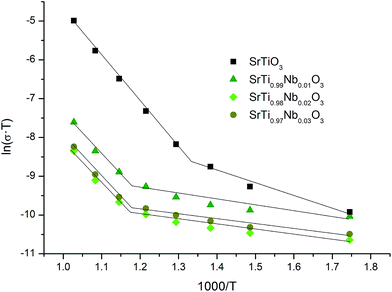
These equations and results of impedance spectroscopy measurements were used to explain the changes in the nature of conductivity in oxidizing (air) atmosphere in undoped and Nb-doped SrTiO3 samples. The analysis of total conductivity (σ) was performed based on Bode plots (not included in this paper) but it should be noted that on Nyquist plots only one circle (in impedance system) can be observed for all series of SrT1−xNbxO3 (similar results for undoped and yttrium-doped porous SrTiO3 were reported by us44 and for undoped nanocrystalline SrTiO3 by Gregori et al.45). The presence of this type of circles (corresponding to resistor and constant phase element) suggests the participation of ionic conductivity in total conductivity of these samples and therefore, respective activation energies were determined based on temperature dependence of total conductivity in Arrhenius plot ln(σT) versus 1/T (Fig. 7). One can observe that conductivity of undoped SrTiO3 is much higher than conductivity of Nb-doped strontium titanate and this difference increases with temperature. The conductivities of SrTi0.98Nb0.02O3 and SrTi0.97Nb0.03O3 samples are almost the same and simultaneously half an order of magnitude lower then conductivity of SrTi0.99Nb0.01O3.
Additionally, for all samples, one can observe two temperature regions (the first – lower and the second – higher, with good linear fit) differing considerably in a slope, which indicates the change in dominating conduction mechanism (electronic to ionic from low to high temperature regions). It is, however, worth to note, that while analogous two temperature regions with different dominating conductivity mechanism were also observed in porous yttrium doped SrTiO3 samples,44 in the latter case, for high temperature region with dominating ionic conductivity, the addition of admixture resulted in an increase of activation energy, whilst in niobium system this energy decreases. This can be attributed, to a large extent, to structural changes: in Y-doped SrTiO3 the unit cell size decreases while in Nb-doped material increases with the amount of admixture. Since yttrium ionic radius is significantly smaller than strontium one (93 vs. 112 pm), which corresponds to slightly higher effective nuclear charge, yttrium ions attract oxygen ions stronger than strontium ones and therefore respective bond lengths are smaller causing slight deformation and (mainly) spatial reorientation of TiO6 octahedra in a proximity of yttrium admixture. In result, the average interatomic distances decrease and potential barriers related to oxygen diffusion through the structure becomes higher and thus higher activation energies are necessary for the oxygen diffusion. On the other hand, as mentioned earlier, niobium ions are slightly bigger than substituted titanium ones and make bigger octahedra at the expense of corner-shared TiO6 octahedra (resulting in their distortion), which leads to overall structure expansion, giving more room for oxygen ions to diffuse and thus lowering respective activation energy.
 | (5) |
After donor doping with niobium, extra electrons are being introduced to the structure (eqn (3)) and electrons originating from both processes can be either delocalized, occupying conduction band states, localized at oxygen vacancies:
 | (6) |
 | (7) |
In order to determine the effect of strontium substitution with niobium on conductivity of modified materials in an atmosphere that corresponds to working conditions characteristic for SOFC anodes, the impedance spectroscopy measurements in a mixture of 10% H2/Ar were carried out. The obtained EIS spectra were analyzed based on Bode plots and total electrical conductivities calculated. The dependence of total conductivity (σ) on temperature inverse (in Arrhenius coordinates) is presented in Fig. 8. It can be observed that for all samples, conductivity increases with temperature and conductivities of doped strontium titanate are much larger than in undoped SrTiO3. Moreover, conductivity of doped material is the highest for 1 mol% Nb samples and is an order of magnitude higher than for 2 and 3 mol% samples (for both being very similar), which, in turn, is also an order of magnitude higher than in undoped strontium titanate. The observed increase of total conductivity for niobium doped SrTiO3 samples in reducing atmosphere in comparison with respective values for undoped compound can be attributed to extra electrons coming from niobium, acting as donor dopant (eqn (2)). The drop of conductivity for 2 and 3 mol% samples with respect to 1 mol% sample can be attributed to electron concentration decrease due to the partial localization of electrons coming from oxygen vacancies formation process on niobium cation, which lead to reduction of Nb5+ to Nb3+. This can be confirmed by change of samples color from almost white (light cream) before to blue (blue-grey) after reduction process.
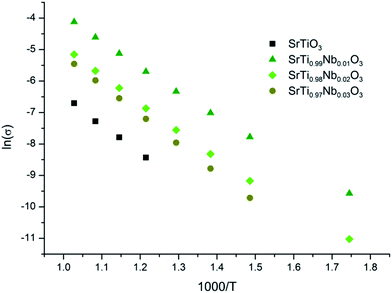 | ||
| Fig. 8 Temperature dependence of the total conductivity of samples measured in 10% H2/Ar atmosphere. | ||
It is well known that the conductivity of perovskite materials depends strongly (even a few orders of magnitude) on porosity and the amount of grain boundaries (and thus on grain sizes)9,46 and therefore our results showing values of total conductivities measured of porous nanocrystalline Nb doped SrTiO3 samples smaller than respective ones obtained for dense microcrystalline samples, are as expected.
Taken together, the observed character of conductivity changes (an increase with temperature), impedance spectra properties (no semicircles in tested frequency range) and theoretical calculations confirm predominant electronic character of conductivity in Nb-doped SrTiO3 for low oxygen partial pressure, so based on ln(σ) vs. 1/T dependence (Fig. 8) respective conductivity activation energies were determined and are presented in Table 3.
| Atmosphere/temperature range | Ea [eV] | ||||
|---|---|---|---|---|---|
| SrTiO3 | SrTi0.99Nb0.01O3 | SrTi0.98Nb0.02O3 | SrTi0.97Nb0.03O3 | ||
| Air synt. | Low temp. | 0.27 ± 0.05 | 0.12 ± 0.03 | 0.10 ± 0.02 | 0.11 ± 0.02 |
| High temp. | 1.03 ± 0.02 | 0.94 ± 0.11 | 0.96 ± 0.12 | 0.95 ± 0.09 | |
| 10% H2/Ar all range | 0.79 ± 0.01 | 0.66 ± 0.01 | 0.71 ± 0.02 | 0.78 ± 0.01 | |
The results indicate that unlike in synthetic air atmosphere, when reducing atmosphere is used, niobium introduction to SrTiO3 structure leads to a drop of conductivity activation energy, which is smallest for SrTi0.99Nb0.01O3 samples and increases back with the increasing amount of niobium added, becoming for SrTi0.97Nb0.03O3 almost identical as for undoped samples.
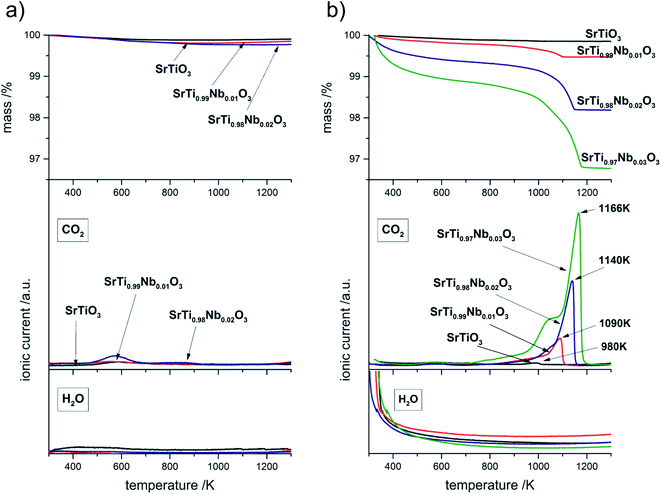 | ||
| Fig. 9 TG curves and ionic current lines (m/z = 18 and m/z = 44) for decomposition of SrTiO3 and SrTi1−xNbxO3 before (a) and after (b) exposition tests. | ||
Table 4 shows a comparison of CO2 moles (determined by weight loss on TG curves) resulting from thermal decomposition above 700 K per 1 g of sample with the amount of niobium moles present in 1 g of SrTi1−xNbxO3. One can observe that ratio of Nb moles to CO2 moles systematically decreases, therefore the amount of incorporated Nb indirectly affects the amount of SrCO3 formed. Moreover, thermal decomposition of strontium carbonate begins with destruction of carbonate covering the surface of the nanometric crystallites (Fig. 2) so that the reaction at the surface begins already at about 700 K. The proper effect (running through the whole volume of the resulting grains) begins in undoped sample at 953 K and for the doped samples moves to higher temperatures with increasing amounts of formed carbonate. The shift of the end of the decomposition process towards higher temperatures with the increasing amount of carbonate in the samples (and at the same time with amount of incorporated niobium) is easily noticeable on both, TG and CO2 ionic currents curves. Described effect is the result of inhibition of the reaction due to CO2 evolving which at the same time in such porous, nanostructured material becomes the primary constituent of the atmosphere in which this reaction occurs. Thus the reaction equilibria: SrCO3 = CO2 + SrO is shifted slightly to the left – the more carbonate is present in the material, the higher partial pressure of CO2. For better visualization of this shift on Fig. 9b, the temperature of maxima on CO2 ionic current are appropriately labeled. The most important conclusion that can be drawn from thermal analysis of samples before and post-aging treatment is that niobium introduction to SrTiO3 structure causes decrease of chemical stability of resulting compound.
| Sample | Mass change per 1 g of sample [g] | The number of CO2 moles produced per 1 g of sample [g] | The number of Nb moles per 1 g of sample [g] | Ratio of Nb moles to CO2 moles |
|---|---|---|---|---|
| SrTi0.99Nb0.01O3 | 1.20 × 10⁻³ | 2.73 × 10⁻⁵ | 5.44 × 10⁻⁵ | 1.99 |
| SrTi0.98Nb0.02O3 | 2.59 × 10⁻³ | 5.87 × 10⁻⁵ | 1.09 × 10⁻⁴ | 1.85 |
| SrTi0.97Nb0.03O3 | 5.22 × 10⁻³ | 1.19 × 10⁻⁴ | 1.62 × 10⁻⁴ | 1.37 |
The experimental results of chemical stability are in opposition to predictions based on earlier cited works.15,16 Therefore, average metal oxygen bond energy (ABE) were estimated according to the following equation:17
Conclusions
Wet synthesis – sol–gel method allowed to obtained porous, nanocrystalline, single phase SrTi1−xNbxO3 (x = 0.0, 0.01, 0.02, 0.03) materials with all nominal amount of niobium incorporated to structure. The introduction of niobium admixture results in an increase of unit cell volume and simultaneously decrease of average crystallite size (with increasing amount of niobium). The observed changes in structural parameters are in very good agreement with theoretical calculations. QTAiM topological analysis of electron density show that all bonds have significant ionic character, Ti–O and Nb–O bonds are much stronger than Sr–O and small unit cell size expansion with increasing amount of niobium results mostly from deformation of titanium octahedra in niobium proximity in order to relax the structure with longer Nb–O bonds, while TiO6 octahedra lying further from niobium sites remain practically intact.The results of aging tests carried out in CO2/H2O atmosphere for several weeks showed a worsening of chemical stability with increasing amount of niobium dopant. This can be a result of effective Sr–O bonds weakening in the structure due to titanium octahedral deformation in niobium cations proximity and oxygen vacancies introduction in order to neutralize additional negative charge due to Nb donor doping. To our knowledge, no such tests for this type of the system were carried out earlier.
The electronic structure calculations show that niobium introduction into titanium sublattice has donor character and results in a shift of Fermi level to conduction band (n-type conductor) and small change in band gap size, increasing with niobium amount. The calculated effective electron masses increase with dopant amount, which suggests a lowering of the electric conductivity (in agreement with experimental results obtained for air atmosphere). In reducing atmosphere the total conductivity increases with the amount of admixture, which is a result of additional carriers introduced with oxygen vacancies. To absolute values of the total conductivity measured in reducing atmosphere are significantly lower than reported for other Nb-doped SrTiO3 materials, but this is simply due to completely different microstructure of those materials (highly dense, microcrystalline materials).
Acknowledgements
This work was financially supported by the National Science Center of the Republic of Poland, Grant No. 2014/14/E/ST5/00763. FP-LAPW calculations were supported in part by PL-GRID infrastructure.References
- S. Suthirakun, G. Xiao, S. C. Ammal, F. Chen, H.-C. Loye and A. Heyden, J. Power Sources, 2014, 245, 1 CrossRef.
- J. B. Goodenough and Y.-H. Huang, J. Power Sources, 2007, 173, 1 CrossRef CAS.
- A. Kulkarni, F. T. Ciacchi, S. Giddey, C. Munnings, S. P. S. Badwal, J. A. Kimpton and D. Fini, Int. J. Hydrogen Energy, 2012, 37, 19092 CrossRef CAS.
- N. Wang, H. Chen, H. He, W. Norimatsu, M. Kusunoki and K. Kumoto, Sci. Rep., 2013, 3, 3449 CrossRef PubMed.
- A. V. Kovalevsky, M. H. Aguirre, S. Populoh, S. G. Patricio, N. M. Ferreira, S. M. Mikhalev, D. P. Fagg, A. Weidenkaffh and J. R. Fradea, J. Mater. Chem. A, 2017, 5, 3909 CAS.
- P. Blennow, A. Hagen, K. K. Hansen, L. R. Wallenberg and M. Mogensen, Solid State Ionics, 2008, 179, 2047 CrossRef CAS.
- B. Bochentyn, J. Karczewski, T. Miruszewski, A. Krupa, M. Gazda, P. Jasinski and B. Kusz, Solid State Ionics, 2012, 225, 118 CrossRef CAS.
- T. Kolodiazhnyi and A. Petric, J. Electroceram., 2005, 15, 5 CrossRef CAS.
- J. C. C. Abrantes, J. A. Labrincha and J. R. Frade, Sens. Actuators, B, 1999, 56, 198 CrossRef CAS.
- J. Karczewski, B. Riegel, M. Gazda, P. Jasinski and B. Kusz, J. Electroceram., 2010, 24, 326 CrossRef CAS.
- G. Sukhdeep, R. Kannan, N. Maffei and V. Thangadurai, RSC Adv., 2013, 3, 3599 RSC.
- P. Pasierb, E. Drożdż-Cieśla, R. Gajerski, S. Łabuś, S. Komornicki and M. Rękas, J. Therm. Anal. Calorim., 2009, 96, 475 CrossRef CAS.
- A. Lacz, Ionics, 2016, 22, 1405 CrossRef CAS.
- E. Drożdż, Ł. Łańcucki and A. Łącz, J. Therm. Anal. Calorim., 2016, 125, 1225 CrossRef.
- F. Wang, T. Nakamura, K. Yashiro, J. Mizusaki and K. Amezawa, Solid State Ionics, 2014, 262, 719 CrossRef CAS.
- L. Gui, Y. Wan, R. Wang, Z. Wang, B. He and L. Zhao, J. Alloys Compd., 2015, 644, 788 CrossRef CAS.
- R. J. H. Voorhoeve, J. P. Remeika and L. E. Trimble, The Catalytic Chemistry of Nitrogen Oxides, ed. R. L. Klimish and J. G. Larson, Plenum Publishing Cooperation, New York, 1971, p.145 Search PubMed.
- J. D. R. Tilley, Perovskites Structure-Properties Relationships, John Wiley & Sons, United Kingdom, 2015 Search PubMed.
- R. I. Eglitis, Int. J. Mod. Phys. B, 2014, 28, 1430009 CrossRef.
- S. Piskunov, E. Heifets, R. I. Eglitis and G. Borstel, Comput. Mater. Sci., 2004, 29, 165 CrossRef CAS.
- R. I. Eglitis, S. Piskunov, E. Heifets, E. Kotomin and G. Borstel, Ceram. Int., 2004, 30, 1989 CrossRef CAS.
- R. I. Eglitis and E. Kotomin, Phys. B, 2010, 405, 3164 CrossRef CAS.
- A. Hamid, Appl. Phys. A: Mater. Sci. Process., 2009, 97, 829 CrossRef CAS.
- C. Zhang, C. L. Wang, J. C. Li, K. Yang, Y. F. Zhang and Q. Z. Wu, Mater. Chem. Phys., 2008, 107, 215 CrossRef CAS.
- R. K. Astala and P. D. Bristowe, Modell. Simul. Mater. Sci. Eng., 2004, 12, 79 CrossRef CAS.
- M. Djermouni, A. Zaoui, S. Kacimi and B. Bouhafs, Comput. Mater. Sci., 2010, 49, 904 CrossRef CAS.
- K. Ozdogan, M. Upadhyay Kahaly, S. R. Sarath Kumar, H. N. Alshareef and U. Schwingenschlogl, J. Appl. Phys., 2012, 111, 054313 CrossRef.
- J. Shujuan, Y. Jinliang, S. Guipeng and Z. Yinnü, J. Semicond., 2016, 37, 072001 CrossRef.
- P. Delugas, A. Filippetti, M. J. Verstraete, I. Pallecchi, D. Marr and V. Fiorentini, Phys. Rev. B: Condens. Matter Mater. Phys., 2013, 88, 1 Search PubMed.
- B. R. Sudireddy, P. Blennow and K. Nielsen, Solid State Ionics, 2012, 216, 44 CrossRef CAS.
- P. Blennow, K. K. Hansen, L. R. Wallenberg and M. Mogensen, J. Eur. Ceram. Soc., 2007, 27, 3609 CrossRef CAS.
- P. Blaha, K. Schwarz, G. Madsen, D. Kvasnicka, and J. Luitz, WIEN2k, An Augmented Plane Wave + Local Orbitals Program for Calculating Crystal Properties, ed. K. Schwarz, Techn. Universität Wien, Wien, Austria, 2001 Search PubMed.
- J. P. Perdew, A. Ruzsinszky, G. I. Csonka, O. A. Vydrov, G. E. Scuseria, L. A. Constantin, X. Zhou and K. Burke, Phys. Rev. Lett., 2008, 100, 136406 CrossRef PubMed.
- R. F. W. Bader, Atoms in Molecules: A Quantum Theory, Clarendon Press, Oxford, 1990 Search PubMed.
- A. Otero-de-la-Roza, E. R. Johnson and V. Luaña, Comput. Phys. Commun., 2014, 185, 1007 CrossRef CAS.
- N. Wang, M. Cao, Z. He, Ch. Diao, Q. Zhang, Y. Zhang, J. Dai, F. Zeng, H. Hao, Z. Yao and H. Liu, Ceram. Int., 2016, 42, 13593 CrossRef CAS.
- W. H. Baur, Acta Crystallogr., Sect. B: Struct. Sci., 1974, 30, 1195 CrossRef CAS.
- K. Robinson, G. V. Gibbs and P. H. Ribbe, Science, 1971, 172, 567 CAS.
- R. Hoppe, Z. Kristallogr., 1979, 150, 23 CrossRef CAS.
- M. Marques, L. K. Teles, V. Anjos, L. M. R. Scolfaro, J. R. Leite, V. N. Freire, G. A. Farias and E. F. da Silva Jr, Appl. Phys. Lett., 2003, 82, 3074 CrossRef CAS.
- W. Wunderlich, H. Ohta and K. Koumoto, Phys. B, 2009, 404, 2202 CrossRef CAS.
- R. A. de Souza, Adv. Funct. Mater., 2015, 25, 6326 CrossRef CAS.
- A. A. Crawford and P. Jacobs, J. Solid State Chem., 1999, 144, 423 CrossRef.
- E. Drożdż, A. Łącz, A. Koleżyński, A. Mikuła and K. Mars, Solid State Ionics, 2017, 302, 173 CrossRef.
- G. Gregori, S. Heinze, P. Lupetin, H.-U. Habermeier and J. Maier, J. Mater. Sci., 2013, 48, 2790 CrossRef CAS.
- F. Horikiri, L. Q. Han, A. Kaimai, T. Otake, K. Yashiro, T. Kawada and J. Mizusaki, Solid State Ionics, 2006, 177, 2555 CrossRef CAS.
- R. Dinescu and M. Preda, J. Therm. Anal., 1971, 5, 465 CrossRef.
- R. A. Robie, B. S. Hemingway and J. R. Fisher, Thermodynamic Properties of Minerals and Related Substances at 298.15 K and 1 Bar (105 Pascals) Pressure and at Higher Temperatures, U.S. Geological Survey Bulletin, 1979, vol. 1452 Search PubMed.
Footnote |
| † Electronic supplementary information (ESI) available. See DOI: 10.1039/c7ra04205a |
| This journal is © The Royal Society of Chemistry 2017 |

