 Open Access Article
Specific identification of human transferrin conformations using a cyanine dye supramolecular assembly†
Xiufeng Zhang *a,
Ling Lanab,
Shu Yangc,
Yulan Ruia,
Qian Lid,
Hongbo Chenbd,
Xin Suna,
Qianfan Yang
 *e and
Yalin Tang
 *d
*d
aCollege of Chemical Engineering, North China University of Science and Technology, Tangshan, 063210, P. R. China. E-mail: xfzhang@iccas.ac.cn; zhangxf@ncst.edu.cn; Tel: +86-315-8805460
bGraduate University of Chinese Academy of Sciences, Beijing 100080, P. R. China
cWest China School of Pharmacy, Sichuan University, Chengdu, 610064, P. R. China
dBeijing National Laboratory for Molecular Sciences, State Key Laboratory for Structural Chemistry of Unstable and Stable Species, Institute of Chemistry Chinese Academy of Sciences, Beijing, 100190, P. R. China. E-mail: tangyl@iccas.ac.cn
eCollege of Chemistry, Sichuan University, Chengdu, 610065, P. R. China. E-mail: yangqf@scu.edu.cn
First published on 20th September 2017
Abstract
A new method to recognize human transferrin (Tf) conformations was developed using a cyanine dye supramolecular assembly. We achieved detection of the open conformation of Tf (apo-Tf) in a sub-micromolar level against the closed one (holo-Tf). As a protein conformational probe, it's promising to monitor the transition between the two conformations of Tf.
The function of proteins is based on their particular tertiary structure and their conformational transition, in return, the microstates will reflect the external conditions of proteins. Therefore, it is necessary to observe the protein conformations through a more direct and simple way. Human transferrin (Tf) is an iron-binding blood plasma single-chain glycoprotein (∼80 kDa), consisting of two specific high affinity Fe3+ binding sites. It plays a major role in binding and delivering iron into cells with the specific transferrin receptor (TfR) via a receptor-mediated endocytosis process.1 Under physiological conditions, Tf has two states: non-iron-bound transferrin termed as apo-transferrin (apo-Tf) and an iron-bound state termed as holo-transferrin (holo-Tf). X-ray crystal structures of transferrin family members reveal that Tf has three different states. The apo-Tf is in the “open conformation”2 while, upon binding two Fe3+ ions, the protein adopts a structure what is designated as the “closed conformation” of holo-Tf,3 and human serum Tf (hTf) saturated with 30% Fe3+ exhibits a mixed state of open, closed and partially open conformations.4 The conformations of Tf are crucial for its biological function. It is closely related to TfR recognition. The ligand–receptor interaction between Tf/TfR leads to iron up-take by internalization of transferrin.5 Some new kinds of functionalized materials were also developed recently by utilizing the Tf conformational exchanges.6
Although identifying and monitoring the Tf conformation is of importance in broad researching area, so far, the characterization methods of Tf conformation are limited. X-ray crystallography4,7 and NMR, both of which require large quantities of sample materials, are known to provide accurate structural information. But the former informs only one static conformational state under the proper crystallization conditions while the latter is complicated to big protein data interpretation.
Fluorescence8 and circular dichroism (CD) spectroscopies8c,9 are also common investigating methods. But the spectral signals in UV band are nonspecific and easily influenced by endogenous noise. And in the case of CD spectroscopy, its detection sensitivity may not meet the demands. Here, we provide a simple and effective detecting method for the analysis of Tf conformation in solution systems.
Cyanine dye as a kind of excellent probe is used widely in bio-macromolecular recognizing, labeling and detecting.10 Owing to the extended planar π-electron-conjugated system, cyanine dyes have the ability to assemble into various supramolecular aggregates spontaneously or be induced by the target. Moreover, the aggregates stabled by the van der Waals forces are delicate and easily influenced by the surrounding environment. Bio-macromolecules have unique 3D structure and regular charge distribution, making them become good templates to regulate the assembly state of cyanine dye. In turn, the assembly state of cyanine dye can reflect the slight conformational change of bio-macromolecules, including oligonucleotides,10c,11 oligopeptides,12 and proteins.13
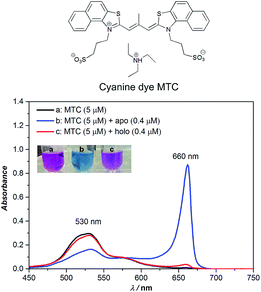
Owing to the planar naphthalene–thiazole, cyanine dye MTC (3,3′-di(3-sulfopropyl)-4,5,4′,5′-dibenzo-9-methyl-thiacarbo-cyanine triethyl-ammonium salt, shown in Fig. 1) tends to self-assemble into various aggregates (including dimer, J-, H- aggregates, etc.) under different conditions and presents distinguishing absorption shifts in different forms of assembly. In methanol, MTC was in the form of monomer and the absorption peak was around 573 nm, while in Tris–HCl buffer solution (10 mM, pH 6.8, 35 °C) the absorption band blue shifted to around 530 nm assigned to MTC dimer (Fig. S1†).10a,14
When considering MTC could interact with hTf strongly in our previous work15 which presented a high affinity Ka ∼ 109 M−1, adding apo- and holo-Tf (0.4 µM), respectively, into MTC dimers (5 µM) gave rise to an unexpected phenomenon (Fig. 1). As shown in Fig. 1, the addition of apo-Tf induced the decrease of MTC dimers around 530 nm while appearance of a new strong peak at 660 nm, assigned to MTC J-aggregates.10a,14 Meanwhile the apparent solution color notably changed from pink to blue, corresponding to the changes of MTC assembly states. For holo-Tf, either the absorption spectra or apparent solution color had much weaker change. Thus, we speculated that MTC J-aggregates could be a specific response signal to recognize apo-Tf with the unique “open conformation”. In order to verify this idea, the detailed analysis of MTC absorption changes induced by different concentrations of apo-Tf (Fig. S2†) and holo-Tf (Fig. S3†) in sub-micromolar were investigated, respectively.
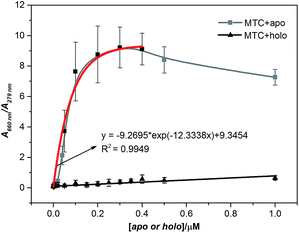
Further, we discussed the results in detail, the concentrations of apo-Tf and holo-Tf are correlating well with the signature peaks on the absorption spectra. To eliminate the influence caused by the different concentration of protein, we chose the absorbance ratio A660 nm/A279 nm as the detecting signature of MTC (Fig. S4†). Fig. 2 shows the job plots of MTC J-aggregate signals (A660 nm/A279 nm) against the concentrations of apo-Tf and holo-Tf, respectively. As the apo-Tf increased, the dimer dropped off gradually and A660 nm/A279 nm increased following slightly decrease of over-saturation in 0.4–1 µM. Interestingly, the A660 nm/A279 nm signals in the range of 0–0.4 µM can be fitted into an exponential curve (R2 = 0.9946). The limit of detection (LOD) of apo-Tf reached to around 10 nM (shown in Fig. S5†). In the case of holo-Tf, even though up to 1 µM, it hardly induced observable A660 nm/A279 nm signal. It is indicated that apo-Tf has the ability to induce MTC assembly from dimers to J-aggregates, while holo-Tf scarcely. It is well known that apo-Tf is in “open” conformation. When binds with two iron ions, the conformation of Tf would change from “open” to “closed” (holo-) and its ability to induce MTC assembly dramatically decreased. Therefore, MTC J-aggregation could be regarded as a response signal to tell apo-Tf from holo-one, which means MTC has the potential ability to be a conformational probe for Tf.
Based on the above results, MTC not only has the specific ability to recognize two different conformations of Tf (apo- or holo-) via the J-aggregates signature (A660 nm/A279 nm), but also can quantitatively detect the apo in sub-micromolar level. CD spectroscopy is a popular method to detect chiral bio-macromolecules, such as proteins8c,9 and nucleic acids.11,12 It is well known that holo-Tf would present a negative CD signal at 460 nm while apo-one no (Fig. S6 and S7†). This unique signal was widely used to discriminate the conformation of Tf.8c,9 However, as we mentioned above, the sensitivity of CD spectroscopy is relatively low. In the case of MTC, since apo-Tf could induce the formation of MTC J-aggregates, one protein can gather much more MTC molecules and provide much higher signals. Owing to this assembly-amplified strategy, we could reveal a tinier amount of 10 nM apo-Tf, about 1500-fold lower than the conventional CD detection limit (15 µM in our experimental condition) (Fig. S8†). Besides, the absorption signal of MTC locates in visible band, which could be easily determined through spectrophotometer or observed using naked eye.
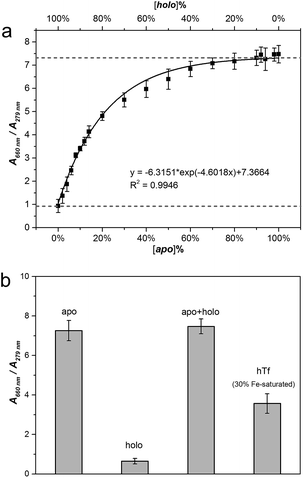
In order to further test this method, we carried out three experiments to support our ideas. Firstly, we applied the method into artificial mixtures of apo-/holo-Tf to test the detecting ability of MTC because Tf tends to stay as a conformational mixture in real organism, although Tf folds in certain single conformation in the solution. In our experiments, we mixed apo- and holo-Tf under different ratios with the total protein concentration at 1 µM (Fig. S9†). Fig. 3a is about the job plot of A660 nm/A279 nm against the concentration ratios of apo-/holo-Tf. Similar as apo-Tf alone, MTC J-aggregates signals also induced by the increase of the percentage of apo- in the mixture system. When the percent of apo-Tf up to 80%, the J-signal arrived to saturation which suggested the presence of holo-Tf had no influence on the detection process. Moreover, the regression analysis of A660 nm/A279 nm also fit a standard exponential curve (R2 = 0.9946) and the LOD is around 2% (Fig. S10†). In this case, the curve shown in Fig. 3a could be regarded as a standard curve to calculate the concentration ratio of apo-/holo-Tf precisely in any Tf conformational mixture. In order to directly observe the variety and difference of MTC J-aggregates in different solution system, the Fig. 3b give a good insight into the specific recognizing ability of MTC J-aggregates to apo-Tf. Notably, the detecting ability of MTC J-aggregates in the artificial mixture system of apo- and holo-Tf is nearly equal to in the pure single apo-Tf system.
Secondly, the interaction between MTC and natural hTf also had been studied to further applied MTC into practical application. In normal human serum, Tf averagely with 30% saturation of Fe3+ (hTf) belongs to natural mixture of conformation. The detailed titration absorption spectra were shown in Fig. S11 (see ESI†). It has been proved that apo-Tf with two unoccupied lobes has the strong ability to induce MTC J-aggregates while holo-Tf hardly. It is reasonable to expect that 30% Fe saturated hTf would present medium ability to induce MTC J-aggregation. As predicted, the job curve of MTC J-aggregate signal (A660 nm/A279 nm) with hTf (black solid line) is in the middle of those with apo- (dash dot line) and holo-Tf (dash line) (Fig. S12†). Similar with the case of apo-Tf, the job curve of hTf also was fitting exponential curve (R2 = 0.9665). The results suggest that MTC can also be applied to detect Tf in a dynamic balance under the certain ratio of protein to iron ion.
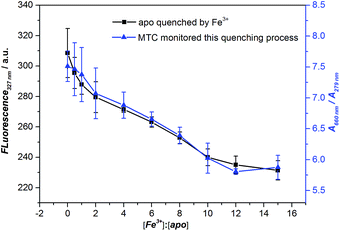
As we all know, the Fe3+ can trigger the Tf conformation change from open to closed. Finally, we used Fe3+ to regulate the conformational change of apo-Tf into holo-Tf and measured this process by fluorescence. It is well accepted that measuring the fluorescence signal of tryptophan residues of protein can monitor this conformational change process.8b,16 Binding Fe3+ with apo-Tf would cause the consequent Förster resonance energy transfer (FRET) and the fluorescence of tryptophan dramatically decreased (see Fig. S13†), indicating the conformation of Tf changed from “open” state to iron-bound state. Meanwhile, in the absorption spectra, we observed the MTC J-aggregation intensity decreased with the Fe3+ concentration increased, indicating that opened conformation gradually changed to closed conformation with the addition of Fe3+, which is accordance with the fluorescence results. The job plots of both the fluorescence intensity of apo-Tf and the MTC J-aggregate signals (A660 nm/A279 nm) against the concentrations ratio of Fe3+: apo-Tf were shown in Fig. 4. It reminds us that MTC is promising to apply in the detection the conformational change of Tf.
It is worthy to mention that the limited fluorescence assay can only determine the absolute amount of Tf. Usually it is hard to know the exact amount of apo- or holo- protein among the whole mixture under the real condition. For MTC, however, it provides a relative conformation ratio between apo- and holo- states, rather than the absolute amount. In this case, MTC can reveal the Tf conformational information by detecting the total Tf protein amount (which is much easier to determine in practical), rather than the amount in specific conformation.
Conclusions
In short, we constructed a novel MTC supramolecular assembly as an excellent probe to specifically recognize, quantitatively detect and monitor the conformation of Tf relying only on absorbance as the detection method. Based on the unique supramolecular assembly properties, MTC assembly reflects these advantages: (1) to recognize apo-Tf against holo-Tf in sub-micromolar level; (2) to determine the apo-/holo- ratio in Tf conformational mixture and the LOD is around 2%; (3) to make the detection of Tf conformational change be possible by a simple method. The probe design based on assembly-amplified signal strategy shows broad application prospects in bio-macromolecular detection. Further, this detecting method will gradually extend to cells or actual serum samples, expected as a clinical detection index for the transportation of target.Conflicts of interest
There are no conflicts to declare.Acknowledgements
This work was supported by National Nature Science Foundation of China (Approval No. 21603071); National Natural Science Foundation of Hebei Province (Approval No. B2016209098).Notes and references
-
(a) H. Y. Li and Z. M. Qian, Med. Res. Rev., 2002, 22, 225–250 CrossRef CAS PubMed
; (b) H. M. Baker, B. F. Anderson and E. N. Baker, Proc. Natl. Acad. Sci. U. S. A., 2003, 100, 3579–3583 CrossRef CAS PubMed
; (c) H. Drakesmith and A. Prentice, Nat. Rev. Microbiol., 2008, 6, 541–552 CrossRef CAS PubMed
.
- J. Wally, P. J. Halbrooks, C. Vonrhein, M. A. Rould, S. J. Everse, A. B. Mason and S. K. Buchanan, J. Biol. Chem., 2006, 281, 24934–24944 CrossRef CAS PubMed
.
- N. Noinaj, N. C. Easley, M. Oke, N. Mizuno, J. Gumbart, E. Boura, A. N. Steere, O. Zak, P. Aisen, E. Tajkhorshid, R. W. Evans, A. R. Gorringe, A. B. Mason, A. C. Steven and S. K. Buchanan, Nature, 2012, 483, 53–58 CrossRef CAS PubMed
.
- N. Yang, H. M. Zhang, M. J. Wang, Q. Hao and H. Z. Sun, Sci. Rep., 2012, 2, 999 CrossRef PubMed
.
- B. E. Eckenroth, A. N. Steere, N. D. Chasteen, S. J. Everse and A. B. Mason, Proc. Natl. Acad. Sci. U. S. A., 2011, 108, 13089–13094 CrossRef CAS PubMed
.
- C. Zhao, X. S. Li, L. Y. Li, X. Gong, Y. Chang and J. Zheng, Chem. Commun., 2013, 49, 9317 RSC
.
-
(a) K. Mizutani, M. Toyoda and B. Mikami, Biochim. Biophys. Acta, Gen. Subj., 2012, 1820, 203–211 CrossRef CAS PubMed
; (b) J. Wally, P. J. Halbrooks, C. Vonrhein, M. A. Rould, S. J. Everse, A. B. Mason and S. K. Buchanan, J. Biol. Chem., 2006, 281, 24934–24944 CrossRef CAS PubMed
; (c) B. F. Anderson, H. M. Baker, G. E. Norris, S. V. Rumball and E. N. Baker, Nature, 1990, 344, 784 CrossRef CAS PubMed
; (d) B. F. Anderson, H. M. Baker, E. J. Dodson, G. E. Norris, S. V. Rumball, J. M. Waters and E. N. Baker, Proc. Natl. Acad. Sci. U. S. A., 1987, 84, 1769 CrossRef CAS PubMed
.
-
(a) Q. Y. He, A. B. Mason, B. A. Lyons, B. M. Tam, V. Nguyen, R. T. A. MacGillivray and R. C. Woodworth, Biochem. J., 2001, 354, 423–429 CrossRef CAS PubMed
; (b) N. G. James, C. L. Berger, S. L. Byrne, V. C. Smith, R. T. A. MacGillivray and A. B. Mason, Biochemistry, 2007, 46, 10603–10611 CrossRef CAS PubMed
; (c) S. Tang, R. MacColl and P. J. Parsons, J. Inorg. Biochem., 1995, 60, 175–185 CrossRef CAS PubMed
.
-
(a) H. Y. Du, J. F. Xiang, Y. Z. Zhang, Y. L. Tang and G. Z. Xu, J. Photochem. Photobiol., A, 2008, 195, 127–134 CrossRef CAS
; (b) H. Y. Du, J. F. Xiang, Y. Z. Zhang and Y. L. Tang, Bioorg. Med. Chem. Lett., 2007, 17, 1701–1704 CrossRef CAS PubMed
; (c) S. M. Kelly, T. J. Jess and N. C. Price, Biochim. Biophys. Acta, Proteins Proteomics, 2005, 1751, 119–139 CrossRef CAS PubMed
.
-
(a) L. X. Wang, J. F. Xiang, H. X. Sun, Q. F. Yang, L. J. Yu, Q. Li, A. J. Guan and Y. L. Tang, Dyes Pigm., 2015, 122, 382–388 CrossRef CAS
; (b) E. M. S. Stennett, M. A. Ciuba and M. Levitus, Chem. Soc. Rev., 2014, 43, 1057–1075 RSC
; (c) Q. F. Yang, J. F. Xiang, S. Yang, Q. J. Zhou, Q. Li, Y. L. Tang and G. Z. Xu, Chem. Commun., 2009, 9, 1103–1105 RSC
; (d) X. Chen, S. W. Nam, G. H. Kim, N. Song, Y. Jeong, I. Shin, S. K. Kim, J. Kim, S. Park and J. Yoon, Chem. Commun., 2010, 46, 8953–8955 RSC
.
- Q. F. Yang, J. F. Xiang, S. Yang, Q. Li, Q. J. Zhou, A. J. Guan, X. F. Zhang, H. Zhang, Y. L. Tang and G. Z. Xu, Nucleic Acids Res., 2010, 38, 1022–1033 CrossRef CAS PubMed
.
- Q. F. Yang, J. F. Xiang, Q. Li, W. P. Yan, Q. J. Zhou, Y. L. Tang and G. Z. Xu, J. Phys. Chem. B, 2008, 112, 8783–8787 CrossRef CAS PubMed
.
-
(a) H. X. Sun, J. F. Xiang, X. F. Zhang, H. B. Chen, Q. F. Yang, Q. Li, A. J. Guan, Q. Shang, Y. L. Tang and G. Z. Xu, Analyst, 2013, 139, 581–584 RSC
; (b) Y. Z. Zhang, J. F. Xiang, Y. L. Tang, G. Z. Xu and W. P. Yan, ChemPhysChem, 2007, 8, 224–226 CrossRef CAS PubMed
; (c) Y. Z. Zhang, H. Y. Du, Y. L. Tang, G. Z. Xu and W. P. Yan, Biophys. Chem., 2007, 128, 197–203 CrossRef CAS PubMed
.
-
(a) D. Takahashi, H. Oda, T. Izumi and R. Hirohashi, Dyes Pigm., 2005, 66, 1–6 CrossRef CAS
; (b) F. Würthner, T. E. Kaiser and C. R. Saha-Möller, Angew. Chem., Int. Ed., 2011, 50, 3376–3410 CrossRef PubMed
.
- X. F. Zhang, L. Chen, Q. F. Yang, Q. Li, X. R. Sun, H. B. Chen, G. Yang and Y. L. Tang, Colloids Surf., A, 2015, 469, 187–193 CrossRef CAS
.
- S. S. Lehrer, J. Biol. Chem., 1969, 244, 3613–3617 CAS
.
Footnote |
| † Electronic supplementary information (ESI) available: Details of materials and methods, and Fig. S1–S12. See DOI: 10.1039/c7ra04272h |
| This journal is © The Royal Society of Chemistry 2017 |


![[thin space (1/6-em)]](https://www.rsc.org/images/entities/char_2009.gif) :
: