 Open Access Article
Detection of domestic detergent residues on porcelain tableware using laser induced breakdown spectroscopy
Xiande Zhao abc,
Daming Dongbc,
Yang Lic and
Chunjiang Zhao*bc
aChina Agricultural University, China
bBeijing Research Center of Intelligent Equipment for Agriculture, China. E-mail: chunjiangzhao@foxmail.com; Fax: +86-010-51503626; Tel: +86-010-51503654
cBeijing Academy of Agriculture and Forestry Sciences, China
First published on 31st May 2017
Abstract
Domestic detergents are widely used and the detection of detergent residues on tableware is closely related to people's health. As is known to all, it is difficult to sample and measure the residual detergent on tableware. The purpose of this paper is to explore a rapid in situ detergent residues detection method. We have using laser-induced breakdown spectroscopy (LIBS) measured the detergent on porcelain plate. Based on our previous research, we further studied the spectra of detergent in argon atmosphere, and compared them with that in air. We found the spectral characteristics of the cyanogroup (CN) were related to the air around the measuring point. It was indicated that CN could not as previously speculated be used as the LIBS detection feature of detergent. The improvement of signal-to-noise ratio (SNR) in argon environment was proved and we made a study of semi quantitative measurement by the peak height of 330.30 nm in argon atmosphere. An experiment measuring the detergent on tableware after washed was taken. It illustrated that the LIBS technology has promising potential applications for tableware cleaning process or food production process as a means of on-line detection.
Introduction
Detergent has been widely used in the food and beverage industry, meanwhile it has also become a household cleaning supply used for cleaning tableware and daily necessities.1 Detergent is closely related to people's health. It has been proved that the interaction between detergent and estrogen receptor protein can cause endocrine disorders,2 and would produce toxic effects on organisms after long term detergent accumulation.3–5 Detergent compositions are complex, and the most important component is the surfactant.6 Detecting detergent residue is more complex. Generally, a specific component in detergent is selected as the representative measurement object which is detected by corresponding method. For example, using spectrophotometric method the phosphate in detergent can be monitored;7 high performance liquid chromatography (HPLC) is a useful method to detect the nonylphenol polyethoxylates in detergent.8 Colorimetric method can be used to determine the level of detergent9 and spectroscopic methods are effective in measuring detergent composition. Attenuated total reflectance-Fourier transform infrared spectroscopy (ATR-FTIR) is used in measuring Na4EDTA in detergent solution.10 And FTIR is used to monitored detergent removal from biological samples.11 Because of the need for pretreatment of samples, these methods are relatively complex. There are also researchers achieve direct measurement of detergent based on sensor technology. For instance, detergent can be determined by chemical sensor with impedance titration,12 and some other sensing techniques that based on electric potential, current, conductance, piezoelectricity and photochemistry have been reported.13–15 However, there are some limitations in sensor measurement. During the sensing process, the sensors need to contact with the measured object, and it requires a large number of liquid sample. But the residual detergent on tableware is very less and not easy to sample. Therefore, sensor methods are not suitable for direct measurement of detergent residues.Laser induced breakdown spectroscopy (LIBS) is a promising technology, because it does not require sampling and can detect almost all elements.16 It has a great advantage and potential in the field of on-line detection of materials in small area.17 The LIBS technology is easy to realize the miniaturization of in situ measurement.18,19 Using LIBS to detect detergent residue is a novel and appropriate application. This technology is more flexible and can be used for various shapes of tableware. It can measure very little detergent residue on the surface of tableware whether it is dry or fresh. And it has almost no damage to the tableware.
However, there is few literatures on the application of LIBS in household detergents, and our team is the first to apply this technique to the measurement of household detergents. We have done a preliminary study on monitoring detergent residues by using LIBS technology.20 In the previous study, we found three characteristic bands of detergent residues, and on this basis, we compared the spectral features of different brands of detergent, and compared the spectral characteristics of detergents on three kinds of substrates. We have proved LIBS can be used in the detection of the detergent residues on porcelain, bamboo and stainless steel tableware that often used in people's lives. And based on the data of three characteristic bands combining with the principal component analysis (PCA), we realized the qualitative analysis of the detergents had been diluted by different times.
In this paper, further study about the measurement of residual detergent on porcelain tableware using LIBS technology was explored based on the previous study. The main purpose of this study is: ① to explore the source of CN features of detergent displayed in spectra after excited by laser, and to determine whether it can be used for the measurement of detergents as previously speculated; ② to improve the signal-to-noise ratio (SNR) of LIBS system in argon atmosphere, and to take semi quantitative measurements of detergent residue; ③ at last, simulated the actual situation in daily life, a measurement of detergent which has been washed by water will be carried out to verify the practicability of LIBS technology.
Materials and methods
Samples
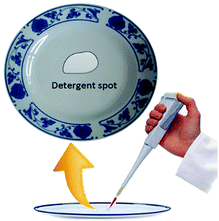
The detergent measured in this paper was bought from Chaoshifa Supermarket located in Zhanghua Road of Beijing, whose brand was Diaopai (Nice Group Co., Ltd., Lishui, Zhejiang, China), packaged as 500 mL per bottle. The substrate materials of detergent was a porcelain plate with ivory color and glaze surface. It was made of china clay and the edge with blue painted flowers as decoration. It has been washed by deionized water and dried. The pretreatment of detergent sample was diluted by deionized water. Before measurement about 2 μL detergent solution was absorbed by pipette, and dropped on the surface of porcelain dish where clean, smooth and no dye stain. The detergent spot was shown in Fig. 1. Then the dish with detergent samples was put in a clean environment to dry naturally. The sink used in the experiment was a rectangular transparent glass tank in which the plate was washed. Its size was 0.3 × 0.3 × 0.6 m. There was a water inlet and a water outlet at both ends and the water in the tank can flow at a certain speed.Experimental devices
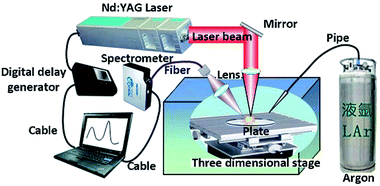
We used the LIBS system to collect the signal of the samples. Fig. 2 shows the overall structure and optical design of the experimental system. It comprised a laser, a delay generator, a spectrometer and a three-dimensional moving platform. The laser was a Q-switched Nd:YAG laser produced by Beamtech Optronics Ltd. (Beijing, China). The wavelength of the laser beam was 1064 nm and the pulse width was less than 7 nm with the repetition frequency of 10 Hz. The beam laser was reflected by a mirror. Then the laser was collimated by the lens and focused on sample surfaces. The delay generator was integrated into the equipment to produce the delay time from laser emission to spectrometer collection. The spectrometer was HR2000+ produced by Ocean Optics Company. The spectral range of the spectrometer was from 200 nm to 1000 nm. The resolution was 0.2 nm and the signal-to-noise ratio was 250![[thin space (1/6-em)]](https://www.rsc.org/images/entities/char_2009.gif) :
:![[thin space (1/6-em)]](https://www.rsc.org/images/entities/char_2009.gif) 1. The integration time was set at 1 ms. The three-dimensional moving platform driven by a stepper motor can realize 3D precise adjustment. It was used to adjust the position of samples. Argon gas was introduced into the detection chamber through a pipe to create an argon atmosphere and the flow rate of argon gas was about 0.4 m s−1.
1. The integration time was set at 1 ms. The three-dimensional moving platform driven by a stepper motor can realize 3D precise adjustment. It was used to adjust the position of samples. Argon gas was introduced into the detection chamber through a pipe to create an argon atmosphere and the flow rate of argon gas was about 0.4 m s−1.
Experimental design
To compare the LIBS spectra collected in air and in argon, we detected the detergent in the two kind of atmosphere using the same settings of LIBS system. The detergent was diluted by deionized water and dropped on the surface of plate and dried. The concentrations of detergent were 70![[thin space (1/6-em)]](https://www.rsc.org/images/entities/char_2009.gif) 800 μg cm−2, 1416 μg cm−2, 708 μg cm−2, 141.6 μg cm−2, 70.8 μg cm−2, 35.4 μg cm−2 and 0 μg cm−2. In the washing progress, the detergent was dropped on plates and dried. Then the plates were immersed in a sink with flowing water.
800 μg cm−2, 1416 μg cm−2, 708 μg cm−2, 141.6 μg cm−2, 70.8 μg cm−2, 35.4 μg cm−2 and 0 μg cm−2. In the washing progress, the detergent was dropped on plates and dried. Then the plates were immersed in a sink with flowing water.
When the time being detected, the detergent on plate surfaces was ionized and vaporized by the high-power laser. Then plasma was produced. The high-temperature vaporized plasma would be broken down into atoms and ions. At the end of laser pulse, the plasma would be cooled and spread to the surrounding environment. The atoms and ions in the excited state would relax from high energy level to low energy level and the optical radiation of specific wavelength would be emitted. A quartz fiber is used to collect the spectrum signal and transmit it to the spectrometer.
Each time, we selected 12 sampling points and collected 12 spectra for each sample and averaged 12 spectra data to reduce the errors.
The data analyzing software used in this paper was Unscrambler 9.7 and the diagrams were drawn by OriginPro 2016 (32-bit).
Optimization of laser energy and delay time
In the LIBS system, the pulsed laser ablated the sample by emitting an instantaneous high energy laser to excite the materials and make them plasma. The choice of laser energy needs to consider some factors. Firstly, the phase of the sample should be considered because different phase samples have different characteristics of reflection, absorption and transmission, and they have different responses to the laser excitation. Secondly, the presence of water molecules can reduce the laser ablation threshold of the sample, so the moisture content of the sample is an important factor to be considered. In addition, the change of atmospheric pressure also affects the formation of plasma.According to the principle of LIBS system, after the laser beam focused on a target, the instantaneous radiation is mainly the bremsstrahlung, thermal radiation and scattered light on the object surface. When the sample has just been excited to plasma by the high energy laser, the atomic spectrum emitted from the plasma is submerged in the background noise signal. The baseline of the spectrum is high and the observed signal tends to be continuous spectrum. With the decrease of plasma energy, the bremsstrahlung and thermal radiation are weaker and weaker, while the atomic emission spectrum of the plasma is becoming stronger and stronger. At this time, more and more obvious and regular useful signals are emerge, which are characteristic peaks of each wavelength.
To form plasma successfully, the laser energy is required high enough to exceed the threshold of excitation. Both too low and too high energy laser pulses will cause the SNR reduction. So the detection ability of the system can be improved by optimizing the laser pulse excitation energy. When the energy of laser beam is at a relatively low level but just higher than the breakdown threshold we can get the best SNR.21 Meanwhile the LIBS system requires strict timing of spectral acquisition. It is important to choose the appropriate delay time to improve the SNR of the signal. It is necessary to consider the types, shapes and properties of samples, and the excitation energy is also a consideration. The excitation energy needs to be fixed and stable. To get the optimal SNR we need select the suitable laser excitation energy and match the acquisition delay time.
Fig. 3 shows the spectra of the dried detergent that dropped on a clean porcelain dish when it was liquid. Fig. 3(a) shows the spectra variation when the laser excitation energy decreased from 100% (150 mJ) to 30% (45 mJ). It can be seen that when the laser energy was 100%, the spectrum had a large number of peaks, but there was also a strong background noise signal which caused the baseline not smooth. With the decline of the excitation energy, the background noise signal decreased while the SNR increasing. When the laser energy was reduced to 30%, the baseline became smooth, but the spectrum has lost most of the useful characteristic peaks. In order to ensure a better effect, the laser excitation energy was optimized to 70% (105 mJ) in order to ensure the excitation of the spectrum. Fig. 3(b) shows the spectra change when the acquisition delay time extended from 0 μs to 10 μs. There was a strong light signal immediately after laser excitation. At this time, the signal contained strong bremsstrahlung and thermal radiation and so much useless background noise makes the signal appear continuous spectrum. Within 0–1 μs after laser excitation, the background noise signal decreased gradually with time, but the baseline near the signal peak was still lifted, and the peak was deformed. So this was not the right time to collect the spectral signal. When the delay time was more than 1 μs, the SNR increased and the baseline gradually became smooth. At the delay time of 7 μs, the baseline was almost a straight line and most of characteristic peaks were lost except some strong signal. Now it has been not suitable for the acquisition of spectral signal.
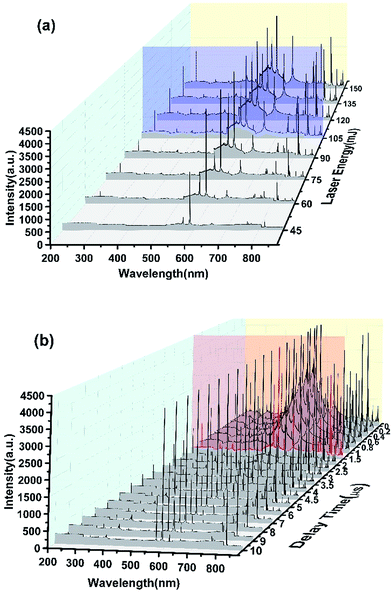 | ||
| Fig. 3 The variations of spectra with the changes of laser output energy (a) and acquisition delay time (b). | ||
In this study, a comprehensive consideration of the laser excitation energy and signal acquisition delay time was made. The laser energy has been set at 105 mJ (Fig. 3(a), blue line). In order to obtain the highest SNR and reduce the difficulty of the follow-up data processing, we set the signal acquisition delay time was 1.5 μs (Fig. 3(b), red line) at which we can obtain the highest SNR while retaining the most characteristic peaks.
Results and analysis
In previous studies,20 we have known that the characteristic peaks of many kinds of elements can be observed in the spectrum of detergent. It shown that detergents contain the elements corresponding to the characteristic peaks, including Ca, Na, C, H, O, N and other elements. There were obvious spectral features in three spectral bands which are 615–617 nm, 568–570 nm and 382–390 nm. These three bands represented different atoms and molecules. 615–617 nm band has two peaks, 615.42 nm and 616.22 nm, that both are the characteristic peaks of Na element. There were two characteristic peaks in the 568–570 nm band, and the two peaks had some overlap, which respectively are the emission line of Na at 568.82 nm and the emission line of H2 at 568.41 nm. The last band 382–390 nm was characterized by a series of regularly arranged spectral lines, including 385.09, 385.47, 386.19, 387.14 and 388.34 nm, which are the characteristics of CN molecule. In addition to the above mentioned several characteristic bands, there were still some weak characteristic peaks, for example, the spectral line of Ca element at 247.73 nm and 399.46 nm; the emission line of Na at 330.24 nm. The intensity of these spectral lines are relatively weak.The LIBS characteristics of detergent are clear, and the previous studies may be able to achieve qualitative and quantitative measurement using the three bands. In the last two decades, it has been shown that a certain number of diatomic molecular fragments such as C2 and CN also provide useful indications for identification of organic materials.22,23 But for LIBS of detergent, the formation cause of CN was not clear. The CN spectral lines are important features of the LIBS spectra of detergent. It is significant for the qualitative and quantitative measurement, so the formation mechanism of molecule CN is an important exploration of the research.
Source of CN molecule
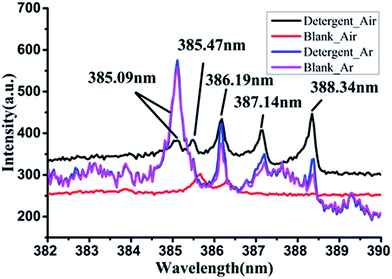
There are three possible sources of CN. The first is that the chemical bond of the macromolecular compound in detergent is interrupted by high energy laser, and the CN molecule is released directly. The second is the C and N atoms in the excited plasma combine to form CN molecules. There is also a possible source that is the C and N elements in detergent to form CN reacting with ambient air during laser excitation, and the molecular emission lines are excited before the energy is completely dissipated.In this paper, we studied the source of CN in the LIBS spectrum of detergent. We collected the LIBS spectra of detergent respectively in air and argon atmospheres and compared the spectral peaks of CN in the two cases with that of blank dish. The CN band of detergent and blank dish under two atmospheres were displayed in Fig. 4.
In air atmosphere, the LIBS spectrum of detergent had obvious CN peaks, but the spectrum of the ceramic dish without detergent had no CN peaks. It was shown that the CN peaks can form when the detergent was stimulated by laser in air. While in argon atmosphere, there were four adjacent spikes in this band of the detergent LIBS spectrum, which was very similar to the characteristic of CN. But the relative intensity distribution of the four peaks was different from the range of CN peaks. The strongest intensity one in the four peaks was most close to the short wave direction and the lower peaks were closer to the long wave direction. It was opposite to the arrangement of the CN peaks which shows that the longer the wavelength, the stronger the peak intensity. Comparing the LIBS spectra of detergent and the blank plate in argon, it was found that the peaks at the band of 382–390 nm were almost same and unlike the spectral peaks collected in air who had obvious differences. Therefore, we inferred that the existence of air was the key factor to produce the CN molecules.
According to the above results, we analyzed when the detergent irradiated by high energy laser in air atmosphere, the molecule bonds of detergent around the laser action point were interrupted and lots of unstable ions were released. Then these ions contact and react with the high-energy excited air. In the reducing process of the plasma energy, a large number of C and N ions combined and existed as the CN molecules form which was relatively stable. When the molecular energy was reduced, the molecular spectrum was emitted to form the CN spectral characteristics.
Therefore, the characteristic band of CN at 382–390 nm has relationships with both the C, N elements in detergent and the surrounding air. So it cannot fully reflect the concentration of detergent. This band can be used to developed qualitative auxiliary measurements, but not enough to be taken quantitative measurements.
Improvement of SNR in argon atmosphere
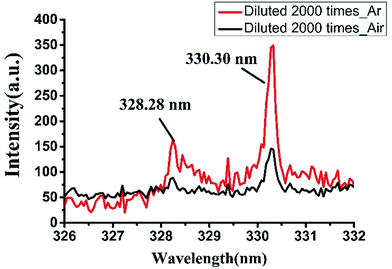
It is possible to significantly improve the SNR of the LIBS spectrum by making argon atmosphere around samples in the measurement system. This is mainly due to the low ionization energy of argon, which is easier to ionize and produce more electrons. In addition, the mass of argon atoms is large and argon has a higher density than air at the same pressure. Therefore, the space constraint of argon is stronger than air in the process of plasma expansion. So it is easy to prevent the electrons from escaping from the observation area and easy to obtain a strong characteristic spectral line signal.Under argon atmosphere, the spectral strength of background is also increased. It is due to the decrease rate of electron density and the reduction rate of plasma temperature are both slower in argon atmosphere than in air,24 and the intensity of continuous background radiations that caused by bremsstrahlung and recombination radiation are higher in argon atmosphere. Compared the LIBS spectra of detergent collected in argon atmosphere and that in air, we found obvious improvement of SNR at the spectral line position. Fig. 5 shows two emission lines of sodium at the wavelength of 328.28 nm and 330.30 nm. It can be seen that when the detergent was diluted 2000 times, it was almost impossible to detect the peak of the spectrum at 328.28 nm in air and the signal to background ratio (SBR) was only 1.77. The peak intensity at 330.30 nm was slightly stronger, but the SBR was only about 2.88. However, in argon atmosphere, the SBRs of the spectral peaks at 328.28 nm and 330.30 nm were increased to 3.05 and 6.79 respectively. Therefore, argon atmosphere has a significant signal enhancement for LIBS technology on the detection of detergent. When developing detergent residue detection equipment on the basis of LIBS technology, we can add an argon accessory for the device to create an argon atmosphere to reduce the detection limit and improve the detection ability of the equipment.
Semi quantitative measurement
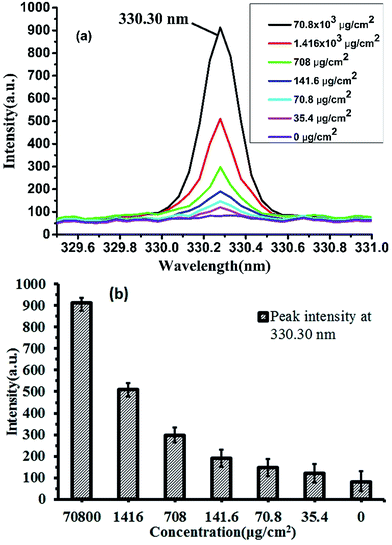
The LIBS technology need not sampling and can detect almost all elements, with the advantage in micro area testing, it is a kind of effective online detecting technique with great potential and broad prospects on online elemental analysis. Domestic detergent is widely used in people's daily life used for cleaning tableware and even fruits. The general is dissolved in water, diluted after use, so the detergent diluted LIBS detection ability is of our concern, this paper uses LIBS technology to detect different concentrations of detergent, we try to realize the quantitative measurement of detergent. Generally, detergents are dissolved in water and used after dilution. So the LIBS's ability to detect diluted detergent is our concern. In this paper, the LIBS technology was used to detect the detergent with different concentrations. We attempt to explore the quantitative measurement of detergent.In the previous study,20 we have used principal component analysis (PCA) to realize the classification of four detergent concentrations at two spectral bands of 568–570 nm and 615–617 nm. However, due to the strong peak intensity in these two bands, it is easy to cause the detector signal response saturation and result in the spectral peaks deformation that affect the accuracy of quantitative measurement. Through careful study, we found that the characteristic peak of Na element at 330.30 nm has a good linear variation. The detergent after being diluted to different concentrations dropped on a plate and dried, then the measurements were performed in an argon atmosphere using LIBS and the result was shown in Fig. 6.
Fig. 6(a) shows the peak intensities of the spectra at the 330.30 nm position. We can see that the intensity of this wavelength was positively correlated with the amount of residual detergent; Fig. 6(b) shows the histogram with error bars of peak intensity at 330.30 nm. As can be seen from the graph, the spectral peak intensity decreased from 912.5 to 82.4 when the residual detergent was decreased from 70![[thin space (1/6-em)]](https://www.rsc.org/images/entities/char_2009.gif) 800 g cm−2 to 0 g cm−2.
800 g cm−2 to 0 g cm−2.
Therefore, the LIBS technology has the potential to quantitatively measure the residual detergent on porcelain plates. However, when the residue of detergent is lower, the error of LIBS measurement is larger. In this experiment, the maximum standard deviation was 48. This may be because when the detergent concentration was reduced, the error caused by the uneven distribution of dried detergent on the surface of the porcelain dish was greater, which affected the accuracy of the LIBS measurement. In the actual measurement process, if the detergent concentration is low, we can reduce or even eliminate the measurement error caused by uneven distribution of detergent by multiple measurements at different locations. Therefore, in the development of portable LIBS detection equipment, the mobility of measurement points is a quite important design content.
Measurement of detergent after washing
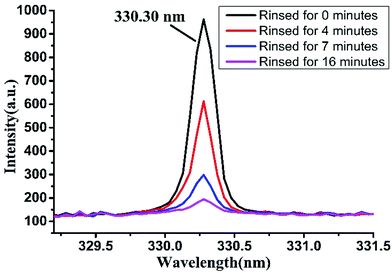
Detergent is often dissolved and diluted and then used for cleaning tableware. After cleaning the dishes, a large amount of water is used to rinse them to remove the residual detergent. But it is very difficult to completely remove the detergent residue on tableware. If the amount of flushing water or rinse time is not enough, it is easy to cause detergent residues, endangering people's health. Based on this, we rinsed the detergent attached on porcelain plate with clear water, and then studied the detection effect of LIBS technology on measuring the residual detergent on plate after washing for different time.We dropped original detergent on porcelain plate and dried it in natural condition. Then we put the plate into a water tank with flowing water. The water in the water tank was flowing at a rate of about 0.25 m s−1 and updating through the water inlet and outlet. The detergent attached on the porcelain dish was slowly dissolved into the water, and the dissolved portion would flow along with the water. The LIBS spectra in argon atmosphere were collected when the porcelain dish was immersed in water for a period of time. As shown in Fig. 7, the peak height at 330.30 nm was correlated with the soaking time of the detergent. The peak intensity decreased with the increasing of the rinsing time. When rinsing for 16 minutes, the amount of water used for flushing was about 21.6 L, at this time the spectral peak at 330.30 nm was very weak whose intensity was about 194.48, which indicated that there was still a small amount of detergent on the porcelain dish. Therefore, when using detergent to clean tableware, adequate amount of water should be ensured in order to reduce detergent residues.
LIBS is a reliable detection technology for the qualitative determination of detergent. It is effective to be used to determine whether there is any detergent residue on tableware. It can be used for developing the online rapid detecting equipment used in dishwashers or other food production lines, and it has very broad application prospects.
Conclusions
In this paper, the method of using LIBS technology to detect the detergent residue on porcelain tableware was studied. It was found that the optimal SNR can be obtained when the laser excitation energy was 105 mJ and the acquisition delay time was 1.5 μs. By comparing the LIBS spectra in air and argon atmosphere, it was found that the CN group in excited plasma was not entirely from detergent, and the CN spectral characteristics cannot be used as the basis for quantitative measurement of detergent. The SNR of LIBS signal can be enhanced in argon atmosphere, and using the characteristic peak at 330.30 nm in argon atmosphere, we can realize the semi quantitative measurement of the concentration of detergent. By simulating the tableware cleaning process, the detergent residue on the porcelain plate was detected. It was proved that the LIBS technology has the potential to be used in the tableware cleaning process as an on-line detection method. However, due to the stability of the laser and the existence of interference factors, this study did not achieve accurate quantitative detection. The follow-up research work can be carried out to improve the stability of the system and to eliminate all kinds of interference factors.The LIBS technology does not need to sample, and can detect almost all elements. It is suitable for on-line measurement and has the characteristics of convenient and easy miniaturization. This technology can be used to develop a small on-line analysis equipment, installed in the food industry production line or household dish-washing machine, to realize the automatic measurement of detergent, which is very innovative and practical. The research on the method of LIBS technology for the detection of detergent, and the development of the rapid detection devices based on LIBS spectroscopy technology has a strong practical significance.
Acknowledgements
This work was supported by National Natural Science Foundation of China (No. 31600417 & 31622040) and science and technology innovation ability construction project and the youth science research fund of Beijing Academy of agriculture and Forestry Science (No. KJCX20170701, QNJJ201521).References
- L. Suárez, M. A. Díez, R. García and F. A. Riera, J. Ind. Eng. Chem., 2012, 18, 1859–1873 CrossRef.
- G. G. Ying, Environ. Int., 2006, 32, 417–431 CrossRef CAS PubMed.
- S. Fatima, R. Ajmal, G. Badr and R. H. Khan, Cell Biochem. Biophys., 2014, 70, 759–763 CrossRef CAS PubMed.
- H. A. Leder, M. Goodkin, S. Y. Buchen, D. Calogero, G. Hilmantel and V. M. Hitchins, Ophthalmology, 2012, 119(7), 30–35 CrossRef PubMed.
- S. Huntington, J. Heppner, R. Vohra, R. Mallios and R. J. Geller, Clin. Toxicol., 2014, 52, 220–225 CrossRef CAS PubMed.
- M. S. Showell, Handbook of Detergents, Part D: Formulation (Surfactant Science), CRC Press, Boca Raton, 2006 Search PubMed.
- Mahadevaiah, M. S. Y. Kumar, M. S. A. Galil, M. S. Suresha, M. A. Sathish and G. Nagendrappa, J. Chem., 2007, 4(4), 467–473 CAS.
- C. Y. Cheng and W. H. Ding, J. Chromatogr. A, 2002, 968, 143–150 CrossRef CAS PubMed.
- R. Roosloot and P. Schoen, Anal. Biochem., 2011, 413, 72–74 CrossRef CAS PubMed.
- L. Suarez, R. Garcia, F. A. Riera and M. A. Diez, Talanta, 2013, 115, 652–656 CrossRef CAS PubMed.
- I. Strug, S. Gutierrez, A. Cappione III, M. Jimenez, M. J. Mullen and T. Nadler, Spectroscopy, 2013, 28, 34 CAS.
- A. Bratov, N. Abramova, A. Ipatov and A. Merlos, Talanta, 2013, 106, 286–292 CrossRef CAS PubMed.
- M. Sak-Bosnar, Z. Grabaric and B. S. Grabaric, Food Technol. Biotechnol., 2004, 42, 197–206 CAS.
- M. Sak-Bosnar, Z. Grabaric and B. S. Grabaric, Food Technol. Biotechnol., 2004, 42, 207–212 CAS.
- J. L. Vivancos, Z. Rácz, M. Cole, J. Soto and J. W. Gardner, Procedia Eng., 2011, 25, 1125–1128 CrossRef CAS.
- D. A. Rusak, A. E. Zeleniak, J. L. Obuhosky, S. M. Holdren and C. A. Noldy, Talanta, 2013, 117, 55–59 CrossRef CAS PubMed.
- D. S. Junior, L. C. Nunes, M. D. S. Gomes, P. F. D. Souza, F. D. O. Leme, L. G. C. D. Santos and F. J. Krug, Spectrochim. Acta, Part B, 2012, 71–72, 3–13 Search PubMed.
- D. A. Cremers and L. J. Radziemski, Handbook of laser-induced breakdown spectroscopy, 2nd edn, 2013 Search PubMed.
- F. Anabitarte, A. Cobo and J. M. Lopezhiguera, ISRN Spectrosc., 2012, 2012, 285240 Search PubMed.
- X. Zhao, D. Dong, W. Zheng, L. Jiao and P. Han, RSC Adv., 2015, 5, 89164–89170 RSC.
- A. P. Michel, M. Lawrence-Snyder, S. M. Angel and A. D. Chave, Appl. Opt., 2007, 46, 2507–2515 CrossRef CAS PubMed.
- S. J. Mousavi, M. H. Farsani, S. M. R. Darbani, N. Asadorian, M. Soltanolkotabi and A. E. Majd, Appl. Opt., 2015, 54, 1713–1720 CAS.
- P. Lucena, A. Dona, L. M. Tobaria and J. J. Laserna, Spectrochim. Acta, Part B, 2011, 66, 12–20 CrossRef.
- A. J. Effenberger and J. R. Scott, Sensors, 2010, 10, 4907–4925 CrossRef CAS PubMed.
| This journal is © The Royal Society of Chemistry 2017 |

