 Open Access Article
Detection of tumor marker miRNA21 based on phosphorescent resonance energy transfer of Mn–ZnS QDs†
Jinzhi Lv,
Yanming Miao and
Guiqin Yan *
*
Shanxi Normal University, Linfen 041004, PR China. E-mail: gqyan2013@163.com; Fax: +86-357-2051243
First published on 22nd August 2017
Abstract
Since miRNA21 is a marker of many human tumors, trace detection of miRNA21 contributes to early tumor diagnosis. However, conventional methods are limited by complex sample preprocessing, high costs, or the interference from background fluorescence in biological fluids. Thus, developing simple and cheap miRNA-21 detection methods from biological fluids is very urgent. Our highlights are that: the miRNA-21 detection system based on phosphorescent resonance energy transfer solves the limitations of conventional methods, avoids the interference from the background fluorescence and scattering in biological fluids, eliminates complex sample preprocessing, and is more feasible for miRNA-21 detection in biological fluids. The principle of detection is that: QDs/PDADMAC (QDs+) nanohybrids were prepared from Mn–ZnS RTP QDs and cationic poly(diallyldimethylammonium chloride). Then a miRNA-21 sequence nanoprobe was built via the interaction between the QDs+ and 6-carboxy-X-rhodamine-DNA (ROX-DNA). The PRET between the QDs+ and ROX-DNA could quench the phosphorescence of the QDs+. After the gradual addition of the miRNA21 sequence, owing to the double-stranded structures formed between miRNA21 and ROX-DNA, the ROX-DNA desorbed from the surfaces of the QDs+, which gradually restored the phosphorescence of the QDs+. This nanoprobe had a detection limit of 1.60 nM and a detection range of 8–80 nM. This nanoprobe is more feasible for quantitative detection of miRNA21 in biological samples and has prospects in the medical diagnosis of tumors.
1. Introduction
Nucleic acid detection (specifically DNA and RNA detection) has been well appreciated in basic research of clinical diagnosis, forensic analysis, biology and biomedicine.1,2 In particular, micro-RNAs (miRNAs) are a group of small endogenetic non-encoding nucleotide sequences (about 18–25 bases) and play critical roles in hematopoietic cell differentiation, cell cycle regulation, metabolism, tumor metastasis, stem cell differentiation and virus replication.3 Specific miRNAs can be used as tumor markers to monitor the development of some tumors.4 The upregulation of miRNA21 concentrations in many types of human tumors and adjacent tissues has been confirmed, while serum miRNA21 overexpression has been proved in different cancers, such as diffused-typed b cell lymphoma, ovarian cancer, prostate cancer or breast cancer.5–8 Thus, miRNA21 can be used as a marker of many human tumors, and trace detection of miRNA21 contributes to early tumor diagnosis. The existing miRNA detection methods, including quantitative polymerase chain reaction,9 RNA imprinting,10 electrochemistry,11,12 miRNA arrays13 and surface enhanced Raman spectroscopy,14 are limited by complex sample treatment and high costs. Thus, developing simple, cheap, accurate and sensitive RNA detection methods is very urgent.In recent years, quantum dots (QDs), with unique photophysical properties, are considered as ideal fluorescent markers and have been widely applied into biological sensors and biological imaging. However, the accuracy of fluorescent QDs-based probes is largely reduced due to the severe background disturbances of fluorescence and scattering light from real biological or environmental samples, which bring about the problem of complex pretreatment. On the contrary, room-temperature phosphorescence (RTP) has longer lifetime than fluorescence and thus avoids such disturbances.15–17 Thus, RTP QDs can be used to more stably detect the molecules of biological fluids. Moreover, RTP probes are more selective due to the less frequency than fluorescence.18 RTP probes also eliminate the complicated pretreatment that is needed by biological sample analysis.16,17,19 Given these advantages, RTP QDs probes show their high prospects in biomolecular detection.16,20–28 However, there is no study about the detection of miRNAs by using the RTP of QDs.
In this study, water-soluble 3-mercaptopropionic acid (MPA)-coated Mn-doped ZnS (Mn–ZnS) QDs were prepared first. Then based on the principle of phosphorescent resonance energy transfer (PRET), QDs+/ROX-DNA detection probes were built and used to detect specific miRNA-21 sequences. Also its detection mechanism was discussed (Fig. 1). The working principle is that with poly(diallyldimethylammonium chloride) (PDADMAC) as a connecting bridge, the QDs+ and ROX-DNA were adsorbed together via electrostatic interaction to a miRNA21 detection probe system. The phosphorescence intensity of QDs+ was gradually reduced by the PRET between QDs+ and ROX, but was gradually restored after the addition of the target sequence miRNA21 when the ROX was desorbed from the surfaces of QDs+. Based on this principle, RTP probes were established for quantitative measurement of specific miRNA21 sequence. Since this method was based on the RTP of QDs, it effectively avoided the background fluorescence or scattering light of biological samples, and eliminated complex sample pretreatment, so it is especially feasible for trace detection of miRNA21 in organisms.
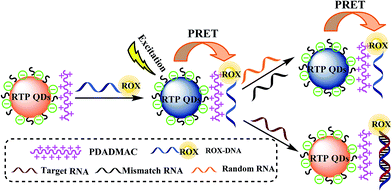 | ||
| Fig. 1 Schematic representation of the designed nanoprobe for detection of miRNA-21 based on the PRET system. | ||
2. Experimental section
2.1. Materials and reagents
The DNA and RNA sequences were prepared in Shanghai Biological Engineering Co., Ltd. (China). The details are showed in Table S1.† Mn–ZnS QDs were prepared from MPA (J&K Chemical Co Ltd., China), Mn(Ac)2·4H2O, Zn(Ac)2·2H2O and Na2S·9H2O (all Tianjin Kemiou Chemical Reagent Co., Ltd.). Serum sample was purchased from Chongqing Manuik Technology Co. Ltd. (China). All solutions were prepared in ultrapure water (18.2 MΩ cm), which was generated by a WaterPro ultrapure water instrument (Labconco, US).2.2. Instruments
The morphological structures of the QDs were studied on a JEM-2100 transmission electron microscope (TEM, JEOL Ltd. Japan). RTP was detected by a Cary Eclipse fluorescent spectrophotometer (Varian Co. Ltd, US). Other instruments included a UV-29100 UV/Vis spectrophotometer (Shimadzu, Japan) and a pH meter (Shanghai Lei-ci Co., Ltd, China).2.3. Synthesis of Mn–ZnS QDs
Mn–ZnS QDs were prepared as reported before.29–31 First, a 250 mL three-necked bottles was added with 10 mL of 0.1 mol L−1 Zn(Ac)2, 4 mL of 0.01 mol L−1 Mn(Ac)2 and 100 mL of 0.04 mol L−1 MPA. The mixture was adjusted to pH 11 by adding a 1 mol L−1 NaOH solution, and then magnetically stirred for 30 min at room temperature and argon ventilation. Then the tube was injected with 10 mL of 0.1 mol L−1 Na2S under air isolation, and ventilated with argon gas for 20 min. After ageing in air for 2 hours, the resulting solution was kept at 50 °C to form MPA-capped Mn–ZnS QDs. Then a same volume of ethanol was added to precipitate the QDs. The resulting solution was centrifuged, washed with ethanol, and dried in a vacuum oven for 24 h, forming powder Mn–ZnS QDs.2.4. Synthesis of QDs+
Then 5 mg of Mn–ZnS QD powder was dissolved in appropriate amount of ultrapure water. The new solution was diluted by 100 μL of PDADMAC to 10 mL (0.35 wt%, pH 7.4), evenly shaken and placed still for 10 min. Afterwards, an equal volume of anhydrous ethanol was added. The new solution was shaken evenly and centrifuged. Then the supernatant was discarded to remove the remaining PDADMAC (repeated three times). Finally, the resulting solution was diluted into 5 mL of ultrapure water to form a Mn–ZnS QD/PDADMAC (QDs+) nanocomposite solution (1 mg mL−1, calculated as per Mn–ZnS QDs).2.5. Procedures of experiment
To study the effects of ROX-DNA on the RTP intensity of QDs+, we first prepared a 1.0 μM ROX-DNA aqueous solution and then added 50 μL of the QDs+ solution to a phosphate buffer solution (PBS, pH 7.4, 0.20 M). Then a series of ROX-DNA solutions at different concentrations were prepared by adding different volumes of ROX-DNA solution. All resulting solutions were diluted to 5 mL, shaken evenly for 30 min, and the RTP at the excitation wavelength 295 nm was measured. To detect the target RNA, first we dissolved the target RNA in ultrapure water, forming a 1 μM RNA solution. Then to 10 mL colorimetric tubes, 500 μL of PBS, 500 μL of 1 M NaCl, 50 μL of 1 mg mL−1 Mn–ZnS QDs+ and 200 μL of 1 μM ROX-DNA were added. The tubes were shaken evenly and placed still for 5 min, forming a series of QDs+/ROX-DNA probes. Then different concentrations of the target miRNA21 sequence (8–80 nM) were added. The resulting mixtures were diluted to 5 mL by adding ultrapure water, shaken evenly and placed still at 37 °C for 30 min. Then RTP at 295 nm was determined. Each experiment was repeated three times.2.6. Sample pretreatment
Serum samples were diluted by 100 times, without any other pretreatment.2.7. Sample detection
To each of 10 mL colorimetric tubes, 500 μL of PBS (pH 7.4, 0.2 M), 500 μL of 1 M NaCl, 50 μL of 1 mg mL−1 Mn–ZnS QDs+ and 200 μL of 1 μM ROX-DNA were added. The tubes were shaken evenly and placed still for 5 min. After addition of different concentrations of miRNA21, the resulting mixtures were all diluted to 5 mL by adding ultrapure water, shaken evenly and placed still at 37 °C for 30 min. Then RTP at 295 nm was determined. Each experiment was conducted in triplicate. Owing to the absence of miRNA21 in the serum samples, we validated the performance of these probes in detecting the miRNA21 in body fluids by using spiked recovery trials (spiked amounts were 10 and 50 nM). The samples were diluted 100 times, without any other pretreatment.3. Results and discussion
3.1. Characterization of the MPA-capped Mn-doped ZnS QDs and QDs+
The MPA-capped Mn–ZnS QDs prepared here had the largest emission peak at 590 nm (Fig. S1A†). This RTP was attributed to the transition of Mn2+ 4T1–6A1.32 The excitation light was absorbed by the ZnS matrix to excite its electrons. The holes as-formed captured Mn2+, which interacted with the electrons and holes separately to form composites, leading to the excitation of Mn2+ and the energy release in the form of RTP (about 590 nm).21 The shape and size of the QDs were characterized by TEM, which showed the diameter was about 3.5 nm (Fig. S1B†). The diameter of Mn-doped ZnS QDs was calculated by eqn (1).33| D = 9.8127 × 10⁻⁷λ3 − 1.7147 × 10⁻³λ2 + 1.0064λ − 194.84 | (1) |
3.2. Spectral properties of Mn–ZnS QDs+, ROX-DNA, and QDs
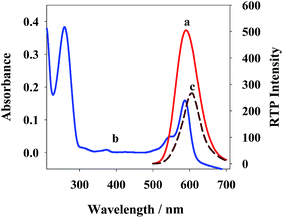
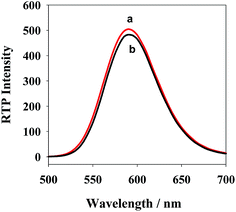
The phosphorescent emission spectrum (curve a) of QDs+ and the ultraviolet absorption spectrum (curve b) of ROX-DNA are showed in Fig. 2. Clearly, QDs+ has an emission peak at 590, which is largely overlapped with the maximum absorption peak of ROX-DNA at 587. Thus, efficient PRET occurred between QDs+ (the energy donor) and ROX-DNA (the energy receptor), which reduced the phosphorescent intensity of QDs+ (curve c). Moreover, after being stored in a refrigerator at 4 °C for 1 month, the new QDs+ only had a 5.3% reduction of phosphorescent intensity, which proves its high optical stability (Fig. S2†).At room temperature, the negatively-charged QDs on surfaces in the pH 7.4 PBS, and the positively-charged PDADMAC aggregated via electrostatic interaction to form positively-charged QDs+. As showed in Fig. 3, the emission spectra of QDs+ and QDs are similarly-shaped, except that QDs+ has a slightly higher phosphorescence intensity. The possible reason is that PDADMAC can simultaneously bind multiple QDs, which shortens some of the between-dot distances. TEM (Fig. S3†) also proves the occurrence of obvious dot aggregation. The electron–hole-caused surface defects in QDs will produce a local electric field.34,35 Since the reduced between-dot distances would enhance the local electric field around the QDs and stimulate more-effective excitation from the QDs,36,37 more energy was released from the surface holes of the QDs to Mn2+, which considerably improved the RTP intensity of the QDs.20,38 In comparison, the radiation center of Mn2+ located in ZnS crystal lattices, and thereby the relative positions of the excitation and emission spectra, were generally not affected.39
3.3. Interaction between QDs+ and ROX-DNA
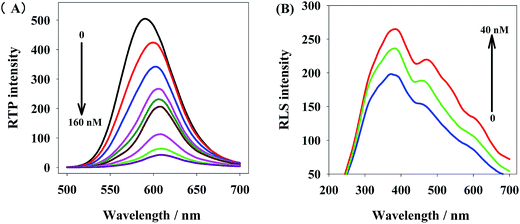
Thus, miRNA21 detection could be realized by a phosphorescent probe that was based on the static adsorption between QDs+ and ROX-DNA. With the increase of ROX-DNA concentration, the electrostatic interaction shortened the distance between QDs+ and ROX-DNA and gradually weakened the RTP of QDs+, accompanied by red shift. This is because the phosphorescence emission spectrum of QDs+ was partially overlapped with the absorption spectrum of ROX-DNA (Fig. 4).When two substances interactively aggregate to form scattering particles, they irradiate significant resonance light scattering (RLS) signals. Fig. 4B shows how the RLS signals of QDs+ changed after the addition of ROX-DNA. The RLS intensity was gradually improved by the slow addition of ROX-DNA, indicating QDs+ and ROX-DNA had formed larger nanoparticles. This is because the capping of PDADMAC atop the QDs endowed the QDs with positive charge (QDs+), while the presence of DNA strands made ROX-DNA negatively-charged in weak base solutions (pH 7.4). Thus, QDs+ and ROX-DNA could electrostatically interact to form larger QDs+/ROX-DNA nanocomposites.
3.4. Mechanism of ROX-DNA quenching QDs+
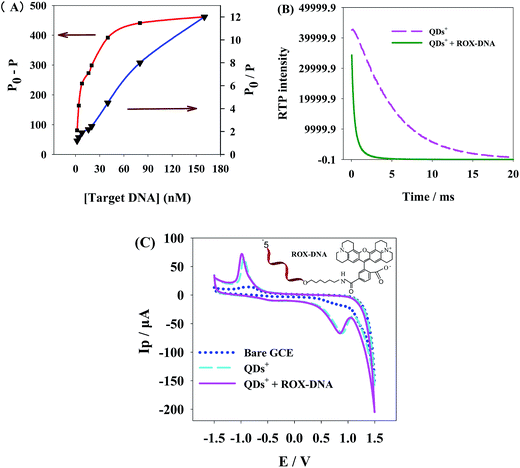
Phosphorescent quenching is either dynamic or static. During dynamic quenching, the interaction between the excited state molecules of the quencher and the phosphorescent substance leads to a reduction of phosphorescent intensity. This process obeys a Stern–Volmer equation (eqn (2)). During static quenching, the phosphorescent intensity is reduced by the coordination at the ground state between the quencher and the phosphorescent substance that results in the formation of un-luminous coordination compounds. This process obeys a Lineweaver–Burk double-reciprocal equation (eqn (3)):40,41| P0/P = 1 + KSVCq | (2) |
| 1/(P0 − P) = 1/P0 + KLB/(P0Cq) | (3) |
The interaction between ROX-DNA and QDs+ was further explored by investigating the phosphorescence lifetime. Fig. 5B shows the phosphorescence lifetime of QDs+, and QDs+ + ROX-DNA. Results show after capping by PDADMAC, the phosphorescent lifetime of QDs+ was 4.9 ms, but after the addition of ROX-DNA, it was shortened to 0.8 ms, which indicates the occurrence of dynamic quenching between QDs+ and ROX-DNA.
To validate that the interaction between QDs+ and ROX-DNA was PRET rather than electron transfer, we studied the electrochemical properties of this interaction. As showed in Fig. 5C, the oxidation reducing peaks of QDs+ and QDs+ + ROX-DNA are basically overlapped, so we think only PRET, rather than electron transfer, has occurred. It is probably because the electron transfer depends more on the longer donor–receptor distance, compared with that needed by PRET.45 The DNA end of ROX-DNA carried strong negative charge, which shortened the distance between QDs+ and ROX-DNA, but the positively-charged N+ at the ROX end mutually repelled QDs+, which enlarged that distance. Consequently, PRET occurred between the ROX end and the QDs+, but the distance to induce electron transfer was not large enough.
3.5. QDs+/ROX-DNA nanoprobe detecting target RNA sequences
Fig. 6A illustrates the miRNA21 detection by the QDs+/ROX-DNA probes. The addition of different concentrations of miRNA21 gradually restored the RTP intensities of these probes in the range of 0–80 nM, indicating these RTP probes are feasible for miRNA21 detection. Based on the above results, we designed QDs+/ROX-DNA RTP nanoprobes for miRNA21 detection. At pH 7.4, the change of RTP intensity of the QDs+/ROX-DNA nanoprobe (P/P0) is linearly associated with the miRNA21 concentration within a certain range (Fig. 6B).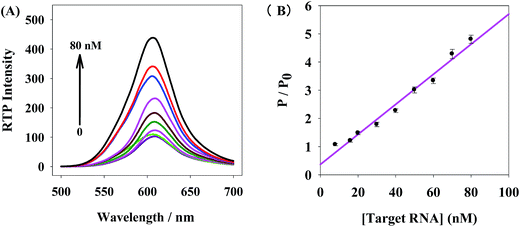 | ||
| Fig. 6 (A) Target RNA concentration-dependent RTP emission of nanoprobe, (B) dose–response calibration curve for target RNA based on the nanoprobe. | ||
This RTP probes had a linear range of 8–80 nM in miRNA-21 detection, and the linear equation is: P/P0 = 0.053CRNA + 0.367 (R = 0.989), with a detection limit (3σ) of 1.60 nM. The solutions without target RNA or with 18 nM miRNA21 were continuously detected for 11 times, and the relative standard deviation (RSD) was 3.4%. The RTP intensity of this system was maintained relatively stable within 60 min (Fig. S4.†). This method is superior that it takes advantage of RTP properties of QDs and utilizes PRET to detect specific sequence RNA, so it is not disturbed by the background scattering light or fluorescence from biological fluids, and even eliminates complex pretreatment. This method is feasible for detection of miRNA-21 and biomedical specific RNA.
3.6. Selectivity of target RNA RTP probe
We selected some metal ions and biomolecules commonly present in biological fluids and studied their impacts on the miRNA21 probes. With the presence of 50 nM miRNA21, the RTP was not significantly affected by the 6000-fold dosage of K+, 10![[thin space (1/6-em)]](https://www.rsc.org/images/entities/char_2009.gif) 000-fold dosage of Na+, 1000-fold dosage of Ca2+, 2000-fold dosage of Mg2+, 800-fold dosage of glucose, 300-fold dosage of L-cysteine (L-Cys), 300-fold dosage of L-histidine (L-His), or 300-fold dosage of L-glycin (L-Gly) (Table S2†). Since the miRNA21 concentration in the biological samples was far beyond the detection limit of 1.60 nM, the interferences from common metal ions and biomolecules could be avoided by dilution.
000-fold dosage of Na+, 1000-fold dosage of Ca2+, 2000-fold dosage of Mg2+, 800-fold dosage of glucose, 300-fold dosage of L-cysteine (L-Cys), 300-fold dosage of L-histidine (L-His), or 300-fold dosage of L-glycin (L-Gly) (Table S2†). Since the miRNA21 concentration in the biological samples was far beyond the detection limit of 1.60 nM, the interferences from common metal ions and biomolecules could be avoided by dilution.
3.7. Characterization of QDs-DNA as RTP probes
To validate the performance of the new probes, we added 60 nM miRNA21, 60 nM mismatched RNA or 60 nM random RNA, and found the phosphorescent intensity of QDs+ was reduced by 47.2%, 20.4% and 13.1%, respectively (Fig. 7). It is indicated that the new QD probes could effectively detect miRNA21 compared with mismatched or random sequences. | ||
| Fig. 7 Normalized spectra of RTP emission of QDs+/ROX-DNA (a), QDs+/ROX-DNA + random RNA (b), QDs+/ROX-DNA + mismatch RNA (c) and QDs+/ROX-DNA + target RNA (d) excited at 295 nm. | ||
3.8. Sample analysis
To further validate whether the new QDs+/ROX-DNA RTP nanoprobes were feasible for miRNA21 detection in human serum, we conducted spiked recycled experiments with human serum and found the miRNA21 concentrations were 10 and 50 nM, with spiked recycle rates of 97–105% (Table 1). The extracts were diluted by 100 times, without any other pretreatment.| Type of samples (%) | Target RNA spiked (nM) | Recovery |
|---|---|---|
| Human serum | 10 | 97 ± 6 |
| 50 | 105 ± 2 |
4. Conclusions
In this study, we built a novel phosphorescence miRNA-21 sequence sensor, based on the phosphorescent resonance energy transfer between QDs+ and ROX-DNA, and used it to quantitatively detect the miRNA-21 sequence in biological fluids. This probe had a detection limit of 1.60 nM and a detection range of 8–80 nM on miRNA21. This system is based on the RTP of QDs, thus eliminates the use of deoxidant or other complex pretreatment and avoids the interferences from background fluorescence and scattering light in the biological fluids. Therefore, this system is especially feasible for miRNA21 detection in biological samples, which makes the miRNA-21 detection in biological fluids more simple, cheap and practical.Conflicts of interest
There are no conflicts to declare.Acknowledgements
This work was supported by the funds of the Natural Science Foundation for Young Scientists of Shanxi Province (201601D021109) and Construction Program of Chemical Advantage and Key discipline of Shanxi Province of China (912019).References
- D. Sidransky, Science, 1997, 278, 1054–1058 CrossRef CAS PubMed.
- H. D. Hill and C. A. Mirkin, Nat. Protoc., 2006, 1, 324–336 CrossRef CAS PubMed.
- D. P. Bartel, Cell, 2004, 116, 281–297 CrossRef CAS PubMed.
- G. A. Calin and C. M. Croce, Nat. Rev. Cancer, 2006, 6, 857–866 CrossRef CAS PubMed.
- L. M. Moore and W. Zhang, Expert Opin. Ther. Targets, 2010, 14, 1247–1257 CrossRef CAS PubMed.
- S. D. Selcuklu, M. T. A. Donoghue and C. Spillane, Biochem. Soc. Trans., 2009, 37, 918–925 CrossRef CAS PubMed.
- A. M. Krichevsky and G. Gabriely, J. Cell. Mol. Med., 2009, 13, 39–53 CrossRef CAS PubMed.
- P. P. Medina, M. Nolde and F. J. Slack, Nature, 2010, 467, 86–90 CrossRef CAS PubMed.
- R. Shi and V. L. Chiang, Biotechniques, 2005, 39, 519–525 CrossRef CAS PubMed.
- E. Varallyay, J. Burgyan and Z. Havelda, Nat. Protoc., 2008, 3, 190–196 CrossRef CAS PubMed.
- Y. Wen, H. Pei, Y. Shen, J. Xi, M. Lin, N. Lu, X. Shen, J. Li and C. Fan, Sci. Rep., 2012, 2, 867 CrossRef PubMed.
- H. Yin, Y. Zhou, H. Zhang, X. Meng and S. Ai, Biosens. Bioelectron., 2012, 33, 247–253 CrossRef CAS PubMed.
- L. P. Lim, N. C. Lau, P. Garrett-Engele, A. Grimson, J. M. Schelter, J. Castle, D. P. Bartel, P. S. Linsley and J. M. Johnson, Nature, 2005, 433, 769–773 CrossRef CAS PubMed.
- J. L. Abell, J. M. Garren, J. D. Driskell, R. A. Tripp and Y. Zhao, J. Am. Chem. Soc., 2012, 134, 12889–12892 CrossRef CAS PubMed.
- J. M. Costa-Fernández, R. Pereiro and A. Sanz-Medel, TrAC, Trends Anal. Chem., 2006, 25, 207–218 CrossRef.
- Y. He, H.-F. Wang and X.-P. Yan, Anal. Chem., 2008, 80, 3832–3837 CrossRef CAS PubMed.
- P. Wu, Y. He, H.-F. Wang and X.-P. Yan, Anal. Chem., 2010, 82, 1427–1433 CrossRef CAS PubMed.
- J. M. Traviesa-Alvarez, I. Sánchez-Barragán, J. M. Costa-Fernández, R. Pereiro and A. Sanz-Medel, Analyst, 2007, 132, 218–223 RSC.
- E. Sotelo-Gonzalez, M. T. Fernandez-Argüelles, J. M. Costa-Fernandez and A. Sanz-Medel, Anal. Chim. Acta, 2012, 712, 120–126 CrossRef CAS PubMed.
- Y. He, H.-F. Wang and X.-P. Yan, Chemistry, 2009, 15, 5436–5440 CrossRef CAS PubMed.
- R. Thakar, Y. Chen and P. T. Snee, Nano Lett., 2007, 7, 3429–3432 CrossRef CAS PubMed.
- H.-F. Wang, Y. He, T.-R. Ji and X.-P. Yan, Anal. Chem., 2009, 81, 1615–1621 CrossRef CAS PubMed.
- Y. Miao, Z. Zhang, Y. Gong, Q. Zhang and G. Yan, Biosens. Bioelectron., 2014, 52, 271–276 CrossRef CAS PubMed.
- Y. Miao, RSC Adv., 2015, 5, 76804–76812 RSC.
- Y. Miao, Sensing and Bio-Sensing Research, 2015, 5, 112–116 CrossRef.
- Y. Li, Y.-M. Miao, M.-Q. Yang, Y.-X. Wu and G.-Q. Yan, Chin. Chem. Lett., 2016, 27, 773–778 CrossRef CAS.
- Y. Miao, J. Lv, Y. Li and G. Yan, RSC Adv., 2016, 6, 109009–109022 RSC.
- Y. Miao, M. Yang and G. Yan, RSC Adv., 2016, 6, 8588–8593 RSC.
- Y. Miao, Y. Li, Z. Zhang, G. Yan and Y. Bi, Anal. Biochem., 2015, 475, 32–39 CrossRef CAS PubMed.
- Y. Miao, Z. Zhang, Y. Gong and G. Yan, Biosens. Bioelectron., 2014, 59, 300–306 CrossRef CAS PubMed.
- J. Lv, Y. Miao, J. Yang, J. Qin, D. Li and G. Yan, Biosens. Bioelectron., 2017, 91, 560–565 CrossRef CAS PubMed.
- I. Yildiz, M. Tomasulo and F. M. Raymo, Proc. Natl. Acad. Sci. U. S. A., 2006, 103, 11457–11460 CrossRef CAS PubMed.
- P. R. Fortes, C. Frigerio, C. I. C. Silvestre, J. L. M. Santos, J. F. C. Lima and E. A. G. Zagatto, Talanta, 2011, 84, 1314–1317 CrossRef CAS PubMed.
- D. J. Norris, A. Sacra, C. B. Murray and M. G. Bawendi, Phys. Rev. Lett., 1994, 72, 2612–2615 CrossRef CAS PubMed.
- V. I. Klimov, J. Phys. Chem. B, 2000, 104, 6112–6123 CrossRef CAS.
- O. Kulakovich, N. Strekal, A. Yaroshevich, S. Maskevich, S. Gaponenko, I. Nabiev, U. Woggon and M. Artemyev, Nano Lett., 2002, 2, 1449–1452 CrossRef CAS.
- P. Anger, P. Bharadwaj and L. Novotny, Phys. Rev. Lett., 2006, 96, 113002 CrossRef PubMed.
- Y. Hou, J. Ye, Z. Gui and G. Zhang, Langmuir, 2008, 24, 9682–9685 CrossRef CAS PubMed.
- W. U. Huynh, J. J. Dittmer and A. P. Alivisatos, Science, 2002, 295, 2425–2427 CrossRef CAS PubMed.
- J. R. Lakowicz and G. Weber, Biochemistry, 1973, 12, 4161–4170 CrossRef CAS PubMed.
- K. Sauer, H. Scheer and P. Sauer, Photochem. Photobiol., 1987, 46, 427–440 CrossRef CAS.
- R. M. Jones, T. S. Bergstedt, D. W. McBranch and D. G. Whitten, J. Am. Chem. Soc., 2001, 123, 6726–6727 CrossRef CAS PubMed.
- C. B. Murphy, Y. Zhang, T. Troxler, V. Ferry, J. J. Martin and W. E. Jones, J. Phys. Chem. B, 2004, 108, 1537–1543 CrossRef CAS.
- M. S. Baptista and G. L. Indig, J. Phys. Chem. B, 1998, 102, 4678–4688 CrossRef CAS.
- M. D. Newton, Chem. Rev., 1991, 91, 767–792 CrossRef CAS.
Footnote |
| † Electronic supplementary information (ESI) available. See DOI: 10.1039/c7ra04521b |
| This journal is © The Royal Society of Chemistry 2017 |

