 Open Access Article
Synthesis of quinolines from aniline and propanol over modified USY zeolite: catalytic performance and mechanism evaluated by in situ Fourier transform infrared spectroscopy
Chen Huang,
An Li ,
Li-Jun Li and
Zi-Sheng Chao
 *
*
College of Chemistry and Chemical Engineering, Hunan University, Changsha, 410082, China. E-mail: chao_zs@aliyun.com; zschao@yahoo.com; Fax: +86-731-88713257; Tel: +86-731-88713257
First published on 10th May 2017
Abstract
The reaction of aniline and propanol to quinolines was conducted in a fixed-bed flow-type reactor, using a series of modified USY zeolite catalysts. The structural, textural and acidic properties of the catalyst were characterized by XRD, N2-physisorption, 27Al MAS NMR, NH3-TPD and pyridine-FTIR, while the mechanism for the reaction of aniline and propanol was investigated by in situ FTIR. It was identified that the reaction of aniline and propanol generated predominantly quinolines, including 2-ethyl-3-methylquinoline and other alkyl quinoline, N-alkyl aniline and other byproducts. Among others, the ZnCl2/Ni-USY catalyst exhibited the best performance, providing a 96.4% conversion of aniline and a 78.3% total yield of quinolines with 81.2% total selectivity to quinolines and 60.1% selectivity to 2-ethyl-3-methylquinoline at 683 K. This was attributed to the larger concentration ratio of Lewis acid sites to Bronsted acid sites over the ZnCl2/Ni-USY catalyst, relative to other catalysts. There were predominantly two possible routes for the formation of quinolines, which required predominantly Lewis acid sites and Bronsted acid sites, respectively. In both the routes, N-phenylpropan-1-imine was proposed as the key intermediate. Relative to that based on Bronsted acid sites, the route based on Lewis acid sites appeared to contribute much more in the generation of quinolines from the reaction of aniline and propanol.
1. Introduction
Quinolines including quinoline and its derivatives, as a group of most valuable heterocycle compounds, are widely found in natural products.1–4 Many quinolines are reported to possess biological activities, such as antimicrobial, antifungal, anti-malarial and anti-neoplastic,5 and they have been broadly applied in pharmaceuticals, insecticidal agents and functional chemicals like dyestuffs and ligands in agriculture.6 Therefore, the production of quinolines is of significant importance.Quinolines were first produced via extraction from coal tar. However, this process was associated with many problems, e.g., low production (ca. only 0.3–0.5 content of quinolines in coal car), high energy input and large environmental pollution. Therefore, the chemical synthesis of quinolines is receiving more and more attention. Several traditional methods for the synthesis of quinolines have been reported in the literature,7 and they can be classified predominantly into three groups. The first group is mainly composed of the Skraup, Combes, Doebner–Miller and Combes–Limpach methods.8 These methods involve the reaction between aniline and a compound containing α,β-unsaturated carbonyl or β-diketone unit, using homogeneous Lewis or Bronsted acid catalyst, such as SnCl4, Sc(OTf)3, p-toluenesulfonic acid, perchloric acid and sulphuric acid. The product can be quinoline, 2-alkylquinoline or 2,4-dialkylquinoline, dependent on the carbonyl-containing reactant. The reaction mechanism consists of the nucleophilic attack of the amino group at the active carbon atom in either carbonyl group or unsaturated bond, the cyclization occurs between carbonyl group and ortho-position of aniline, and then, the oxide hydrogenation to generate the quinoline structure. The presence of an electron-attracting active group, such as halogen atom, phenyl, carboxyl and alkoxy, in the reactant promotes further the formation of the quinoline structure. The second group is mainly composed of the Friedländer, Camps, Niementowski and Pfitzinger methods.9 These methods are based on the reaction between an ortho-substituted aniline or nitrobenzene, in which the substitute group can be acyl, formyl, hydromethyl, halomethyl, trifloromethyl, cyano, vinyl, acetylene or allyl, and a carbonyl compound containing active α-methylene group, generating multi-substituted quinolines. Homogeneous catalysts, such as, transition metal chlorides, inorganic/organic acids and alkalines, organometal agents, noble metal coordination complexes, are usually employed in these reactions. The reaction mechanism comprises the nucleophilic attack of amino at the carbonyl carbon in another reactant to generate imine structure, the nucleophilic attack of carbon in imine structure at the ortho-carbonyl carbon in benzene cycle, and then the dehydration to generate quinoline structure. Besides the aniline and carbonyl compounds involved in the above two group methods, other starting materials are also employed in the synthesis of quinolines, constituting the third group method for the synthesis of quinolines. For examples, an o-acylaminoacetophenone was directly transformed into two different hydroxyquinolines, using hydroxide ion as catalyst.10 Cho et al.11 reported the synthesis of quinolines via the RuCl3·nH2O/SnCl2·2H2O catalyzed reaction of aniline and trialkylamine, involving the formation of Schiff-base structure as a key intermediate. All the above traditional methods have been based on the liquid phase reaction using homogeneous catalyst, and they are generally suffered from many drawbacks, such as the expensive or toxic feedstock, the anhydrous and tedious work-up procedure, the volatile organic solvent, the corrosive, costly and hard recyclable catalyst, the unsatisfied yield and selectivity to aimed product, and the prolonged reaction time. Contrastively, the synthesis of quinolines in gas phase reaction basing on heterogeneous catalyst can overcome most of the above problems and thus is receiving more and more attentions.8–14
A few heterogeneous catalysts for the gas phase synthesis of quinolines have been reported in the literature, and they can be classified mainly into three groups: (I) non-zeolitic solid acid catalysts,9–14 such as amorphous Si–Al, inorganic acid-loaded Kaolin, acidic metal salt or oxide-modified amorphous Si–Al and Kaolin. They can catalyze the reaction between aniline and aldehyde or glycol into quinoline and 2-alkylquinoline at ca. 40–60% yield.13 Most of the reports indicate that both the Bronsted and Lewis acid sites in the catalyst are favorable to the formation of quinolines, with the Lewis acid site contributing relatively less;8 however, some reports also show that the presence of Lewis acid site retards the formation of quinolines.14 Therefore, the role of acid site is still uncertain; (II) mixed metal oxide catalysts,8,12,13 including mainly ZnO–Cr2O3, CuO–ZnO/Al2O3, MoO–V2O5/Al2O3 and NiO–MoO3/Al2O3. They can catalyze the reaction between aniline and glycerol in the presence of oxygen to generate quinoline, however, the yield of quinoline is relatively low, usually below 40%, due to its deep oxidation by oxygen.13 The acid property of catalyst is found to show a promotion on the formation of quinoline.15 (III) Zeolite catalysts, including mainly MOR, FER, MFI and BEA. They can catalyze the reaction of aniline and aldehyde to quinoline, 2- and 4-methylquinolines at ca. 50–80% yield.12–14 Among these zeolites, BEA is reported to exhibit the largest catalytic effect, and the addition of NH4F promotes further the yields of quinolines.14 This can be ascribed to the delamination by NH4F to generate the extra-framework Al species, increasing the ratio of Lewis/Bronsted acid sites and reducing the total acid concentration.14 It can be seen that, among all the above heterogeneous catalysts, zeolites have exhibited the largest activity for the generation of quinolines. This may be due to the facts that zeolites usually possess an adjustable and controllable acid performance, which is pivotal to the formation of quinolines, while BEA among various zeolites has a relatively larger pore size, being comparable to the molecular sizes of quinolines so as to provide a favorable shape-selective catalysis effect.
Y zeolite has a similar larger pore size as BEA zeolite, however, the former is relatively cheaper than the latter. Compared to carbonyl-containing compounds, propanol is inexpensive, greener and more available. In this paper, we report for the first time the synthesis of quinolines from the gas phase reaction of aniline and propanol basing on modified ultra-stabilized Y (USY) zeolite catalyst. The effects of modifier, reaction temperature and space velocity on the catalytic performance are investigated, while the structural property of catalyst is identified by means of XRD, BET, 27Al MAS NMR and FTIR. Particularly, the adsorptions of aniline and propanol and the reaction of the two over the surface of catalyst are studied by in situ FTIR, and this enables us to propose the mechanism for the reaction of aniline and propanol to quinolines over modified USY zeolite catalyst.
2. Experimental
2.1 Chemicals
All the chemicals for the synthesis of quinolines and the preparation of catalyst were purchased from commercial companies and had purities higher than 99%. These chemicals were used as received, without further purification.USY (Si/Al = 10) zeolite powder (SINOPEC Catalyst Co. LTD., Changling Division) was calcined at 550 °C for 8 h, before being used.
2.2 Preparation of catalyst
2.3 Characterization of catalyst
X-ray diffraction spectroscopy (XRD) was performed with a Bruker D8-Advance X-ray diffractometer. The operation conditions were as follows: Cu target Kα ray (λ = 1.54187 Å); scanning voltage 40 kV, scanning current 40 mA; scanning speed 0.2 s, scanning step 0.02°.N2-physisorption was performed at liquid nitrogen temperature using a Quantachrome Autosorb-1 instrument. Before the measurement, the specimen was degassed for 16 h at 573 K under a vacuum of 4 × 10⁻⁴ Pa.
NH3 temperature programmed desorption (NH3-TPD) was determined on a Micromeritics AutoChem II 2920 instrument equipped with a thermal conductivity detector (TCD). The specimen was first degassed in a flow of helium with a flow rate of 50 mL min−1 at 773 K for 30 min, followed by cooling to 373 K. Then, NH3 was repeatedly pulse-injected until a saturation adsorption over the specimen had been achieved. After that, NH3 was desorbed by heating the specimen from 373 to 1023 K at a rate of 15 K min−1. During the adsorption and desorption of NH3, the helium flow was retained and its flow rate was maintained constant at 60 mL min−1.
The Ni and Zn contents of catalysts were determined over a Varian 240AA atomic absorption spectrometer. The operation conditions: sample aspiration rate = 3.0 mL min−1; lamp current = 3.0 mA; slit width = 0.2 nm; air flow rate = 0.8 mL min−1 and acetylene flow rate = 5.0 mL min−1.
27Al magic angle spinning Nuclear Magnetic Resonance spectroscopy (27Al MAS NMR) was conducted over a Bruker AVANCEIII (400 MHz) spectrometer at room temperature. The operation conditions were as follows: sample spinning rate = 12 kHz; pulse width = 1.0 μs; recycling delay = 500 ms; resonance frequency = 130.32 MHz.
2.4 Evaluation of catalytic performance
Catalytic performance test was carried out in a fixed-bed tubular quartz reactor (i.d. 6 mm, total length 400 mm) at atmospheric pressure. The catalyst (2.0 g) was located in the middle of reactor, with the upper space of catalyst bed in the reactor being filled with quartz granulates (30 meshes). The reactor was electronically heated, and the temperature was monitored by a thermocouple that contacted tightly with the outer wall of reactor in the zone containing catalyst. A homogeneous solution consisting of aniline and n-propanol (1![[thin space (1/6-em)]](https://www.rsc.org/images/entities/char_2009.gif) :
:![[thin space (1/6-em)]](https://www.rsc.org/images/entities/char_2009.gif) 2 molar ratio) was employed as the reactant. At first, the catalyst was in situ pretreated at a certain reaction temperature ranging from 623 to 713 K for 1 hour in a flow of carrier gas (H2 or air) with a preset gas hourly space velocity of 300–900 h−1 (GHSV). Then, the reactant was pumped at a liquid hourly space velocity (LHSV) of 0.6 to 1.9 h−1, passing through an evaporator heated at 573 K, into the reactor, while the flow of carrier gas was maintained. After the reaction had been run stably for 2 h, the effluent from the reactor was cooled by a condenser at ice-water temperature to collect the products mixture.
2 molar ratio) was employed as the reactant. At first, the catalyst was in situ pretreated at a certain reaction temperature ranging from 623 to 713 K for 1 hour in a flow of carrier gas (H2 or air) with a preset gas hourly space velocity of 300–900 h−1 (GHSV). Then, the reactant was pumped at a liquid hourly space velocity (LHSV) of 0.6 to 1.9 h−1, passing through an evaporator heated at 573 K, into the reactor, while the flow of carrier gas was maintained. After the reaction had been run stably for 2 h, the effluent from the reactor was cooled by a condenser at ice-water temperature to collect the products mixture.
The analysis of products mixture was conducted over a Varian CP-3800/Saturn 2200 gas chromatograph-mass spectrometer (GC-MS). Two CP8944 capillary columns (30 m × 0.25 mm × 0.25 μm) were respectively connected to mass detector and flame ionization detector (FID) for the quantitative and qualitative analyses. Basing on the converted aniline, the conversion of aniline (χ), selectivity to component i (Si) and yield of quinolines (YQS) were respectively calculated as follows:
| YQS (%) = χ × SQS × 100, |
The carbon balance (Yc), basing on aniline, for the reaction between aniline and propanol was approximately evaluated as follows:
2.5 In situ Fourier transform infrared (FTIR) spectroscopy
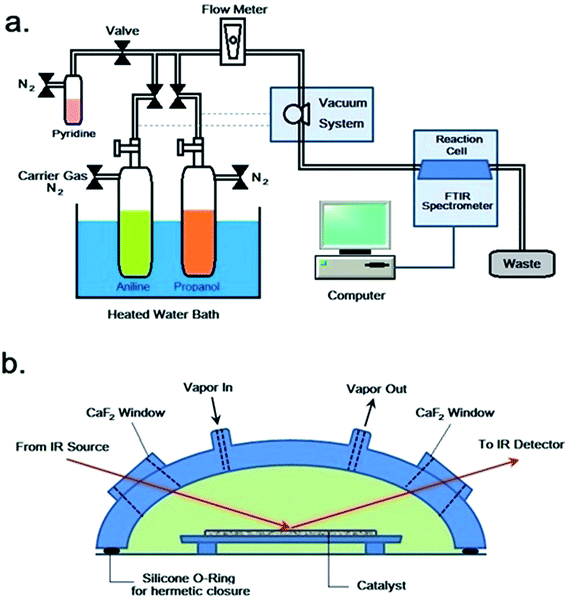
The in situ FTIR spectroscopic study was conducted on a set of home-made reaction system, which was schematically illustrated in Fig. 1a. The reaction system consisted of feeding, vacuum, reaction cell and FT-IR monitoring units. The reaction cell (Varian company, model HVC-DRP), possessing a volume of ca. 4 mL, consisted of a cover and a pedestal (Fig. 1b), which were sealed together by silicone O-ring and mounting nuts. The cover contained two 10 × 10 × 2 mm CaF2 windows and two gas flow vents. The pedestal possessed a recessed region for the loading of catalyst, and it could be heated by a temperature controller. The reaction cell was mounted in the specimen chamber of a Varian 3100 FTIR spectrometer equipped with a MCT detector and CeI beamsplitter. The feed, either pyridine or aniline and/or propanol, was charged into a pre-evacuated vessel (10−3 Pa), of which the temperature (ca. 298–773 K) was regulated by a preheater. At first, a catalyst (ca. 0.1 g) was loaded in the reaction cell and evacuated to (10−3 Pa) at 773 K for 4 h. After that, the catalyst was cooled to room temperature, and then, the vapor of feed was carried by a flow of nitrogen (ca. 200 mL min−1), regulated by needle valve and monitored by flowmeter, into the reaction cell. The reaction was thus carried out at various preset temperature points and for various periods of time, while FTIR spectra were recorded from 400 to 4000 cm−1 at a scanning number of 32 and a resolution of 4 cm−1.3. Results and discussion
3.1 Catalytic performance test
Table 1 shows the results for the reaction of aniline and n-propanol over various catalysts. One can see that, over all the catalysts, 2-ethyl-3-methylquinoline (2E-3MQ) as the predominant quinolines and 2,3-dimethylquinoline (2,3-DMQ), 2-ethylquinoline (2-EQ) and 2-methyl quinoline (2-MQ) as the minor ones are generated. Theoretically, one molecular 2E-3MQ can be generated from tow molecular propanol. Accordingly, the other quinolines apart from 2E-3MQ, including 1,3-DMQ, 2-EQ and 2-MQ, should have been predominantly generated via the dissociation of 2E-3MQ. Besides quinolines, the byproducts including N-propylaniline (NPA) as the main component and N,N-dipropylaniline (DNPA), 2-propylaniline, 4-propylaniline and 3-methylindole as the minor ones are also identified. The byproducts other than the N-alkylaniline (NPA and DNPA) are also arbitrarily named as “others”, being listed in Table 1. These byproducts are generated respectively via the alkylation of aniline by propanol on the amino group and benzene ring and the cyclization between aniline and a certain intermediate related to propanol. All the conversion of aniline, total selectivity to quinolines and selectivity to 2E-3MQ as well as the total yield of quinolines over various catalysts (entries 1–5 in Table 1) show an order ZnCl2/Ni-USY > Ni-USY > Ni/USY > USY, while the selectivity to NPA displays the reverse order to the above. This can be a result of the variations in the textural and acidic properties for these catalysts, which is discussed in the following section. The above result also hints that NPA may have originated from a certain important intermediate (N-phenylpropan-1-imine; see in Section 3.4), which also leads to the formation of quinolines during the reaction of aniline and propanol.11 Over the ZnCl2/Ni-USY catalyst, the conversion of aniline, total selectivity to quinolines and selectivity to 2E-3MQ as well as the total yield of quinolines are all increased but the selectivity to NPA decreased with increasing the reaction temperature from 623 K to 683 K (cf. entries 4 and 5 in Table 1). The further studies on the effect of reaction temperature (Fig. 2) shows that, with increasing the reaction temperature in the range of 623 K to 703 K, the conversion of aniline increases all through, however, both the total selectivity to quinolines and the yield of quinolines increase first, achieving their maxima at 683 K, and then decrease. At the optimized temperature (683 K), a 96.4% conversion of aniline with a 78.3% total yield of quinolines at 60.1% selectivity to 2E-3MQ and 81.2% total selectivity to quinolines have been achieved over the ZnCl2/Ni-USY catalyst. When the carrier gas H2 is replaced by air (cf. entries 5 and 6 in Table 1), the conversion of aniline, total selectivity to quinolines and selectivity to 2E-3MQ as well as the total yield of quinolines are all decreased but the selectivity to NPA increased. It shows that the employment of H2 as carrier gas is more favorable over air carrier gas for the reaction of aniline and propanol to quinolines. This is due to the fact that the formation of quinolines involves the cyclization–aromatization over the low-valent metal active site, which can be generated and stabilized in the reductive atmosphere but not the oxidative one. Therefore, H2 has been employed as the carrier gas in the subsequent experiments.| Entry | Catalyst | Temp (K) | Carrier gas | χb (%) | Sic (%) | SQSd (%) | YQSe (%) | ||||||||||||||||||||||||||||||||||||||||||||||||||||||||||||||||||||||||||||||||||||||||||||
|---|---|---|---|---|---|---|---|---|---|---|---|---|---|---|---|---|---|---|---|---|---|---|---|---|---|---|---|---|---|---|---|---|---|---|---|---|---|---|---|---|---|---|---|---|---|---|---|---|---|---|---|---|---|---|---|---|---|---|---|---|---|---|---|---|---|---|---|---|---|---|---|---|---|---|---|---|---|---|---|---|---|---|---|---|---|---|---|---|---|---|---|---|---|---|---|---|---|---|---|
| 2E-3MQf | 2,3-DMQg | 2-EQh | 2-MQi | NPAj | DNPAk | Othersl | |||||||||||||||||||||||||||||||||||||||||||||||||||||||||||||||||||||||||||||||||||||||||||||
| a Catalyst weight = 2.0 g; carrier gas GHSV = 300 h−1; feed LHSV = 0.8 h−1.b χ: conversion of aniline.c Si: selectivity to component i in products mixture.d SQS: total selectivity to quinolines in products mixture.e YQS: total yield of quinolines in products mixture.f 2E-3MQ: 2-ethyl-3-methylquinoline.g 2,3-DMQ: 2,3-dimethylquinoline.h 2-EQ: 2-ethylquinoline.i 2-MQ: 2-methyl quinoline.j NPA: N-propylaniline.k DNPA: N,N-dipropylaniline.l Others: 2-propylaniline, 4-propylaniline and 3-methylindole. | |||||||||||||||||||||||||||||||||||||||||||||||||||||||||||||||||||||||||||||||||||||||||||||||||||
| 1 | USY | 623 | H2 | 57.8 | 34.6 | 9.2 | 2.1 | 2.6 | 40.8 | 2.3 | 8.4 | 48.5 | 28.0 | ||||||||||||||||||||||||||||||||||||||||||||||||||||||||||||||||||||||||||||||||||||||
| 2 | Ni/USY | 623 | H2 | 61.2 | 37.6 | 9.2 | 1.7 | 1.4 | 39.3 | 5.2 | 5.6 | 49.9 | 30.5 | ||||||||||||||||||||||||||||||||||||||||||||||||||||||||||||||||||||||||||||||||||||||
| 3 | Ni-USY | 623 | H2 | 66.7 | 42.3 | 10.1 | 1.8 | 1.1 | 39.5 | 2.1 | 3.1 | 55.3 | 36.8 | ||||||||||||||||||||||||||||||||||||||||||||||||||||||||||||||||||||||||||||||||||||||
| 4 | ZnCl2/Ni-USY | 623 | H2 | 87.2 | 47.4 | 13.3 | 0.2 | 0 | 26.4 | 2.9 | 9.8 | 60.9 | 53.1 | ||||||||||||||||||||||||||||||||||||||||||||||||||||||||||||||||||||||||||||||||||||||
| 5 | ZnCl2/Ni-USY | 683 | H2 | 96.4 | 60.1 | 20.7 | 0.4 | 0 | 9.8 | 3.4 | 5.6 | 81.2 | 78.3 | ||||||||||||||||||||||||||||||||||||||||||||||||||||||||||||||||||||||||||||||||||||||
| 6 | ZnCl2/Ni-USY | 683 | Air | 85.3 | 52.9 | 14.2 | 0 | 0 | 23.5 | 3.9 | 5.5 | 67.1 | 57.2 | ||||||||||||||||||||||||||||||||||||||||||||||||||||||||||||||||||||||||||||||||||||||
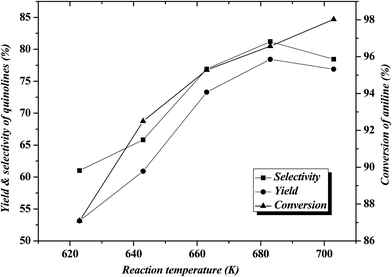 | ||
| Fig. 2 Effect of reaction temperature on the reaction of aniline and propanol over ZnCl2/Ni-USY catalyst (2 g catalyst, H2 carrier gas GHSV = 300 h−1, feed LHSV = 0.8 h−1). | ||
Table 2 shows the effect of carrier gas GHSV and products mixture LHSV on the reaction of aniline and propanol over various catalysts. One can see that, over all the catalysts, with increasing both the carrier gas GHSV and products mixture LHSV, the conversion of aniline and yield of quinolines as well as the selectivities to quinolines and “others” are all decreased, however, both the selectivities to N-alkylaniline (NPA and DNPA) and the carbon balance are increased. This is due to the fact that the generation of quinolines and “others” can be a result of the further conversion of the important intermediate related to N-alkylaniline (N-phenylpropan-1-imine; see in Section 3.4). The increase in the carrier gas GHSV and products mixture LHSV removes quickly N-alkylaniline from the catalyst bed and thus decreases largely the chance for the further conversion of the important intermediate, being related to N-alkylaniline, into quinolines and “others”, and it also reduces the secondary reaction of various products and byproducts, e.g., pyrolysis, so as to increase the carbon balance.
| Catalyst | GHSV (h−1) | Ffb (h−1) | Fpc (h−1) | χd (%) | Sie (%) | SQSf (%) | YQSg (%) | Ych (%) | |||||||||||||||||||||||||||||||||||||||||||||||||||||||||||||||||||||||||||||||||||||||||||
|---|---|---|---|---|---|---|---|---|---|---|---|---|---|---|---|---|---|---|---|---|---|---|---|---|---|---|---|---|---|---|---|---|---|---|---|---|---|---|---|---|---|---|---|---|---|---|---|---|---|---|---|---|---|---|---|---|---|---|---|---|---|---|---|---|---|---|---|---|---|---|---|---|---|---|---|---|---|---|---|---|---|---|---|---|---|---|---|---|---|---|---|---|---|---|---|---|---|---|---|
| 2E-3MQi | 2,3-DMQj | 2-EQk | 2-MQl | NPAm | DNPAn | Otherso | |||||||||||||||||||||||||||||||||||||||||||||||||||||||||||||||||||||||||||||||||||||||||||||
| a Catalyst weight = 2.0 g; reaction temperature = 623 K; carrier gas = H2.b Ff: the flow rate of feed (LHSV).c Fp: the flow rate of products mixture (LHSV).d χ: conversion of aniline.e Si: selectivity to component i in products mixture.f SQS: total selectivity to quinolines in products mixture.g YQS: total yield of quinolines in products mixture.h Yc: carbon balance.i 2E-3MQ: 2-ethyl-3-methylquinoline.j 2,3-DMQ: 2,3-dimethylquinoline.k 2-EQ: 2-ethylquinoline.l 2-MQ: 2-methyl quinoline.m NPA: N-propylaniline.n DNPA: N,N-dipropylaniline.o Others: 2-propylaniline, 4-propylaniline and 3-methylindole. | |||||||||||||||||||||||||||||||||||||||||||||||||||||||||||||||||||||||||||||||||||||||||||||||||||
| USY | 300 | 0.673 | 0.558 | 57.8 | 34.6 | 9.2 | 2.1 | 2.6 | 40.8 | 2.3 | 8.4 | 48.5 | 28.0 | 82.9 | |||||||||||||||||||||||||||||||||||||||||||||||||||||||||||||||||||||||||||||||||||||
| 600 | 1.26 | 1.09 | 56.4 | 33.7 | 8.7 | 1.9 | 2.1 | 43.2 | 2.4 | 8 | 46.4 | 26.2 | 86.7 | ||||||||||||||||||||||||||||||||||||||||||||||||||||||||||||||||||||||||||||||||||||||
| 900 | 1.79 | 1.60 | 53.2 | 32.5 | 7.7 | 1.8 | 1.8 | 46.1 | 2.7 | 7.4 | 43.8 | 23.3 | 89.7 | ||||||||||||||||||||||||||||||||||||||||||||||||||||||||||||||||||||||||||||||||||||||
| Ni-USY | 300 | 0.631 | 0.525 | 66.7 | 42.3 | 10.1 | 1.8 | 1.1 | 39.5 | 2.1 | 3.1 | 53.3 | 35.6 | 83.3 | |||||||||||||||||||||||||||||||||||||||||||||||||||||||||||||||||||||||||||||||||||||
| 600 | 1 | 1.07 | 64.3 | 39.5 | 9.7 | 1.6 | 1.1 | 42.2 | 2.4 | 3.5 | 51.9 | 33.4 | 86.9 | ||||||||||||||||||||||||||||||||||||||||||||||||||||||||||||||||||||||||||||||||||||||
| 900 | 1.81 | 1.66 | 63.1 | 37.2 | 9.6 | 1.5 | 1.0 | 44.9 | 3.0 | 2.8 | 49.3 | 31.1 | 91.6 | ||||||||||||||||||||||||||||||||||||||||||||||||||||||||||||||||||||||||||||||||||||||
| Zn/Ni-USY | 300 | 0.676 | 0.599 | 87.2 | 47.4 | 13.3 | 0.2 | 0 | 26.4 | 2.9 | 9.8 | 60.9 | 53.1 | 88.6 | |||||||||||||||||||||||||||||||||||||||||||||||||||||||||||||||||||||||||||||||||||||
| 600 | 1.31 | 1.21 | 85.3 | 45.6 | 12.5 | 0 | 0 | 29.7 | 3.1 | 9.1 | 58.1 | 49.6 | 92.5 | ||||||||||||||||||||||||||||||||||||||||||||||||||||||||||||||||||||||||||||||||||||||
| 900 | 1.88 | 1.80 | 82.6 | 43.3 | 11.9 | 0 | 0 | 32.6 | 3.4 | 8.8 | 55.2 | 45.6 | 95.5 | ||||||||||||||||||||||||||||||||||||||||||||||||||||||||||||||||||||||||||||||||||||||
3.2 Catalyst characterization
Fig. 3 shows the XRD patterns for various catalysts. One can see that all the XRD patterns of various catalysts exhibit the characteristic diffraction peaks of USY zeolite, being very similar to each other, while the diffraction peak intensities for various catalysts shows an order ZnCl2/Ni-USY < Ni-USY < USY. Besides, the enlargement of XRD pattern shows that the diffraction peaks have shifted towards high angle direction over the modified USY catalyst, particularly over the ZnCl2/Ni-USY catalyst, relative to the USY catalyst. The above result indicates that, while the basic structure of USY zeolite is remained, the partial dealumination of zeolite framework and thus its destruction to some extent is also present during the modification of USY zeolite.16 This would affect the textural and acid properties and in turn the catalytic performance of modified USY catalyst.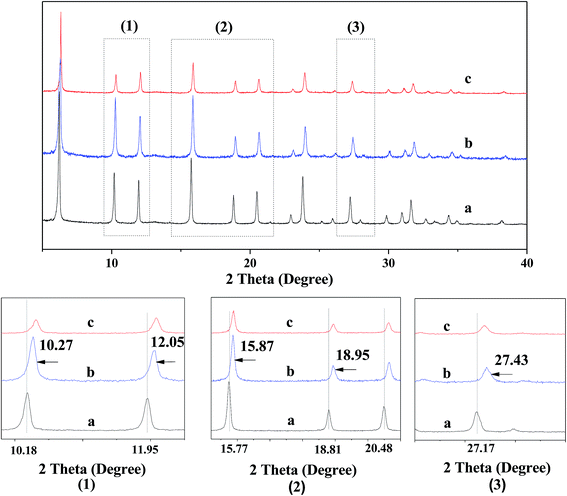 | ||
| Fig. 3 XRD patterns for various catalysts. The bottom patterns marked by (1)–(3) are the enlargements of the areas marked in the upper patterns. (a) USY; (b) Ni-USY; (c) ZnCl2/Ni-USY. | ||
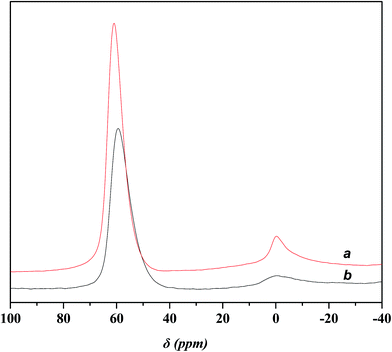
Fig. 4 displays the 27Al MAS NMR spectra of USY and Ni-USY zeolite catalysts. One can see that two peaks at ca. δ = 0 and 60 ppm are present over both the USY and Ni-USY catalysts, which can be respectively ascribed to the 6-coordinate extra-framework aluminum and 4-coordinate framework aluminum.17,18 The intensities for the two peaks decrease obviously over the Ni-USY catalyst, relative to the USY catalyst. It indicates that the nickel ion exchange leads to not only the removal of a proportion of extra-framework aluminum in zeolite but also the partial dealumination of zeolite framework.
Table 3 shows the textural properties determined by N2-physisorption over various catalysts. One can see that the specific surface area (SBET), micropore surface area (Smicro), micropore volume (Vmicro) and total pore volume (Vtotal) are all smaller over the Ni/USY catalyst than over the USY catalyst. This may be due to the fact that, during the preparation of Ni/USY catalyst via the deposition–precipitation method, a proportion of nickel species are deposited in the micropores of USY zeolite, decreasing the microporosity of Ni/USY catalyst. Compared to the USY catalyst, both the SBET and Smicro decrease slightly and both the Vmicro and Vtotal increase over the Ni-USY catalyst. It may be due to the fact that a certain amount of extra-framework aluminum species has been enwrapped in the micropores of USY catalyst during its preparation; besides, an additional amount of extra-framework aluminum species is also generated via the partial dealumination of zeolite framework during the nickel ion exchange, resulting in, to some extent, the destruction of zeolite structure.19 Both the above extra-framework aluminum species have been removed by water washing during the preparation of Ni-USY catalyst. This enables the Ni-USY catalyst to possess a slightly lower surface area but higher pore volume. Compared to the Ni/USY catalyst, the SBET, Smicro, Vmicro and Vtotal are all larger over the USY catalyst. It indicates that the nickel ions possesses a higher dispersion degree in the Ni-USY catalyst than in the Ni/USY catalyst.
| Catalyst | SBET (m2 g−1) | Smicro (m2 g−1) | Vmicro (cm3 g−1) | Vtotal (cm3 g−1) | |||||||||||||||||||||||||||||||||||||||||||||||||||||||||||||||||||||||||||||||||||||||||||||||
|---|---|---|---|---|---|---|---|---|---|---|---|---|---|---|---|---|---|---|---|---|---|---|---|---|---|---|---|---|---|---|---|---|---|---|---|---|---|---|---|---|---|---|---|---|---|---|---|---|---|---|---|---|---|---|---|---|---|---|---|---|---|---|---|---|---|---|---|---|---|---|---|---|---|---|---|---|---|---|---|---|---|---|---|---|---|---|---|---|---|---|---|---|---|---|---|---|---|---|---|
| a Note: SBET and Smicro refer to specific surface area and micropore surface area and Vmicro and Vtotal to micropore pore volume and total pore volume, respectively. | |||||||||||||||||||||||||||||||||||||||||||||||||||||||||||||||||||||||||||||||||||||||||||||||||||
| USY | 718 | 635 | 0.32 | 0.41 | |||||||||||||||||||||||||||||||||||||||||||||||||||||||||||||||||||||||||||||||||||||||||||||||
| Ni/USY | 554 | 476 | 0.25 | 0.38 | |||||||||||||||||||||||||||||||||||||||||||||||||||||||||||||||||||||||||||||||||||||||||||||||
| Ni-USY | 705 | 623 | 0.34 | 0.47 | |||||||||||||||||||||||||||||||||||||||||||||||||||||||||||||||||||||||||||||||||||||||||||||||
Fig. 5 shows the in situ FTIR spectra for the pyridine adsorption over various catalysts. Three peak at ca. 1450, 1490 and 1538 cm−1, respectively, are identified over all the catalysts. The peaks 1450 and 1538 cm−1 are ascribed to the pyridine adsorptions on the Lewis and Bronsted acid sites, respectively, while the peak at 1490 cm−1 is usually related to the cooperative adsorption of pyridine over the Lewis and Bronsted acid sites.20 It is known that the Bronsted acid sites are related to the protons in bridging Si–OH–Al groups and the Lewis acid sites to the unsaturated surface cations (extra-framework aluminum) or charge-compensating cations Mn+ like transition metal ions.21 The area ratio of the peak at 1450 cm−1 to that at 1538 cm−1, i.e., the concentration ratio of Lewis acid sites to Bronsted acid sites, is calculated to be 0.79, 0.95 and 1.03 for the USY, Ni-USY and ZnCl2/Ni-USY catalysts, respectively, indicating the sequential increase in the concentration of Lewis acid sites for the modification of USY by nickel ion exchange and ZnCl2 loading. This can be due to the fact that, for the Ni-USY catalyst, the nickel ion exchange leads to not only the removal of extra-framework aluminum but also the partial dealumination of zeolite framework, therefore decreasing both the concentrations of Lewis and Bronsted acid sites; however, the nickel ions exchanged onto the USY zeolite can behave as Lewis acid sites, and this enables the concentration ratio of Lewis acid sites to Bronsted acid sites to be higher over the Ni-USY catalyst than over the USY catalyst. For the ZnCl2/Ni-USY, the introduction of zinc ions provides additional Lewis acid sites and thus increases further the concentration ratio of Lewis acid sites to Bronsted acid sites, relative to Ni-USY. In fact, it had been reported that the ZnCl2 modified zeolite catalysts employed in the Friedel–Crafts alkylation reactions could provide more Lewis acid sites than the transition metal modified zeolite catalysts.22,23
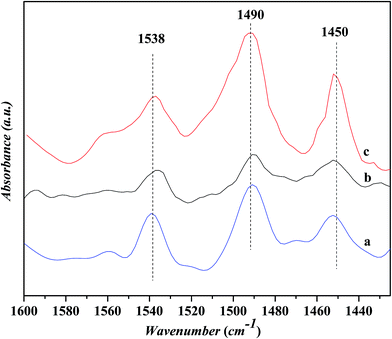 | ||
| Fig. 5 In situ FTIR spectra for the pyridine adsorption on various catalysts. (a) USY, (b) Ni-USY and (c) ZnCl2/Ni-USY. | ||
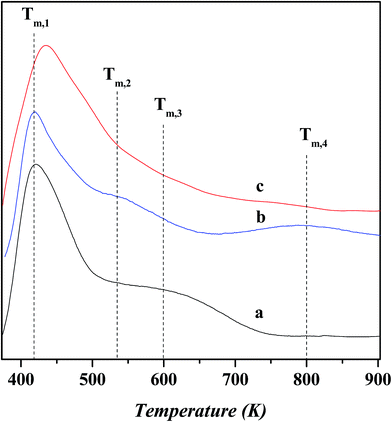
Fig. 6 shows the NH3-TPD profiles for various catalysts. The temperature at the maximum (Tm,i) and integral area (Ai) of desorption peak, which correspond respectively to the strength and concentration of acid sites, are summarized in Table 4. The peaks over these desorption profiles can be approximately classified into three groups, i.e., the low-temperature (<500 K; Tm,1), medium-temperature (500–700 K; Tm,2 and Tm,3) and high-temperature (>700 K; Tm,4) peaks, which corresponds to the weak, moderate and strong acid sites, respectively. The Tm,1 peak has a desorption temperature centered at ca. 420–433 K over all the catalysts, and its area decreases slightly after nickel exchange and ZnCl2 loading. This peak can be ascribed to the weak acidic terminal silanol group.24 Over the USY catalyst, the desorption temperature and integral area for the Tm,2 peak are determined as ca. 533 K and 0.59 and those for the Tm,3 peak as ca. 600 K and 0.79, respectively. It is known that the extra-framework Al species behave as Lewis acid sites and possess a weaker strength than the bridged hydroxyl groups (Si–OH–Al) as Bronsted acid sites in Y zeolite.25,26 Therefore, the Tm,2 peak can be attributed to the moderate Lewis acid sites associated with the extra-framework Al species and the Tm,3 peak to the moderate Bronsted acid sites associated with the Si–OH–Al groups. Compared to the USY catalyst, the area of Tm,2 peak increases slightly and that of Tm,3 decreases obviously over the Ni-USY catalyst. This is due to the facts that, during the nickel ion exchange, the protons of Si–OH–Al groups are replaced with nickel ions, and also, there exist the partial dealumination of framework, decreasing the concentration of Bronsted acid sites. The nickel ion exchange also leads to the removal of a proportion of extra-framework aluminum, as has been proved by the above characterizations of 27Al MAS NMR and N2-physisorption, and this should have decreased the area of Tm,2 peak; however, nickel ions possess also the Lewis acid property and their exchange onto the USY zeolite provides an additional amount of Lewis acid site, and this counteracts the above loss of Lewis acid sites via the removal of extra-framework aluminum and therefore increases slightly the area of Tm,2 peak. Besides, as has been pointed out above, the area of Tm,1 peak is decreased after the nickel exchange. It is deduced that a proportion of nickel ions may have interacted with some terminal silanol groups, and under the inducement of nickel ions, the silanol groups are activated to exhibit, to some extent, a characteristic of moderate Bronsted acid site and the nickel ions themselves behave as Lewis acid sites. Nevertheless, this process contributes less to the relative concentrations of Bronsted and Lewis acid sites over the Ni-USY and USY catalysts. Compared to the USY catalyst, a new peak with desorption temperature centered at ca. 800 K, namely Tm,4, also appears over the Ni-USY catalyst. This can be due to the fact that the nickel ions possess a strong electric field so as to induce an abnormally high acid strength of adjacent Si–OH–Al groups. Therefore, the Tm,4 peak is attributed to the strong Bronsted acid sites originating from some un-exchanged Si–OH–Al groups with nickel ions in the vicinity.27 Compared to the Ni-USY catalyst, the area of Tm,2 peak increases and that of Tm,3 peak decreases, while the Tm,4 peak disappears over the ZnCl2/Ni-USY catalyst. It was reported that ZnCl2 could reacted with the surface hydroxyl groups of Mont-K 10 clay to form the Lewis acid sites (–O–Zn–Cl) by the thermal activation.13 Accordingly, the surface bridged hydroxyl groups (Si–OH–Al) over the Ni-USY-acid catalyst can also react with ZnCl2, generating the –O–Zn–Cl Lewis acid sites. This accounts for the changes for the Tm,2 to Tm,4 peaks over the over the ZnCl2/Ni-USY catalyst, relative to the Ni-USY catalyst. Because of the lower electronegativity of Zn2+ than Al3+, the –O–Zn–Cl Lewis acid sites are expected to possess a smaller acid strength, i.e., lower desorption temperature, than the Lewis acid sites associated the extra-framework Al. Therefore, the Tm,2 peak over the ZnCl2/Ni-USY catalyst is related to the –O–Zn–Cl weak Lewis acid sites. As a whole, the modifications of USY via nickel ion exchange and ZnCl2 loading, decreases both the total concentration of acid sites and Bronsted acid sites but increases the concentration of Lewis acid sites sequentially.
| Catalyst | Tm,ia (K) and Aib (mmol g−1) for various desorption peaks | ||||||||||||||||||||||||||||||||||||||||||||||||||||||||||||||||||||||||||||||||||||||||||||||||||
|---|---|---|---|---|---|---|---|---|---|---|---|---|---|---|---|---|---|---|---|---|---|---|---|---|---|---|---|---|---|---|---|---|---|---|---|---|---|---|---|---|---|---|---|---|---|---|---|---|---|---|---|---|---|---|---|---|---|---|---|---|---|---|---|---|---|---|---|---|---|---|---|---|---|---|---|---|---|---|---|---|---|---|---|---|---|---|---|---|---|---|---|---|---|---|---|---|---|---|---|
| Tm,1 | A1 | Tm,2 | A2 | Tm,3 | A3 | Tm,4 | A4 | ∑Ai | |||||||||||||||||||||||||||||||||||||||||||||||||||||||||||||||||||||||||||||||||||||||||||
| a Tm,i refers to the temperature at the maximum of desorption peak i.b Ai refers to the integral area of desorption peak i, and it also corresponds to the concentration of acid site manifested by the desorption peak. | |||||||||||||||||||||||||||||||||||||||||||||||||||||||||||||||||||||||||||||||||||||||||||||||||||
| USY | 420 | 2.62 | 533 | 0.59 | 600 | 0.79 | — | 4.00 | |||||||||||||||||||||||||||||||||||||||||||||||||||||||||||||||||||||||||||||||||||||||||||
| Ni-USY | 422 | 2.50 | 533 | 0.67 | 600 | 0.18 | 800 | 0.54 | 3.89 | ||||||||||||||||||||||||||||||||||||||||||||||||||||||||||||||||||||||||||||||||||||||||||
| ZnCl2/Ni-USY | 433 | 2.56 | 533 | 0.80 | 600 | 0.16 | — | 3.52 | |||||||||||||||||||||||||||||||||||||||||||||||||||||||||||||||||||||||||||||||||||||||||||
3.3 In situ FTIR studies on the reaction of aniline and propanol
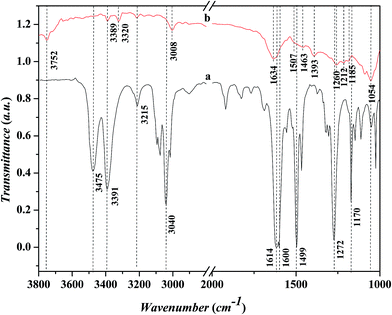
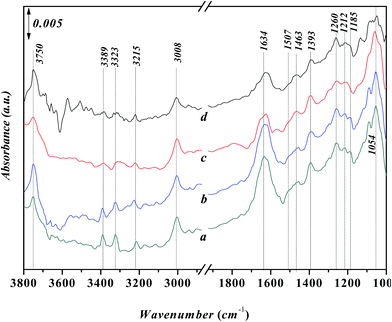
Fig. 7 shows the FTIR spectra in the range of 1000–3800 cm−1 for the adsorbed aniline on the Ni-USY catalyst and the free aniline (NIST standard reference data). The Ni-USY catalyst is first heated at 773 K for 4 h under 2 × 10⁻⁴ Pa, followed by cooling to 293 K, and then, exposed to a flow of aniline vapor and nitrogen at 293 K. The free aniline exhibits mainly the peaks for the N–H stretching vibrations at ca. 3475 and 3391 cm−1, the![[double bond, length as m-dash]](https://www.rsc.org/images/entities/char_e001.gif) C–H stretching vibration of benzene ring at ca. 3040 cm−1, the N–H bending vibration at ca. 1614 cm−1, the benzene ring stretching vibrations at ca. 1600 and 1499 cm−1, the C–N stretching vibration at ca. 1272 cm−1 and the
C–H stretching vibration of benzene ring at ca. 3040 cm−1, the N–H bending vibration at ca. 1614 cm−1, the benzene ring stretching vibrations at ca. 1600 and 1499 cm−1, the C–N stretching vibration at ca. 1272 cm−1 and the ![[double bond, length as m-dash]](https://www.rsc.org/images/entities/char_e001.gif) C–H bending vibrations of benzene ring at ca. 1170 cm−1.28 Compared to the free aniline, all the above peaks shift toward low frequencies over the adsorbed aniline and they appear at ca. 3389 and 3320 cm−1 for the N–H stretching vibrations, ca. 3008 cm−1 for the
C–H bending vibrations of benzene ring at ca. 1170 cm−1.28 Compared to the free aniline, all the above peaks shift toward low frequencies over the adsorbed aniline and they appear at ca. 3389 and 3320 cm−1 for the N–H stretching vibrations, ca. 3008 cm−1 for the ![[double bond, length as m-dash]](https://www.rsc.org/images/entities/char_e001.gif) C–H stretching vibration of benzene ring, ca. 1507 cm−1 for the N–H bending vibration, ca. 1463 and 1393 cm−1 for the benzene ring stretching vibrations, and ca. 1260 cm−1 for the C–N stretching vibration and ca. 1054 cm−1 for the
C–H stretching vibration of benzene ring, ca. 1507 cm−1 for the N–H bending vibration, ca. 1463 and 1393 cm−1 for the benzene ring stretching vibrations, and ca. 1260 cm−1 for the C–N stretching vibration and ca. 1054 cm−1 for the ![[double bond, length as m-dash]](https://www.rsc.org/images/entities/char_e001.gif) C–H bending vibrations of benzene ring, respectively. As is known, aniline is an aromatic organic base, consisting of benzyl and amino groups. This enables that aniline can either accept a proton from Bronsted acid to form an ammonium (Ph-NH3+) or donor a pair of electrons to Lewis acid (usually coordination-unsaturated metal ion Mn+) to form an adduct Ph-NH2 → Mn+. It was also reported29 that aniline can interact with Lewis acid through the π-electrons of aromatic ring, since the coupling between the unshared electron pair of NH2 group and the conjugated electrons of aromatic ring increases the electron density of benzene ring but decreases that of nitrogen atom.30 Besides, aniline can interact with a hydroxyl group via hydrogen bond to form an association complex Ph-H2NH⋯OH. All the above interactions between aniline and acid weaken the related chemical bonds in aniline, e.g., N–H, C–N and
C–H bending vibrations of benzene ring, respectively. As is known, aniline is an aromatic organic base, consisting of benzyl and amino groups. This enables that aniline can either accept a proton from Bronsted acid to form an ammonium (Ph-NH3+) or donor a pair of electrons to Lewis acid (usually coordination-unsaturated metal ion Mn+) to form an adduct Ph-NH2 → Mn+. It was also reported29 that aniline can interact with Lewis acid through the π-electrons of aromatic ring, since the coupling between the unshared electron pair of NH2 group and the conjugated electrons of aromatic ring increases the electron density of benzene ring but decreases that of nitrogen atom.30 Besides, aniline can interact with a hydroxyl group via hydrogen bond to form an association complex Ph-H2NH⋯OH. All the above interactions between aniline and acid weaken the related chemical bonds in aniline, e.g., N–H, C–N and ![[double bond, length as m-dash]](https://www.rsc.org/images/entities/char_e001.gif) C–H, and thus decrease the vibration frequencies of those chemicals bonds.31 Besides, the above peak at ca. 3008 cm−1 and a new peak at ca. 1634 cm−1 can be assigned to the N–H stretching and bending vibrations of anilinic cation.30,31 It should be addressed that there is also a peak at ca. 3215 cm−1 for both the free and absorbed aniline and the peaks at ca. 3752 cm−1 and ca. 1185–1212 cm−1 for the adsorbed aniline. The former peak is assigned to the overtone band of benzene ring stretching vibration (ca. 1600 cm−1), while the latter two peaks are due to the stretching vibrations of terminal silanol and T–O tetrahedron (T = Si and/or Al) in USY zeolite.31 As is known, the peak for the terminal silanol of zeolite usually appears at ca. 3740 cm−1. Therefore, the slightly higher wavenumber of the terminal silanol (3752 cm−1) observed in this work may be due to the interaction between the proton of amino and the oxygen of terminal silanol group on zeolite, which strengthens the H–O bond of silanol group.
C–H, and thus decrease the vibration frequencies of those chemicals bonds.31 Besides, the above peak at ca. 3008 cm−1 and a new peak at ca. 1634 cm−1 can be assigned to the N–H stretching and bending vibrations of anilinic cation.30,31 It should be addressed that there is also a peak at ca. 3215 cm−1 for both the free and absorbed aniline and the peaks at ca. 3752 cm−1 and ca. 1185–1212 cm−1 for the adsorbed aniline. The former peak is assigned to the overtone band of benzene ring stretching vibration (ca. 1600 cm−1), while the latter two peaks are due to the stretching vibrations of terminal silanol and T–O tetrahedron (T = Si and/or Al) in USY zeolite.31 As is known, the peak for the terminal silanol of zeolite usually appears at ca. 3740 cm−1. Therefore, the slightly higher wavenumber of the terminal silanol (3752 cm−1) observed in this work may be due to the interaction between the proton of amino and the oxygen of terminal silanol group on zeolite, which strengthens the H–O bond of silanol group.
Fig. 8 shows in situ FT-IR spectra for the adsorption of aniline on the Ni-USY catalyst at various temperatures. Before determination, the Ni-USY is first heated at 773 K for 4 h under 2 × 10⁻⁴ Pa, followed by cooling to 293 K, and then, exposed to a flow of aniline vapor and nitrogen at 293–393 K. One can see that the above peaks for the adsorbed aniline in Fig. 7 are all present, and with increasing the temperature, they decrease in the strength. In any way, this result indicates that the adsorption of aniline on the Ni-USY catalyst is appreciably stable, which is of importance for the activation and thus conversion of aniline to quinolines.
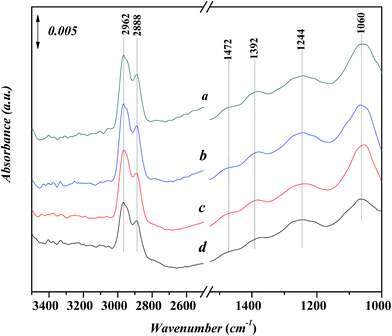
Fig. 9 shows in situ FT-IR spectra for the adsorption of n-propanol on Ni-USY catalyst. The catalyst is first heated at 773 K for 4 h under 2 × 10⁻⁴ Pa, followed by cooling to 293 K, and then, exposed to a flow of aniline vapor and nitrogen at 293–393 K. All the spectra show the characteristic adsorption peaks,32 which are the stretching vibration of hydroxyl group at ca. 3506 cm−1, the stretching vibrations of CHx group at 2890–2962 cm−1, the bending vibrations of CHx group at ca. 1472 and 1244 cm−1, the bending vibration of hydroxyl group at ca. 1392 cm−1 and the stretching vibration of C–O group at ca. 1060 cm−1, respectively. The peak at ca. 1220 cm−1 can be assigned to stretching vibration of T–O tetrahedron (T = Si and/or Al) in USY zeolite.28,33 With increasing the temperature, not only the wavenumber but also the intensity of the peaks is almost unchanged. It shows that n-propanol has an only very weak interaction with the Ni-USY catalyst.
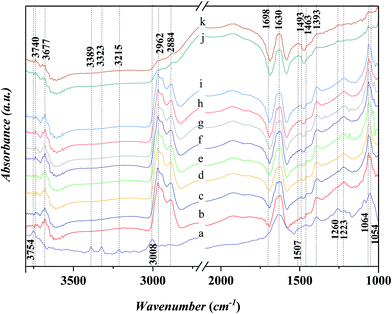
Fig. 10 shows the in situ FT-IR spectra for the adsorption of n-propanol after the adsorption of aniline on Ni-USY catalyst. Before determination, Ni-USY is first heated at 773 K for 4 h under 2 × 10⁻⁴ Pa, followed by cooling to 293 K, and then, exposed to a flow of aniline vapor and nitrogen at 293 K for 2 h. After that, the Ni-USY is exposed to a flow of propanol vapor and nitrogen at 373–413 K for 3 min and at 423 K for 3–20 min, respectively. One can see that, compared to the aniline-adsorbed Ni-USY (Fig. 10a), after the adsorption of propanol at 373 K for 3 min (Fig. 10b), the peaks at ca. 3389 and 3323 cm−1 for the N–H stretching vibrations of aniline disappear and those at ca. 3008 and 1054 cm−1 for the stretching and bending vibrations of ![[double bond, length as m-dash]](https://www.rsc.org/images/entities/char_e001.gif) C–H in benzene ring become obviously weaken due to the presence of the adjacent strong peaks, while the peaks at ca. 1463 and 1393 cm−1 for the stretching vibration of benzene ring remain. Besides, the characteristic peaks of propanol at 2884–2962 cm−1 for the stretching vibrations of CHx group and 1064 cm−1 for the stretching vibration of C–O group as well as a peak at ca. 1698 cm−1 for the vibration of carbonyl32 appear, while those at 1472 and 1244 cm−1 for the bending vibrations of CHx group and 1392 cm−1 for the bending vibration of hydroxyl group may have been covered by the adjacent peaks for aniline. It is also noted that the peak at ca. 1634 cm−1 for the N–H vibration of aniline anion shifts to ca. 1630 cm−1, which is assigned to the stretching vibration of C
C–H in benzene ring become obviously weaken due to the presence of the adjacent strong peaks, while the peaks at ca. 1463 and 1393 cm−1 for the stretching vibration of benzene ring remain. Besides, the characteristic peaks of propanol at 2884–2962 cm−1 for the stretching vibrations of CHx group and 1064 cm−1 for the stretching vibration of C–O group as well as a peak at ca. 1698 cm−1 for the vibration of carbonyl32 appear, while those at 1472 and 1244 cm−1 for the bending vibrations of CHx group and 1392 cm−1 for the bending vibration of hydroxyl group may have been covered by the adjacent peaks for aniline. It is also noted that the peak at ca. 1634 cm−1 for the N–H vibration of aniline anion shifts to ca. 1630 cm−1, which is assigned to the stretching vibration of C![[double bond, length as m-dash]](https://www.rsc.org/images/entities/char_e001.gif) N group.34 The 1260 cm−1 for the C–N stretching vibration of aniline shifts to ca. 1223 cm−1, which can be assigned to C–N–C group.28 The similar peak position for the C–N–C group and T–O tetragon leads to the obviously higher intensity for the 1223 cm−1 peak after the adsorption of propanol over the aniline-adsorbed Ni-USY. The peak at 3754 cm−1 due to the interaction between aniline and terminal silanol shifts to ca. 3740 cm−1, which is the characteristic peak for the free terminal silanol, while a new peak at 3677 cm−1, being assigned to the bridged hydroxyl group (Si–OH–Al) of zeolite, appears. The above results indicate that there is the reaction between the propanol and adsorbed aniline molecule, and this leads to the replacement of hydrogen in amino group via the formation of C–N–C and C
N group.34 The 1260 cm−1 for the C–N stretching vibration of aniline shifts to ca. 1223 cm−1, which can be assigned to C–N–C group.28 The similar peak position for the C–N–C group and T–O tetragon leads to the obviously higher intensity for the 1223 cm−1 peak after the adsorption of propanol over the aniline-adsorbed Ni-USY. The peak at 3754 cm−1 due to the interaction between aniline and terminal silanol shifts to ca. 3740 cm−1, which is the characteristic peak for the free terminal silanol, while a new peak at 3677 cm−1, being assigned to the bridged hydroxyl group (Si–OH–Al) of zeolite, appears. The above results indicate that there is the reaction between the propanol and adsorbed aniline molecule, and this leads to the replacement of hydrogen in amino group via the formation of C–N–C and C![[double bond, length as m-dash]](https://www.rsc.org/images/entities/char_e001.gif) N bonds, the releasement of the terminal silanol and the bridged hydroxyl group and the disassociation of aniline cation. It hints the formation of intermediates containing the imine and N-alkyl structures. We would like to address that the peak of carbonyl group (ca. 1698 cm−1) has not been identified for the adsorption over the clean Ni-USY catalyst, however, it appears over the aniline-adsorbed Ni-USY after the adsorption of propanol (cf. Fig. 10a and b). This is due to the fact that alkanol can be converted into either alkene via dehydration over Bronsted site at relatively lower temperature or aldehyde via dehydrogenation over Lewis acid site at relatively higher temperature.35 In the case for the adsorption of propanol over the clean Ni-USY catalyst, the rate for dehydration may have exceeded over that for dehydrogenation, while in the case for the adsorption of propanol over the aniline-adsorbed Ni-USY, the Bronsted acid site can be “poisoned” by aniline and thus the dehydrogenation is favorable but the dehydration unfavorable. Therefore, propaldehyde is first generated from propanol and then subjected to the subsequent reaction for the generation of quinoline from aniline and propanol over the Ni-USY catalyst. Increasing the temperature from 293 K to 423 K (Fig. 10b–g) and prolonging the adsorption time until 10 min at 293 K (Fig. 10g–i), a new peak at ca. 1493 cm−1, being related to the adsorption of pyridine compound over Lewis acid site,20 appears and its intensity increases gradually, while the other peaks change are almost unchanged. It is indicated that quinoline structure, containing pyridine sub-structure, have been generated. For the longer adsorption of propanol over the aniline-adsorbed Ni-USY catalyst (Fig. 10j and k),the peaks at 2962–2884 cm−1 for the stretching vibrations of CHx group, ca. 1698 cm−1 for the stretching vibration of C–O group, ca. 1223 cm−1 for the C–N–C group and ca. 1064 cm−1 for the stretching vibration of C–O group become very weak and the peaks at ca. 1463 and 1393 cm−1 for the stretching vibration of benzene ring and 1630 cm−1 for the vibration of C
N bonds, the releasement of the terminal silanol and the bridged hydroxyl group and the disassociation of aniline cation. It hints the formation of intermediates containing the imine and N-alkyl structures. We would like to address that the peak of carbonyl group (ca. 1698 cm−1) has not been identified for the adsorption over the clean Ni-USY catalyst, however, it appears over the aniline-adsorbed Ni-USY after the adsorption of propanol (cf. Fig. 10a and b). This is due to the fact that alkanol can be converted into either alkene via dehydration over Bronsted site at relatively lower temperature or aldehyde via dehydrogenation over Lewis acid site at relatively higher temperature.35 In the case for the adsorption of propanol over the clean Ni-USY catalyst, the rate for dehydration may have exceeded over that for dehydrogenation, while in the case for the adsorption of propanol over the aniline-adsorbed Ni-USY, the Bronsted acid site can be “poisoned” by aniline and thus the dehydrogenation is favorable but the dehydration unfavorable. Therefore, propaldehyde is first generated from propanol and then subjected to the subsequent reaction for the generation of quinoline from aniline and propanol over the Ni-USY catalyst. Increasing the temperature from 293 K to 423 K (Fig. 10b–g) and prolonging the adsorption time until 10 min at 293 K (Fig. 10g–i), a new peak at ca. 1493 cm−1, being related to the adsorption of pyridine compound over Lewis acid site,20 appears and its intensity increases gradually, while the other peaks change are almost unchanged. It is indicated that quinoline structure, containing pyridine sub-structure, have been generated. For the longer adsorption of propanol over the aniline-adsorbed Ni-USY catalyst (Fig. 10j and k),the peaks at 2962–2884 cm−1 for the stretching vibrations of CHx group, ca. 1698 cm−1 for the stretching vibration of C–O group, ca. 1223 cm−1 for the C–N–C group and ca. 1064 cm−1 for the stretching vibration of C–O group become very weak and the peaks at ca. 1463 and 1393 cm−1 for the stretching vibration of benzene ring and 1630 cm−1 for the vibration of C![[double bond, length as m-dash]](https://www.rsc.org/images/entities/char_e001.gif) N group remain, while the characteristic peaks for quinolines compound become stronger.36 It shows that more quinolines compound are generated with prolonging the time for the adsorption of propanol.
N group remain, while the characteristic peaks for quinolines compound become stronger.36 It shows that more quinolines compound are generated with prolonging the time for the adsorption of propanol.
3.4 Mechanism for the reaction of aniline and propanol
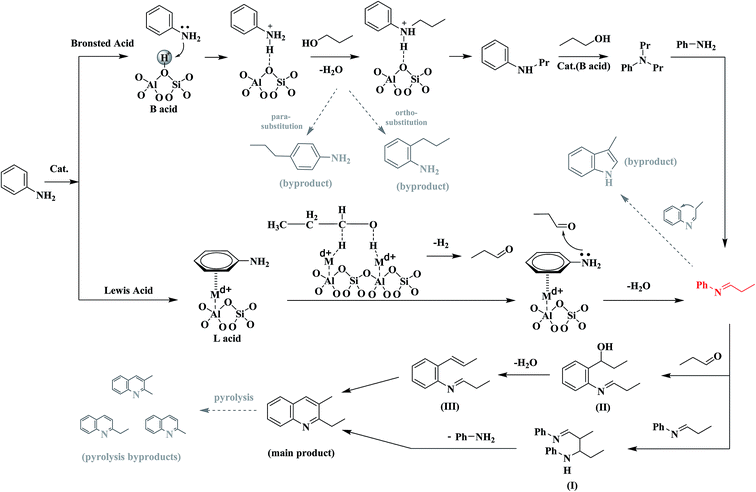
Based on all the above results and discussions in Sections 3.1–3.4, one can concluded that the increase in the concentration ratio of Lewis acid sites to Bronsted acid sites via nickel ion exchange and/or ZnCl2 loading over USY zeolite favors the conversion of aniline and propanol to quinolines, particularly 2E-3MQ; the generation of quinolines involves the formation of the important intermediate related to N-alkylaniline and the step for the formation of propaldehyde from propanol. We have proposed a mechanism for the reaction of aniline and propanol to quinolines, over USY-based catalyst, which is illustrated in Fig. 11.There can be two possible routes for the generation of quinolines from the reaction of aniline and propanol. In route one, aniline is first adsorbed via the interaction between amino group and a Bronsted acid site to formed a Ph-NH3+ cation over the surface of catalyst. Then, the adsorbed aniline cation reacts with the free or weakly adsorbed propanol to generate the N-alkylaniline cations, which are either dissociated to release the byproducts NPA and/or DNPA, recovering the Bronsted acid sites, or subjected to the subsequent reaction of nucleophilic attacking by aniline to generate N-phenylpropan-1-imine as intermediate.11 It is also possible that propanol attacks the 2- and 4-sites of the adsorbed aniline cation, due to the conjugation of positive charge, resulting in 2-propylaniline and/or 4-propylaniline as byproducts. The further reaction between two molecular imines leads to the formation of an intermediate (I), of which the cyclization generates the product 2E-3MQ. In route two, aniline is first adsorbed via the π-interaction between benzene ring and a Lewis acid site to form a Ph-NH2 → Nin+ adduct and propanol is adsorbed and dehydrogenated into propaldehyde over the surface of catalyst. Then, the adsorbed aniline reacts with the adsorbed propaldehyde to generate N-phenylpropan-1-imine as intermediate. The further reaction between the imine and another molecular propaldehyde leads to the formation of an intermediate (II), which is first dehydrated into another intermediate (III) and then subjected to the cyclization reaction to generate the product 2E-3MQ. In both the routes, the N-phenylpropan-1-imine intermediate is generated, and it may be further converted into 3-methylindole as byproduct, being promoted by Bronsted acid site. Besides, the main product 2E-3MQ can be also converted into the byproducts like 2,3-DMQ, 2-EQ and 2-MQ via pyrolysis.
In the above mechanism, the route one requires the presence of Bronsted acid site for the generation of aniline cation and then alkylaniline cations, however, the Bronsted acid site is unfavorable to the reaction between alkylaniline cations and aniline to generate the key intermediate N-phenylpropan-1-imine and also promotes the generation of byproduct 3-methylindole. The route two requires the presence of Lewis acid site for the generations of π-adsorbed aniline and propaldehyde, of which the reaction leads to the key intermediate N-phenylpropan-1-imine. In the Sections 3.1–3.3, it has been clarified that the catalyst with higher concentration ratio of Lewis acid site to Bronsted acid site possesses a larger activity for the generation of quinolines. Therefore, the route one contributes predominantly to the formation of quinolines via the reaction of aniline and propanol. However, the presence of an appreciable amount of N-alkylaniline in the products mixture enables that the route two cannot also be excluded in contributing to the formation of quinolines from the reaction of aniline and propanol.
4. Conclusion
A novel approach for the synthesis of quinolines via the reaction of aniline and propanol over modified USY catalyst has been established in this paper. The nickel ion exchange leads to the increase in the concentration of Lewis acid site and the decrease in the concentration of Bronsted acid site, and the subsequent ZnCl2 and Ni loading promotes further the above variations in the concentration of acid site. Among various catalysts tested, the ZnCl2/Ni-USY is proved to be the most efficient one, over which a 96.4% conversion of aniline and 78.3% total yield of quinolines with 81.2% total selectivity to quinolines and 60.1% selectivity to 2-ethyl-3-methylquinoline at 683 K have been achieved. The in situ FT-IR study on the mechanism for the reaction of aniline and propanol demonstrates that there are two possible routes for the generation of quinoline. The route one involves the adsorption of aniline to generate aniline cation and its reaction with propanol over Bronsted acid site, while the route two involves the involves the π-adsorption of aniline and its reaction with propaldehyde generated from the dehydrogenation of propanol over Lewis acid site. In both the routes, N-phenylpropan-1-imine is proposed to be the key intermediate, and the further reaction between N-phenylpropan-1-imine (route one) and that between N-phenylpropan-1-imine and propaldehyde (route two) leads to the generation of 2-ethyl-3-methylquinoline. Basing on 2-ethyl-3-methylquinoline and N-phenylpropan-1-imine, other quinolines and byproducts can be also generated to some extent. The correlation between catalytic performance and catalyst characterization suggests that the route one basing on Lewis acid site is more favorable to the generation of quinolines from the reaction of aniline and propanol, relative to the route two basing on Bronsted acid site. It is believed that the results derived from this work would be very help for the design and development of the catalyst for the synthesis of quinolines.Acknowledgements
This work was supported by the National Natural Science Foundation of China (Grant 21376068), Program for New Century Excellent Talents in University, the Ministry of Education of P. R. China, and the Program for Lotus Scholar in Hunan Province, P. R. China.References
- Y. Morimoto, F. Matsuda and H. Shirahama, Synlett, 1991, 202 CrossRef.
- M. Mlsobe, T. Nishikawa, N. Yamamoto, T. Tsukiyama and T. Okita, J. Heterocycl. Chem., 1992, 29, 619 CrossRef.
- D. G. Markees, V. C. Dewey and G. W. Kidder, J. Med. Chem., 1970, 13, 324 CrossRef CAS PubMed.
- A. A. Alhaider, A. Abdelkader and E. J. Lien, J. Med. Chem., 1985, 28, 1398 CrossRef.
- A. Kleeman, J. Engel, B. Kutscher and D. Reichert, Org. Process Res. Dev., 2008, 12(3), 546 CrossRef.
- M. Balasubramanian and J. G. Keay, Compr. Heterocycl. Chem. II, 1996, 245–300 CAS.
- V. V. Kouznetsov, L. Y. Vargas Méndez and C. M. Meléndez Gómez, Curr. Org. Chem., 2005, 9, 141–161 CrossRef CAS.
- S. A. Yamashkin and E. A. Oreshkina, Chem. Heterocycl. Compd., 2006, 42, 701–718 CrossRef CAS.
- Y. Watanabe, K. Takatsuki, S. C. Shim, T. Mitsudo and Y. Takegami, Bull. Chem. Soc. Jpn., 1978, 51, 3397 CrossRef CAS.
- C. H. Mcateer, R. D. Davies and J. R. Calvin, World Patent 03051, 1997.
- C. S. Cho, B. H. Oh, J. S. Kim, T.-J. Kim and S. C. Shim, Chem. Commun., 2000, 1885–1886 RSC.
- M. Campanati, P. Savini, A. Tagliani, A. Vaccari and O. Piccolo, Catal. Lett., 1997, 47, 247 CrossRef CAS.
- M. Campanati, A. Vaccari and O. Piccolo, Catal. Today, 2000, 60(1), 289–295 CrossRef CAS.
- R. Brosius, D. Gammon, F. Van Laar, E. Van Steen, B. Sels and P. Jacobs, J. Catal., 2006, 239, 362–368 CrossRef CAS.
- G. D. Venu and M. Subrahmanyam, Catal. Commun., 2001, 2, 219–223 CrossRef.
- J. Van Aelst, M. Haouas, E. Gobechiya, K. Houthoofd, A. Philippaerts, S. P. Sree, C. E. A. Kirschhock, P. Jacobs, J. A. Martens, B. F. Sels and F. Taulelle, J. Phys. Chem. C, 2014, 118(39), 22573–22582 CAS.
- J. A. Van Bokhoven, D. C. Koningsberger and P. Kunkeler, J. Am. Chem. Soc., 2000, 122(51), 12842–12847 CrossRef CAS.
- J. X. Chen, T. H. Chen and N. Guan, Catal. Today, 2004, 93–95, 627–630 CrossRef CAS.
- J. L. Agudelo, E. J. M. Hensen, S. A. Giraldo and L. J. Hoyos, Energy Fuels, 2016, 30(1), 616–625 CrossRef CAS.
- A. Penkova, L. F. Bobadilla, F. R. Sarria, M. A. Centeno and J. A. Odriozola, Appl. Surf. Sci., 2014, 317, 241–251 CrossRef CAS.
- M. I. Zaki, M. A. Hasan, F. A. Al-Sagheer and L. Pasupulety, Colloids Surf., A, 2001, 190, 261–274 CrossRef CAS.
- D. R. Brown, Geol. Carpathica--Clays, 1994, 45, 45 Search PubMed.
- ed. A. Elsen, P. Grobet, M. Keung, H. Leeman, R. A. Schoonheydt and H. Toufar, Proceedings of the Euro Clay 95, Leuven (B), 1995 Search PubMed.
- W. Wang, J. Gang Chen, L. Ping Song, Z. Tie Liu, Z. Wen Liu, J. Lu, J. Liang Xiao and Z. P. Hao, Energy Fuels, 2013, 27, 6339–6347 CrossRef CAS.
- A. Bazyari, A. A. Khodadadi, N. Hosseinpour and Y. Mortazavi, Fuel Process. Technol., 2009, 90(10), 1226–1233 CrossRef CAS.
- C. X. Wen, H. L. Feng, L. H. Ning, L. X. Mei and Y. Z. Feng, Catal. Today, 2010, 158(3–4), 198–204 Search PubMed.
- T. Zhang, C. Leyva, G. F. Froment and J. Martinis, Ind. Eng. Chem. Res., 2015, 54(3), 858–868 CrossRef CAS.
- G. A. Eimer, M. B. Gómez Costa, L. B. Pierella and O. A. Anunziata, J. Colloid Interface Sci., 2003, 263, 400–407 CrossRef CAS PubMed.
- H. Piest, G. von Helden and G. Meijer, J. Chem. Phys., 1999, 110(4), 2010–2015 CrossRef CAS.
- C. Gée, S. Douin, C. Crépin and P. Bréchignac, Chem. Phys. Lett., 2001, 338(2–3), 130–136 CrossRef.
- C. Greve, E. T. J. Nibbering and H. Fidder, J. Phys. Chem. B, 2013, 117, 15843–15855 CrossRef CAS PubMed.
- E. K. Plyler, J. Res. Natl. Bur. Stand., 1952, 48(4), 202–220 Search PubMed.
- T. D. Courtney, C. C. Chang, R. J. Gorte, R. F. Lobo, W. Fan and V. Nikolakis, Microporous Mesoporous Mater., 2015, 210, 69–76 CrossRef CAS.
- H. Namli and O. Turhan, Spectrochim. Acta, Part A, 2006, 64, 93–100 CrossRef PubMed.
- C. Bläker, C. Pasel, M. Luckas, F. Dreisbach and D. Bathen, Microporous Mesoporous Mater., 2017, 241, 1–10 CrossRef.
- N. Puviarasan, V. Arjunan and S. Mohan, Turk. J. Chem., 2004, 28, 53–65 CAS.
| This journal is © The Royal Society of Chemistry 2017 |


