
 Open Access Article
 This Open Access Article is licensed under a Creative Commons Attribution-Non Commercial 3.0 Unported Licence
Phenolics profiling of pomace extracts from different grape varieties cultivated in Argentina
Ariel Fontana *,
Andrea Antoniolli,
María Agustina D'Amario Fernández and
Rubén Bottini
*,
Andrea Antoniolli,
María Agustina D'Amario Fernández and
Rubén Bottini
Laboratorio de Bioquímica Vegetal, Instituto de Biología Agrícola de Mendoza, Consejo Nacional de Investigaciones Científicas y Técnicas-Universidad Nacional de Cuyo, Almirante Brown 500, 5528AHB Chacras de Coria, Argentina. E-mail: afontana@mendoza-conicet.gob.ar; fontana_ariel@yahoo.com.ar; Tel: +54-0261-4135010 ext. 1228
First published on 6th June 2017
Abstract
Grape pomace can be considered as an excellent and inexpensive source of phenolic compounds with potential bioactive properties. Therefore, the key aim of this study was to carry out a comparative study of different Argentinean grape varieties for selecting the most convenient residue during the recovery of compounds with antioxidant activities that will be useful in emerging industrial applications. Phenolics, including 17 non-anthocyanins and 13 anthocyanins, isolated from grape pomace (GP) obtained from the varieties Malbec, Cabernet Sauvignon, Cabernet Franc, and Merlot, were characterised via assessing different chemical profiles of the studied samples. The maximum concentrations of the non-anthocyanins corresponded to the following flavanols: (−)-epicatechin (5518 μg g−1), (+)-catechin (5340 μg g−1), procyanidin B1 (1820 μg g−1), and syringic acid (6665 μg g−1). Malvidin-3-glucoside was the most abundant anthocyanin (32![[thin space (1/6-em)]](https://www.rsc.org/images/entities/char_2009.gif) 056 μg g−1). The compound OH-tyrosol was first identified and quantified in the GPE of Cabernet Franc and Malbec. Moreover, stilbene trans-resveratrol was found at the levels as high as 328 μg g−1 GPE in Malbec, thus highlighting the potentiality of the variety as a source of compounds with nutraceutical value. A discussion about the relationship between the high levels of syringic acid and the anthocyanin malvidin-3-glucoside has also been presented. Based on the results, new knowledge for understanding the possible synergic effects between the contents of compounds of different families in the extracts was presented. This information can be helpful for the technological application of the extracts and to justify different beneficial effects achieved when these extracts are used in experimental models.
056 μg g−1). The compound OH-tyrosol was first identified and quantified in the GPE of Cabernet Franc and Malbec. Moreover, stilbene trans-resveratrol was found at the levels as high as 328 μg g−1 GPE in Malbec, thus highlighting the potentiality of the variety as a source of compounds with nutraceutical value. A discussion about the relationship between the high levels of syringic acid and the anthocyanin malvidin-3-glucoside has also been presented. Based on the results, new knowledge for understanding the possible synergic effects between the contents of compounds of different families in the extracts was presented. This information can be helpful for the technological application of the extracts and to justify different beneficial effects achieved when these extracts are used in experimental models.
1. Introduction
The increase of consumers' awareness for safer foods, mainly due to the use of additives, as well as for functional foods acquired in recent years underlays the need to identify natural alternatives and probably safer (and nutritious) antioxidants for the food industry.1–3 Similarly, modern industries aim to reduce the environmental impact of their waste, develop cleaner processes of production, and increase the quality of their products to differentiate them from those of their competitors. Thus, efficient, relatively low-cost, and environmentally sustainable use of the by-products of the food industry is of undeniable importance.2Grape pomace (GP) is an abundant underused residue obtained after the winemaking process, accounting for about 20% in weight of the processed grapes.2 Red grapes winemaking involves the steps of crushing, maceration, and fermentation, in which phenolic compounds are transferred from seeds and skins to the must.4,5 Several variables such as grape variety, berry ripeness, environmental factors, and technological procedures used during winemaking exert an effect on the qualitative and quantitative extractability of the phenolic compounds.5 Moreover, the winemaking process being not exhaustive has been characterised by an incomplete extraction, leaving a by-product that still contains relatively high levels of phenolic compounds.6 Consequently, GP constitutes a potentially abundant and relatively low-cost source of a wide range of phenolic compounds including monomeric and oligomeric flavonols, flavanols, stilbenes, and a variety of anthocyanin glycosides, which can be used in the pharmaceutical and food industries.7 These compounds are currently receiving significant attention because of their health-promoting effects and other properties in different biological and food systems, which can be exploited from a technological point of view.6,8 Their properties include antioxidant, anti-inflammatory, cardioprotective, cancer chemo-preventive and neuro-protective properties.7–10 Consequently, products containing phenolic compounds can be potentially considered as healthy foods because of their health promoting or disease-preventing properties – the so-called functional foods.8 In this context, GPs are a rich source of bioactive substances with many applications and health benefits; thus, it is of greatest significance to determine their composition. These data may offer valuable information to characterize these residues, and this would increase the value of the products prior to their industrial application.
The economic importance of the winemaking industry to Argentina, which represents 5% of the world's wine production, lies in the fact that the most reported studies have been focused on the antioxidant characteristics and phenolics profile of wines.11,12 Currently, the available information on the anthocyanin and non-anthocyanin phenolic compounds isolated from Argentinean GPs is limited, and a comparison of the phenolic contents of GP derived from different grape varieties has not been carried out. Antoniolli et al.13 reported the characterization of phenolic compounds and the in vitro antioxidant activity of the GPs obtained from grapes cv. Malbec cultivated in Mendoza, Argentina, for the first time.
The main objective of the present study was to determine the profiles and amounts of individual phenolic compounds in the GPEs of 11 different press residues obtained during winemaking via high performance-liquid chromatography multi-wavelength detection (HPLC-MWD). The aim was to obtain novel data from different grape varieties cultivated in Mendoza, Argentina, to expand the knowledge about the composition of GPs, thus increasing the value of the by-product. Moreover, the study was focused on evaluating some compounds that have been less studied in these matrices but have high potentiality as bioactive compounds and antioxidants. The data obtained herein have also been discussed with new insights for the winemaking industry to upgrade the value of the wine residues as a potential source of natural antioxidants in diverse biotechnological applications. In addition, an integrative discussion of the correlation between the qualitative and quantitative profiles and antioxidant activity results has been presented, also highlighting the presence of compounds that have not been commonly reported but could be involved in synergic effects empowering the overall bioactive potential.
2. Experimental
2.1. Standards, solvents, and chemicals
Standards of gallic acid (99%), 3-hydroxytyrosol (≥99.5%), (−)-gallocatechin (≥98%), (−)-gallocatechin gallate (≥99%), (−)-epicatechin gallate (≥98%), procyanidin B1 (≥90%), (+)-catechin (≥99%), procyanidin B2 (≥90%), (−)-epicatechin (≥95%), caffeic acid (99%), syringic acid (≥95%), coumaric acid (99%), ferulic acid (≥99%), trans-resveratrol (≥99%), quercetin hydrate (95%), kaempferol-3-glucoside (≥99%), and malvidin-3-O-glucoside chloride (≥95%) were purchased from Sigma-Aldrich. The standard of 2-(4-hydroxyphenyl)ethanol (tyrosol) (≥99.5%) was obtained from Fluka (Buchs, Switzerland). Stock solutions of compounds were prepared in methanol at the concentration levels of 1000 μg mL−1. Further dilutions were monthly prepared using methanol and stored in dark-glass bottles at −20 °C. Calibration standards were dissolved in the initial mobile phase of each method (LMW-PPs or anthocyanins). HPLC-grade acetonitrile (MeCN) and formic acid (FA) were acquired from Mallinckrodt Baker (Inc. Phillipsburg, NJ, USA). Both primary–secondary amine (PSA) and octadecylsilane (C18) were obtained from Waters (Milford, MA, USA). Reagent grade NaCl, anhydrous Na2CO3, MgSO4, and CaCl2 were purchased from Biopack (Buenos Aires, Argentina). Hydrochloric acid, ethanol, and Folin–Ciocalteu reagent were purchased from Merck (São Paulo, Brazil). Trolox reagent (6-hydroxy-2,5,7,8-tetramethylchroman-2-carboxylic acid), NaH2PO4·2H2O, Na2HPO4·12H2O, fluorescein, and 2,2′-azobis-2-methylpropionamidine dihydrochloride (AAPH) were purchased from Sigma-Aldrich (Steinheim, Germany). Trolox standards solutions at different concentrations (0, 3.125, 6.25, 12.5, 25, and 50 μmol L−1) were prepared with 75 mmol L−1 NaH2PO4–Na2HPO4 (pH 7.0). Fluorescein was prepared as a 20 nmol L−1 solution in 75 mmol L−1 NaH2PO4–Na2HPO4 (pH 7.0). The AAPH reagent was prepared at 140 mmol L−1 in 75 mmol L−1 NaH2PO4–Na2HPO4 (pH 7.0). Ultrapure water was obtained using a Milli-Q system (Millipore, Billerica, MA, USA).2.2. Samples and phenolic compound extraction
This study was conducted with different GPs of Vitis vinifera L. cv. Malbec, Cabernet Sauvignon, Cabernet Franc, and Merlot, corresponding to different years and locations of collection (data included as a footnote in Fig. 1). The material was provided by a local winery from the vineyards of Mendoza's region, Argentina. The winemaking was conducted with daily pumping and contact of the skins and seeds with the juice for 11 days. After this, must was pressed, and the fresh GP was obtained, placed in ice-cooled boxes for transportation to the laboratory, and stored at −20 °C until processing.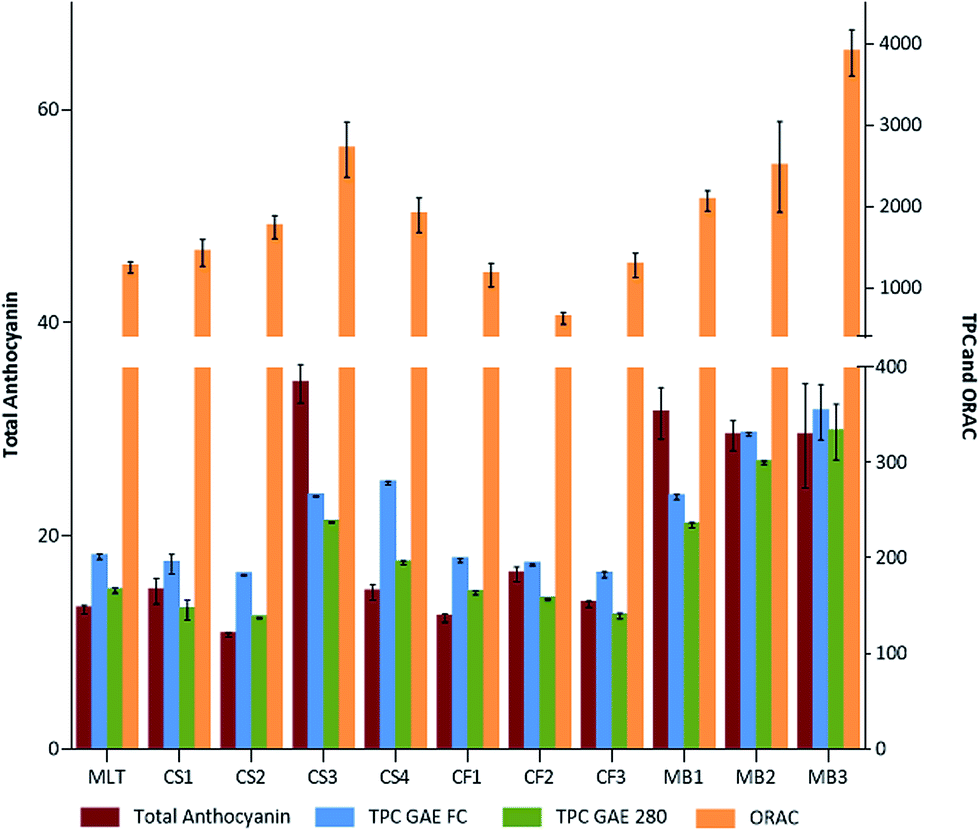 | ||
| Fig. 1 Levels of total anthocyanin, TPC, and antioxidant activity (ORAC) in freeze-dried extracts. Average contents with their standard deviations, n = 3 replicates. Samples identification: MLT, Merlot 2015 harvest from Gualtallary location; CS1, Cabernet Sauvignon 2015 from Gualtallary; CS2, Cabernet Sauvignon 2015 from Altamira location; CS3, Cabernet Sauvignon 2016 from Altamira; CS4, Cabernet Sauvignon 2016 from Agrelo location; CF1, Cabernet Franc 2015 from Altamira location; CF2, Cabernet Franc 2016 from Altamira north side location; CF3, Cabernet Franc 2016 from Altamira location; MB1, Malbec 2016 from Gualtallary location; MB2, Malbec 2016 from Agrelo location; and MB3, Malbec 2015 from Gualtallary location. | ||
The recovery of the phenolic compounds from the GPs was performed via solid–liquid extractions according to a previous report.13 Herein, eighty grams of fresh GP was ground using a laboratory mixer with an aliquot of the extraction solvent (ethanol:water, 50:50 v/v) at a 5:1 solvent-to-sample ratio. The extraction was carried out for 2 h under continuous stirring at 60 °C. The liquid was filtered through a filter paper and concentrated at low pressure using a rotary evaporator at 40 °C. The concentrated extracts were freeze-dried for 96 h at 0.12 bar and −45 °C (Free Zone 2.5, Labconco, Missouri, USA). Freeze-dried extracts were placed in sealed tubes and kept at −20 °C in a dry atmosphere and darkness prior to analysis. Extracts of the samples were prepared in duplicate. Non-anthocyanins were extracted from the extracts according to a previously reported method with some modifications.14 Briefly, 50 mg of freeze-dried extract was dissolved in water to obtain up to 5 mL volume and extracted with 2.5 mL acidified (1% FA) MeCN. For phase separation, 1.5 g NaCl and 4 g anhydrous MgSO4 were added, shaken for 1 min, and centrifuged for 10 min at 8000 rpm (6450 rcf). Then, a 1 mL aliquot of the upper MeCN phase was transferred to a 2 mL d-SPE clean-up tube containing 150 mg anhydrous CaCl2, 50 mg PSA, and 50 mg C18. The mixture was vortexed for 30 s and centrifuged for 2 min at 12000 rpm (8400 rcf). Finally, an aliquot of the extract was evaporated to dryness; the residue was reconstituted in the initial mobile phase [ultrapure water (0.1% formic acid; FA)/MeCN (95:5)] and analysed via HPLC-MWD.
For anthocyanin determination, an aliquot of 5 mg freeze-dried extract was dissolved in 50 mL of the initial mobile phase of the anthocyanins and analysed by HPLC-MWD.
2.3. Total phenolic content (TPC) and total anthocyanin
The TPC was spectrophotometrically measured using a UV-vis spectrophotometer Cary-50 (Varian Inc., Mulgrave, Australia) according to a previously reported method.13 First, 5 mg of the freeze dried extract was dissolved in ethanol 50% (v/v) aqueous solution. The TPC was determined by the Folin–Ciocalteu assay (FC) via direct reading at 280 nm of the sample diluted 1:100 v/v.15 The TPC was calculated from a calibration curve made with the standard solutions of gallic acid (three replicates) in the range between 5.4 and 31.5 mg L−1 (R2 = 0.999) and expressed as gallic acid equivalents (GAE 280, mg g−1). For the FC method, an aliquot of 0.25 mL of dissolved sample, 12.5 mL of distilled water, 1.25 mL of Folin–Ciocalteu reagent, and 5 mL of 20% Na2CO3 solution were mixed in a 25 mL flask and distilled water was added to obtain the final volume. Prior to the measurement of the absorbance at 765 nm, the mixture was homogenized and incubated for 30 min in darkness at 25 °C. TPC was expressed as GAE mg g−1 freeze-dried GPE using a calibration curve with gallic acid as the standard (three replicates) in a range between 0 and 200 mg L−1 (R2 = 0.999).
Total anthocyanin contents of the extracts were determined according to the method reported by Iacopini et al.16 Samples were diluted with ethanol:water:hydrochloric acid at 0.12 mol L−1 (79:29:1 v/v/v), and the absorbance was measured using a UV-vis spectrophotometer Cary-50 (Varian Inc., Mulgrave, Australia) at 540 nm. The calibration curve was made with the standard solutions of malvidin-3-O-glucoside (three replicates) in the range between 25 and 250 mg L−1 (R2 = 0.997), and results were expressed as mg of malvidin-3-O-glucoside per gram of GPE (mg g−1).
2.4. Antioxidant activity
The antioxidant activity of the GPE was determined by the oxygen radical absorbance capacity (ORAC) assay, as described in our previous reports with some modifications.13 Re-suspended GPE solutions, as described in the TPC determination, were diluted to 1:750 v/v in 75 mmol L−1 NaH2PO4–Na2HPO4 (pH 7.0). After this, fifty μL aliquots of the diluted samples and trolox standards (0, 3.125, 6.25, 12.5, 25, and 50 μmol L−1) were added to a 96-well plate. Then, 100 μL of fluorescein solution was added, and the mixture incubated at 37 °C for 7 min before the addition of 50 μL of 140 mmol L−1 peroxyl radical generator AAPH. Fluorescence was monitored by 485 nm excitation and 538 nm emissions at 1 min intervals for 90 min using a microplate fluorometer (Fluoroskan Ascent FL, Thermo Fisher Scientific Inc, Wilmington, DE). The area below the curve of the fluorescence decay during 90 min was calculated for each sample by integrating the relative fluorescence curve, and the ORAC was expressed as μmol of trolox equivalents per gram of GPE (μmol TE per g).
2.5. Determination of non-anthocyanins
HPLC separations were carried out using a Dionex Ultimate 3000 HPLC-MWD system (Dionex Softron GmbH, Thermo Fisher Scientific Inc., Germering, Germany) and a reversed-phase Kinetex C18 column (3.0 mm × 100 mm, 2.6 μm) (Phenomenex, Torrance, CA, USA). Ultrapure H2O with 0.1% FA (A) and MeCN (B) were used as the mobile phases. Analytes were separated using a previously reported method14 with the following gradient: 0–2.7 min, 5% B; 2.7–11 min, 30% B; 11–14 min, 95% B; 14–15.5 min, 95% B; 15.5–17 min, 5% B; 17–20, 5% B. The mobile phase flow was 0.8 mL min−1. The column temperature was 35 °C, and the injection volume was 5 μL. The quantification wavelengths for different families of analytes were 254 nm, 280 nm, 320 nm, and 370 nm. Analytes present in the samples were quantified using an external calibration with pure authentic standards to achieve unambiguous identification of the analytes. Linear ranges between 2 and 1000 μg mL−1 with the coefficient of determination (R2) higher than 0.998 were obtained for all the studied phenolic compounds.2.6. Determination of anthocyanins
For the HPLC-MWD analysis of anthocyanins, separations were carried out using a reversed-phase Kinetex C18 column (3.0 mm × 100 mm, 2.6 μm) (Phenomenex, Torrance, CA, USA). The mobile phase consisted of ultrapure H2O:FA:MeCN (87:10:3, v/v/v; eluent A) and ultrapure H2O:FA:MeCN (40:10:50, v/v/v; eluent B) with the following gradient: 0 min, 10% B; 0–6 min, 25% B; 6–10 min, 31% B; 10–11 min, 40% B; 11–14 min, 50% B; 14–15 min, 100% B; 15–17 min, 10% B; 17–21 min, 10% B. The mobile phase flow was 0.8 mL min−1, column temperature was 25 °C, and the injection volume was 5 μL. Quantifications were carried out via area measurements at 520 nm, and the anthocyanin content was expressed as malvidin-3-glucoside, using an external standard calibration curve (1–250 μg mL−1, R2 = 0.9984). The anthocyanin compounds detected via HPLC-MWD were confirmed by comparing with the elution profile and identified analytes achieved in our previous work.13
3. Results and discussion
3.1. Total anthocyanins, TPC, and antioxidant activity
Several analytical spectrophotometric methods have been developed for the determination of TPC and other determinations such as total anthocyanin content. These assays are based on different principles and used to determine different structural groups present in the phenolic compounds.6,17 The determination of these parameters together with the antioxidant activity is the starting point for the preliminary characterization of GPE because they provide valuable information about the relative composition of the sample and its potentiality as a bioactive additive.Fig. 1 presents the data of the spectrophotometric analyses and antioxidant activity of GPEs obtained from different grape varieties and locations. With respect to the total anthocyanin content, CS3 (Cabernet Sauvignon 2015 harvest from Altamira location) and MB1 (Malbec 2016 harvest from Gualtallary) showed the maximum levels of anthocyanins. However, while in all the GPE Malbec samples, high levels of total anthocyanin were observed, showing values twice as high (or more) as those found in others GPEs, and in the Cabernet Sauvignon samples, only CS3 displayed these levels. De la Cerda-Carrasco et al.18 reported 1.4 and 0.7 mg malvidin 3-glucoside per g GP (DM) from cvs. Cabernet Sauvignon and Carménère, respectively, and Iacopini et al.16 reported the total anthocyanin levels in the skins of different grape varietals, obtaining concentrations ranging from 15.9 to 39.3 mg g−1 of skin DM.
In addition, it has been observed that the TPC values, obtained via both the FC method and GAE 280, were higher in MB3 (Malbec 2015 harvest from Gualtallary; 352.8 and 332.0 mg GAE per g GPE, respectively), followed by MB2 (MB2, Malbec 2016 from Agrelo), CS3, MB1, and CS4 (Cabernet Sauvignon 2016 from Agrelo). The lower TPC values were obtained in CS2 (Cabernet Sauvignon 2015 from Altamira; 182.1 ± 9.6 and 137.1 ± 0.7) and CF3 (Cabernet Franc 2016 from Altamira; 182.6 ± 5.7 and 139.4 ± 3.1). In our previous study with Malbec GPE (from Gualtallary vineyard, 2013 vintage), levels of 196.2 ± 22.7 mg GAE per g GPE and 165.7 ± 30.2 mg GAE per 280 g GPE were obtained.13
To estimate the capacity of antioxidants to neutralize the reactive oxygen and nitrogen species (ROS/RNS), in a simple experimental way, several in vitro methodologies have been developed. Among these, the ORAC assay is one of the most employed methods.19 As per the ORAC assay, the maximum antioxidant activity was observed in the MB3 sample (3889 μmol TE per g GPE), followed by CS3, MB2, and MB1 (between 2069 and 2701 μmol TE per g GPE). Ky et al.20 reported lower levels of ORAC (between 202 and 571 μmol TE per g DM seed crude extract of Grenache, Syrah, Carignan Noir, Mourvèdre, Counoise, Alicante Bouchet; and between 201 and 532 in the grape peel extracts), whereas Wang et al.21 obtained 1921 μmol TE per g DM in the Tempranillo grape variety. Other authors also found similar levels in the extracts, obtaining ORAC values of 2756 μmol TE per g GPE in a freeze-dried Malbec GPE,13 and values ranging between 1426 and 3669 μmol TE per g GPE for Alicante and Pinot noir cultivars,22 respectively, and in a commercial grape seed extract, ORAC values of 8620 μmol TE per g (ref. 23) were obtained.
In the present study, it was observed that the ORAC values maintained a similar trend between samples as observed for TPC, except for CS2, which presented high ORAC value despite its low TPC value. These general correspondences are in agreement with several authors' reports, which have described high correlation between the TPC and ORAC values in different samples.24–26 However, other authors did not observe any correlation between the TPC and ORAC value for the Norton and Cabernet Franc grape extracts, suggesting that the ability of the grape extract to scavenge peroxyl radicals is not solely dependent on its phenolic compound content.27 Additionally, samples, such as CS3, MB1, MB2, and MB3, presenting higher levels of anthocyanins also showed higher antioxidant activities, suggesting high degree of correlation between the two variables.
3.2. Identification and quantification of non-anthocyanins
A total of seventeen compounds of different chemical classes were identified and quantified in the analysed GPE samples. They corresponded to different non-flavonoids (hydroxybenzoic and hydroxycinnamic acids and stilbenes and phenylethanol analogs) and flavonoids (flavanols and flavonols). The compounds were successfully separated and identified by comparing their elution times and UV spectra with those obtained for pure standards. Table 1 shows the concentration of individual non-anthocyanins phenolic compounds detected and quantified. Fig. 2 presents a heat map combining the data of the phenolic compounds for each GPE for visualizing the changes related to each GPE sample. As can be observed, samples CS4, CF1 (Cabernet Franc 2015 from Altamira), MB1, and MB2 reveal the presence of 17 compounds. For the other samples, lower number of compounds were detected. In terms of the total non-anthocyanins (sum of quantified compounds), CS4 and MB3 exhibited highest amounts, with the concentrations between 73 and 140%, as compared to the other GPE samples (considering CS4 as 100%). For all the studied samples, with the exception of CS3, the family of flavanols presented the highest levels, with the concentrations ranging between 1066 (CS1, Cabernet Sauvignon 2015 from Gualtallary) and 12886 (CS4) μg g−1. Particularly, the maximum concentrations corresponded to epicatechin (5518 μg g−1, CS4), (+)-catechin (5340 μg g−1, MB3), and procyanidin B1 (1820 μg g−1, MB2). In MLT (Merlot 2015 from Gualtallary) and CS4 GPEs, the (−)-epicatechin concentrations were higher than those of (+)-catechin (between 19% for MLT and 43% for CS4 of total flavonols content), whereas the other samples showed an opposed comportment, with (+)-catechin being more abundant than (−)-epicatechin. These results agree with the previously reported results obtained for different red grape varieties.13,14,16,28 Moreover, this behaviour of CS4 as compared to that of other studied Cabernet Sauvignon samples could be due to the fact that the transfer rate of phenolics during winemaking is not a simple solid/liquid partition, rather other physicochemical processes may modulate this transference.29,30 An additional explanation of these high levels observed for (−)-epicatechin as compared to those of (+)-catechin is hydrolysis of the galloylated precursors, such as (−)-epicatechin gallate. This compound was quantified at a level of 1236 μg g−1 in CS4, the highest level of the studied samples. This explanation is also justified by the higher level of gallic acid in CS4 as compared to that in other samples. Similar results were reported by other authors for Merlot and Cabernet Sauvignon grape varieties.31
| MLT | CS1 | CS2 | CS3 | CS4 | CF1 | CF2 | CF3 | MB1 | MB2 | MB3 | |
|---|---|---|---|---|---|---|---|---|---|---|---|
| a Sample identification similar to that described in Fig. 1. | |||||||||||
| Hydroxybenzoic acids | |||||||||||
| Gallic acid | 116 ± 12 | 148 ± 3 | 361 ± 28 | 43 ± 7 | 599 ± 66 | 50 ± 9 | 99 ± 8 | 45 ± 3 | 285 ± 33 | 72 ± 8 | 448 ± 54 |
| Syringic acid | 730 ± 52 | 794 ± 49 | 936 ± 101 | 6665 ± 517 | 1044 ± 108 | 697 ± 38 | 720 ± 49 | 1714 ± 196 | 1442 ± 119 | 1494 ± 65 | 1605 ± 104 |
| Total | 846 | 942 | 1297 | 6708 | 1643 | 747 | 819 | 1759 | 1727 | 1566 | 2053 |
|
|||||||||||
| Hydroxycinnamic acids | |||||||||||
| Caffeic acid | 14 ± 1 | 10 ± 1 | 55 ± 3 | 5 ± 1 | 79 ± 1 | 14 ± 1 | 28 ± 3 | 13 ± 5 | 11 ± 2 | 36 ± 2 | 36 ± 3 |
| p-Coumaric acid | 26 ± 1 | 18 ± 2 | 57 ± 2 | 130 ± 16 | 92 ± 3 | 28 ± 2 | 50 ± 3 | 55 ± 10 | 45 ± 6 | 115 ± 4 | 119 ± 13 |
| Ferulic acid | 15 ± 1 | 12 ± 1 | 16 ± 1 | 32 ± 3 | 26 ± 1 | 18 ± 2 | 21 ± 1 | 27 ± 2 | 20 ± 3 | 38 ± 1 | 41 ± 4 |
| Total | 55 | 40 | 128 | 167 | 197 | 60 | 99 | 95 | 76 | 189 | 196 |
|
|||||||||||
| Stilbenes | |||||||||||
| trans-Resveratrol | 25 ± 2 | 5 ± 1 | 15 ± 1 | 13 ± 1 | 69 ± 2 | 7 ± 1 | 4 ± 1 | 22 ± 5 | 18 ± 3 | 36 ± 3 | 328 ± 21 |
| Total | 25 | 5 | 15 | 13 | 69 | 7 | 2 | 22 | 18 | 36 | 328 |
|
|||||||||||
| Flavanols | |||||||||||
| Procyanidin B1 | 824 ± 81 | 199 ± 34 | 862 ± 101 | 55 ± 6 | 613 ± 87 | 373 ± 41 | 1237 ± 102 | 44 ± 7 | 1286 ± 207 | 1820 ± 10 | 1430 ± 184 |
| (+)-Catechin | 127 ± 86 | 380 ± 27 | 3400 ± 351 | 413 ± 51 | 4533 ± 272 | 615 ± 6 | 605 ± 70 | 675 ± 65 | 515 ± 56 | 532 ± 85 | 5340 ± 563 |
| Procyanidin B2 | n.d. | 20 ± 3 | 15 ± 0.1 | n.d. | 257 ± 3 | 666 ± 9 | n.d. | n.d. | 1378 ± 101 | 323 ± 57 | 18 ± 3 |
| (−)-Epicatechin | 296 ± 85 | 252 ± 25 | 1841 ± 164 | 192 ± 22 | 5518 ± 403 | 194 ± 2 | 147 ± 15 | 584 ± 61 | 82 ± 10 | 25 ± 2 | 3962 ± 383 |
| (−)-Gallocatechin | 195 ± 1 | 202 ± 30 | 342 ± 17 | 848 ± 126 | 496 ± 5 | 163 ± 13 | 236 ± 22 | 428 ± 45 | 167 ± 4 | 196 ± 9 | 300 ± 21 |
| (−)-Gallocatechin gallate | n.d. | n.d. | 362 ± 54 | n.d. | 233 ± 13 | 134 ± 14 | 130 ± 12 | n.d. | 138 ± 9 | 97 ± 6 | 229 ± 21 |
| (−)-Epicatechin gallate | 103 ± 16 | 13 ± 1 | 291 ± 18 | n.d. | 1236 ± 176 | 193 ± 24 | 29 ± 1 | 53 ± 6 | 321 ± 17 | 15 ± 1 | n.d. |
| Total | 1545 | 1066 | 7113 | 1508 | 12![[thin space (1/6-em)]](https://www.rsc.org/images/entities/b_char_2009.gif) 886 886 |
2338 | 2384 | 1784 | 3887 | 3008 | 11279 |
|
|||||||||||
| Flavonols | |||||||||||
| Kaempferol-3-glucoside | n.d. | 45 ± 2 | 41 ± 3 | n.d. | 39 ± 4 | 40 ± 1 | n.d. | n.d. | 36 ± 2 | 43 ± 1 | n.d. |
| Quercetin | 582 ± 40 | 688 ± 61 | 922 ± 94 | n.d. | 1695 ± 201 | 742 ± 77 | 218 ± 17 | n.d. | 847 ± 9 | 1639 ± 181 | 1668 ± 203 |
| Total | 582 | 733 | 963 | — | 1734 | 782 | 218 | — | 883 | 1682 | 1668 |
|
|||||||||||
| Other compounds | |||||||||||
| OH-tyrosol | n.d. | n.d. | n.d. | 12 ± 1 | 39 ± 2 | 12 ± 2 | 15 ± 5 | 9 ± 1 | 11 ± 3 | 15 ± 1 | n.d. |
| Tyrosol | 40 ± 4 | 27 ± 1 | n.d. | 24 ± 3 | 285 ± 23 | 44 ± 3 | 42 ± 4 | 63 ± 4 | 22 ± 1 | 43 ± 2 | 17 ± 2 |
| Total | 40 | 27 | — | 36 | 324 | 56 | 57 | 72 | 33 | 58 | 17 |
| Total non-anthocyanins | 3093 | 2813 | 9516 | 8432 | 16853 |
3990 | 3579 | 3732 | 6624 | 6539 | 15541 |
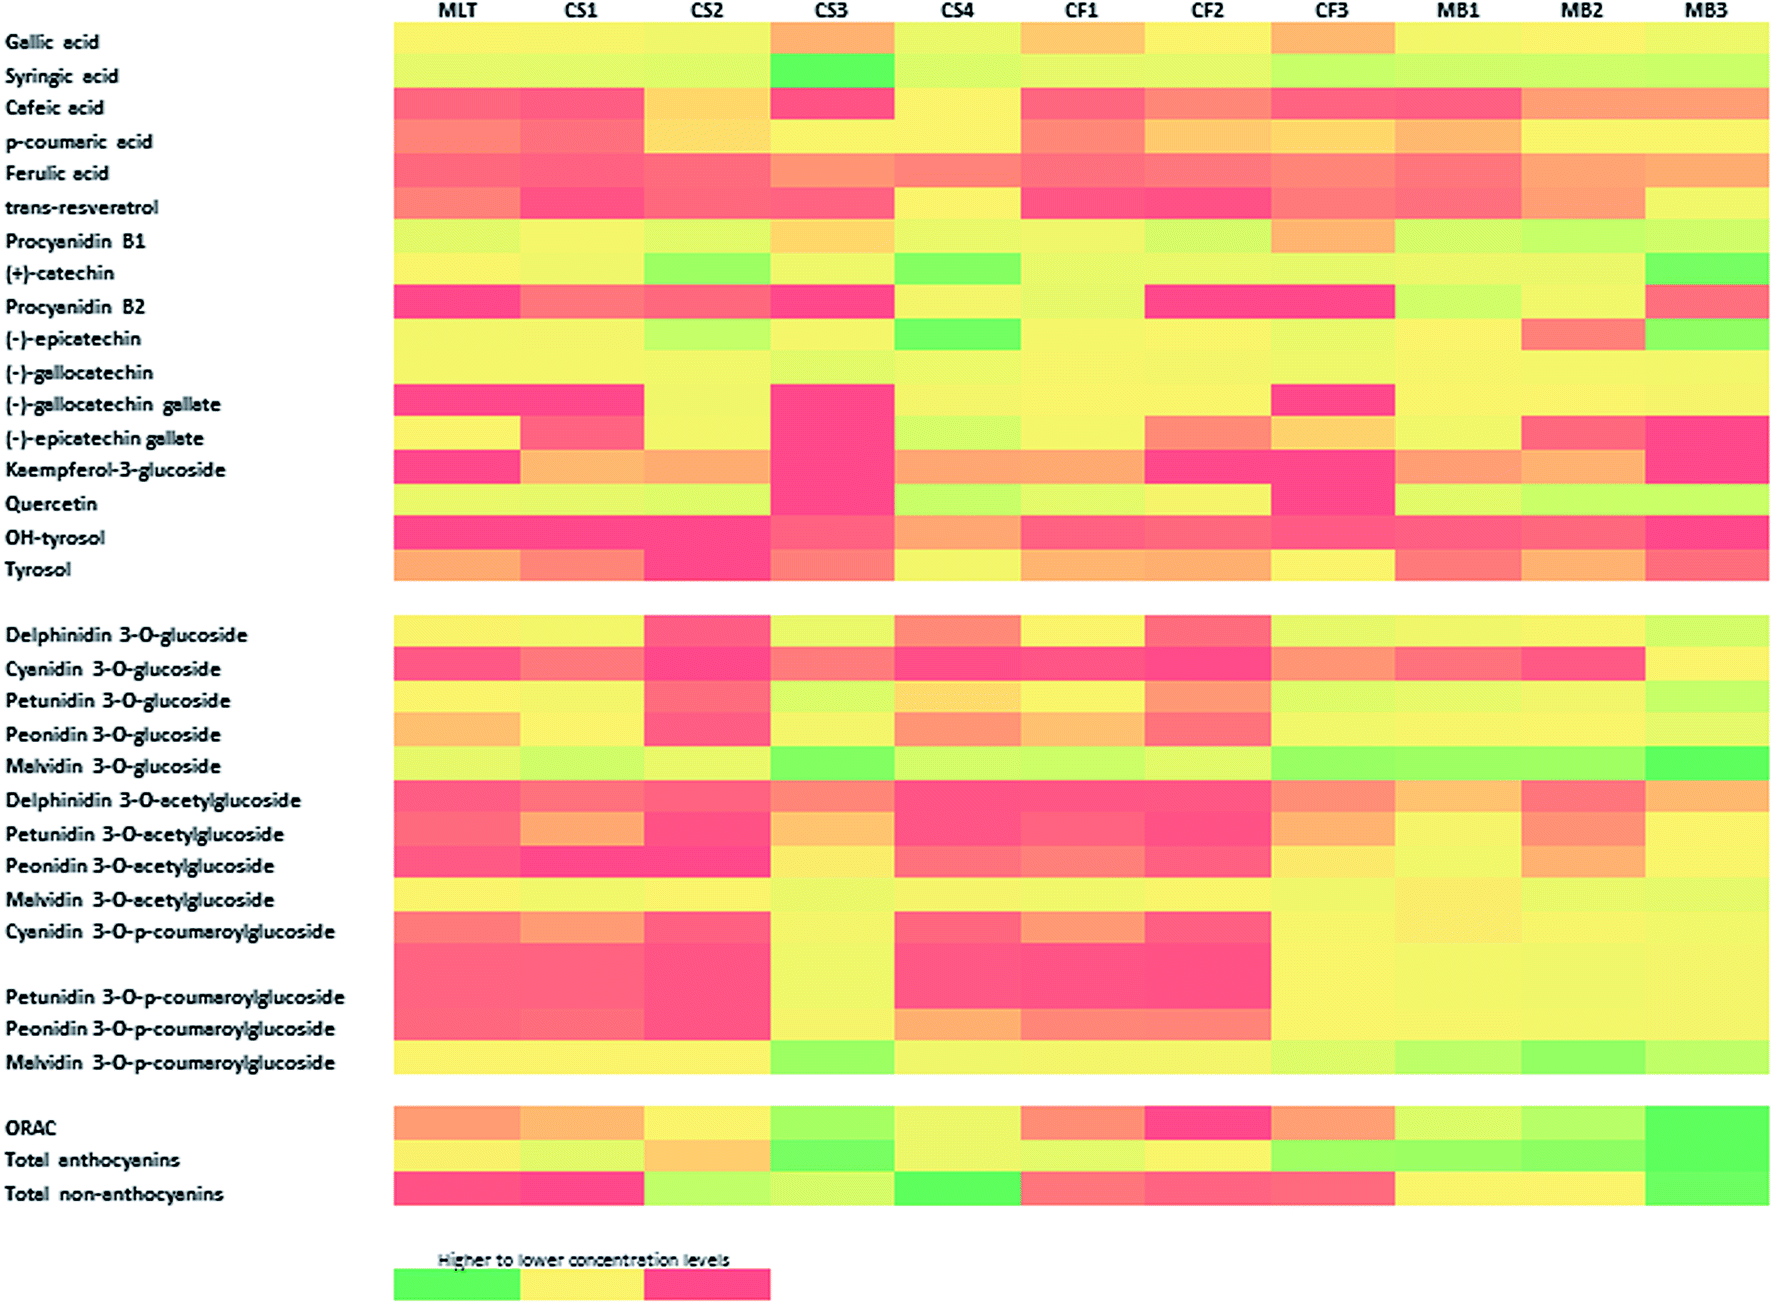 | ||
| Fig. 2 Heat-map of individual non-anthocyanins, anthocyanins, and antioxidant activity for each GPE sample. The green box indicates that a compound occurred at higher concentration than the mean level in a sample, and the red box means the metabolite was at a lower level. The medium colors represent intermediate concentrations between higher and lower values. | ||
The phenolic acids (gallic, syringic, caffeic, p-coumaric, and ferulic) were identified and quantified in all the analysed GPEs. The syringic acid (hydroxybenzoic family) was the most abundant, with the concentrations ranging between 720 (CF2) and 6665 μg g−1 (CS3). In fact, this compound was the most abundant in the CS3 sample, representing about 80% of the total non-anthocyanins compounds. However, less information is available about the origin of this compound, and it has been suggested that it is a product of the alkaline breakdown of malvidin-3-glucoside.32 Other authors also found high levels of this compound in the GPs of three autochthonous red grape cultivars (Vitis vinifera L.) of Portugal.33 In our case, we found a relation between the contents of malvidin-3-glucoside and syringic acid, where the samples with high content of this anthocyanin were those that had higher levels of the phenolic acid (see Fig. 2 and tables). In this sense, we proposed that the content of syringic acid is directly related to the anthocyanin levels. Moreover, by observing the overall data, it can be observed that sample CS3 presents high antioxidant activity (2700 μmol TE per g GPE), which also correlates with its high level of syringic acid (see Fig. 2). However, this sample also presents high level of anthocyanins; thus, it is difficult to directly associate these facts although the high concentrations of these compounds could act in a synergic way, increasing the antioxidant activity of the extract. Syringic acid is less known than other phenolic compounds, but it has been reported to possess a dose- and time-dependent inhibitory effect on cell proliferation of the hormone-sensitive breast cancer cell line,34 axon protective effects in rat sciatic nerve after ischemia/reperfusion injury,35 suppression of concanavalin a-induced liver injury in mice,36 and to prevent obesogenic diet-induced weight gain, adiposity, insulin resistance, dyslipidemia, and hepatosteatosis.37 Thus, considering the high levels of syringic acid found in GPEs and the abovementioned bioactive properties of this compound, future studies should be performed to establish its antioxidant properties and/or synergic effects with other phenolic compounds in different systems.
The phenylethanol derivative tyrosol was quantified in all the samples with the exception of CS2. The OH-tyrosol was found only in some samples at levels higher than 9 μg g−1. In a previous study, we found this compound at a 13 μg g−1 level in the Cabernet Sauvignon and Bonarda GPEs. The present study reports a maximum concentration of 39 μg g−1 for the CS4 sample. Contrary to those reported on other phenolic compounds, studies providing information about the concentration of OH-tyrosol in wine (or derivatives) are limited. When compared with other phenolic compounds, including tyrosol, OH-tyrosol showed a much more effective antioxidant character. This compound is relevant since it has shown antioxidant activity in vitro by scavenging peroxyl, hydroxyl and other free radicals, reactive nitrogen species (ROS) and superoxide anions, breaking peroxidative chain reactions, and preventing metal ion-catalysed production of ROS.38 Additionally, although the biological activities of phenolic compounds have been normally linked to their free radical scavenging activities, evidence supporting that OH-tyrosol may also offer an indirect protection by increasing the endogenous defence systems has been reported.38 Considering the probable synergic effects with other phenols in general, the quantification of OH-tyrosol could provide novel information to support the use of GPE as a complementary nutritional/pharmacological additive. In this sense, the present study provides new knowledge for the possible exploitation of new bioactive compounds in different applications related to the biotechnological industry. Moreover, this study can help us and other research groups to justify different beneficial effects achieved when these extracts are used in experimental models.
Other important compounds in the category of non-flavonoids are the stilbenes. They have significant antioxidative properties and nutritional applications; thus, their quantification in GPEs is relevant. The stilbene trans-resveratrol was found in all the studied samples at the concentrations ranging between 4 (CF2, Cabernet Franc 2015 from Altamira) and 328 (MB3) μg g−1 GPE. This high level is also correlated with higher antioxidant activities observed in this sample (see Fig. 1 and 2). In terms of the relative abundance of trans-resveratrol in each GPE variety, variable results were observed with lower levels than those found in previously reported studies for some samples as, well as similar or higher concentrations, such as those of MB3 which is, to the best of our knowledge, one of the highest levels reported for GPEs, were also observed.13,14,29,30,39,40 For the Argentinian GPE samples, our previous studies showed still quantifiable levels of trans-resveratrol, which ranged between 7 (Aspirant Bouchet, a teinturier grape variety) and 36 μg g−1 (Malbec variety).13,14 Other authors did not find this compound in the pomaces of Syrah, Merlot, and Cabernet Sauvignon cultivated in the San Juan province, Argentina.31 The cause of this ample variability is probably due to the fact that the amount of trans-resveratrol in wine grapes (and consequently its residues) widely varies depending on many factors such as grape variety, geographic region, agronomic factors, climatic factors, plant stress conditions, and oenological practices.38 This variability and the high levels obtained for some samples (i.e. MB3) highlight the necessity to evaluate the concentration of the compounds of interest for each application to take maximum advantage of the residues contents.
With respect to the flavonol content of the studied GPEs, quercetin was the most abundant compound detected and quantified in the studied GPEs, with the concentrations between 218 and 1695 μg g−1. The samples CS3 and CF3 did not present detectable levels of this compound. Quercetin concentrations obtained in this study for red GPEs of Cabernet Sauvignon, Merlot, Malbec, and Cabernet Franc are higher than those reported by Lingua et al. for grapes cultivated in Argentina31 (93–251 μg g−1, Syrah, Merlot, and Cabernet Sauvignon pomaces) and similar to those reported for Malbec (557 μg g−1), Cabernet Sauvignon (2092 μg g−1), and Bonarda (1675 μg g−1) GPEs.13,14
3.3. Anthocyanins profiling
The profile and concentration of anthocyanins of a given grape cultivar are closely linked to their genetic inheritance, whereas these intrinsic characteristics may also be influenced by environmental factors.41 However, the anthocyanin profiles of wine and by-products of winemaking may be different due to changes in the solid/liquid partition coefficients of individual compounds and their solubility in the wine. This fact can modulate the transfer of anthocyanins from grape to wine; thus, a residue with varying contents of compounds is obtained.30Table 2 summarizes the individual anthocyanin concentrations in the GPEs grouped based on the type of the derivative (non-acylated, acylated, and coumarylated), and Fig. 2 presents the results as a heat map. Fig. 3 shows an example of the elution profile for 13 anthocyanins present in the MB3 GPE; the obtained chromatograms showed similar elution profiles for each GPE. The anthocyanins found were similar to previously reported data for Malbec of Argentina.13 However, the presented data differ from the results presented by Lingua et al.31 for Cabernet Sauvignon and Merlot GPE. These authors did not find delphinidin 3-O-glucoside, cyanidin 3-O-glucoside, and delphinidin 3-O-acetylglucoside, whereas our results showed levels ranging between 674 and 7023 μg g−1 GPE for these compounds. The reason of this difference could be the type of extraction process used in each study. Apart from this, the phenolic compound profiles assessed in the present study were similar to those of other grape cultivars cultivated over the world: Cabernet Mitos, Cabernet Sauvignon, Merlot, Grenache, Syrah, Carignan Noir, Mourvèdre, Counoise, and Alicante Bouchet.20,42–44 For the Cabernet Franc variety, there is a previous study reporting the levels according to the type of anthocyanidin, but differentiation between non-acylated, acylated, and coumarylated derivatives, as well as their quantification was not carried out.45 Thus, the present study adds new information about anthocyanin composition and distribution in this grape variety.
| Anthocyanins | MLT | CS1 | CS2 | CS3 | CS4 | CF1 | CF2 | CF3 | MB1 | MB2 | MB3 |
|---|---|---|---|---|---|---|---|---|---|---|---|
| a Sample identification similar to that described in Fig. 1. | |||||||||||
| Delphinidin 3-O-glucoside | 1129 ± 16 | 2303 ± 32 | 748 ± 10 | 3667 ± 51 | 881 ± 12 | 1232 ± 17 | 797 ± 11 | 3981 ± 56 | 2611 ± 37 | 1602 ± 22 | 7023 ± 98 |
| Cyanidin 3-O-glucoside | 731 ± 8 | 832 ± 12 | 674 ± 9 | 840 ± 12 | 693 ± 10 | 718 ± 10 | 683 ± 10 | 910 ± 13 | 810 ± 11 | 737 ± 10 | 1131 ± 165 |
| Petunidin 3-O-glucoside | 1256 ± 20 | 2025 ± 28 | 794 ± 11 | 5708 ± 80 | 1080 ± 15 | 1427 ± 20 | 920 ± 13 | 5197 ± 73 | 3724 ± 52 | 2507 ± 35 | 9454 ± 132 |
| Peonidin 3-O-glucoside | 1016 ± 12 | 1265 ± 18 | 749 ± 10 | 2004 ± 28 | 911 ± 13 | 1022 ± 14 | 813 ± 11 | 2494 ± 35 | 1689 ± 24 | 1422 ± 20 | 4201 ± 59 |
| Malvidin 3-O-glucoside | 4057 ± 79 | 7540 ± 106 | 3525 ± 49 | 22674 ± 317 |
6925 ± 97 | 8216 ± 115 | 4709 ± 66 | 17422 ± 244 |
16488 ± 231 |
16135 ± 226 |
32056 ± 449 |
| Total glycosylated | 8189 | 13964 |
6489 | 34893 |
10489 |
12615 |
7923 | 30004 |
25322 |
22403 |
53866 |
| Delphinidin 3-O-acetylglucoside | 748 ± 8 | 808 ± 11 | 764 ± 11 | 873 ± 12 | 716 ± 10 | 726 ± 10 | 728 ± 10 | 894 ± 13 | 1024 ± 14 | 820 ± 11 | 1001 ± 14 |
| Petunidin 3-O-acetylglucoside | 788 ± 9 | 962 ± 13 | 706 ± 10 | 1029 ± 14 | 717 ± 10 | 762 ± 11 | 706 ± 10 | 987 ± 14 | 1866 ± 26 | 902 ± 13 | 1275 ± 18 |
| Peonidin 3-O-acetylglucoside | 734 ± 12 | 674 ± 9 | 674 ± 9 | 1119 ± 16 | 809 ± 11 | 850 ± 12 | 757 ± 11 | 1110 ± 16 | 2401 ± 34 | 986 ± 14 | 1485 ± 21 |
| Malvidin 3-O-acetylglucoside | 1242 ± 17 | 2382 ± 33 | 1203 ± 17 | 3381 ± 47 | 1909 ± 27 | 2468 ± 35 | 1482 ± 21 | 2682 ± 38 | 1120 ± 16 | 3607 ± 51 | 4136 ± 58 |
| Total acetylated | 3513 | 4827 | 3346 | 6402 | 4151 | 4806 | 3673 | 5672 | 6412 | 6315 | 7897 |
| Cyanidin 3-O-p-coumaroylglucoside | 833 ± 10 | 925 ± 13 | 756 ± 11 | 1937 ± 27 | 775 ± 11 | 923 ± 13 | 754 ± 11 | 1600 ± 22 | 1120 ± 16 | 1565 ± 22 | 2430 ± 34 |
| Petunidin 3-O-p-coumaroylglucoside | 767 ± 14 | 762 ± 11 | 720 ± 10 | 2767 ± 39 | 731 ± 10 | 714 ± 10 | 708 ± 10 | 1341 ± 19 | 2277 ± 32 | 2521 ± 35 | 1992 ± 28 |
| Peonidin 3-O-p-coumaroylglucoside | 776 ± 12 | 799 ± 11 | 722 ± 10 | 1901 ± 27 | 977 ± 14 | 871 ± 12 | 866 ± 12 | 1425 ± 20 | 1635 ± 23 | 2198 ± 31 | 2097 ± 29 |
| Malvidin 3-O-p-coumaroylglucoside | 1206 ± 51 | 1265 ± 18 | 1135 ± 16 | 16663 ± 233 |
2702 ± 38 | 2013 ± 28 | 2044 ± 29 | 5673 ± 79 | 10684 ± 150 |
18626 ± 261 |
10255 ± 144 |
| Total coumaroylated | 3581 | 3751 | 3333 | 23267 |
5184 | 4521 | 4372 | 10039 |
15715 |
24911 |
16774 |
| Total anthocyanins | 15283 |
22542 |
13169 |
64563 |
19824 |
21942 |
15968 |
45715 |
47449 |
53629 |
78537 |
| ∑Di-hydroxylated anthocyanins | 4091 | 4494 | 3575 | 7801 | 4164 | 4384 | 3873 | 7539 | 7655 | 6909 | 11344 |
| ∑Tri-hydroxylated anthocyanins | 11193 |
18048 |
9594 | 56762 |
15661 |
17558 |
12094 |
38176 |
39794 |
46720 |
67193 |
| Ratio tri/di-hydroxylated anthocyanins | 3 | 4 | 3 | 7 | 4 | 4 | 3 | 5 | 5 | 7 | 6 |
 | ||
| Fig. 3 Elution profile for the anthocyanins present in the freeze-dried MB3 GPE analyzed by HPLC-MWD. | ||
In terms of concentration, the data obtained showed differences in the amount of total anthocyanins according to the samples. As expected, malvidin 3-O-glucoside was the predominant compound, mostly followed by malvidin 3-O-p-coumaroylglucoside and malvidin 3-O-acetylglucoside (see Table 2 and Fig. 2). MB3 was the sample with highest content of total anthocyanins (78537 μg g−1 GPE) followed by CS3 (64563 μg g−1 GPE) and MB2 (53629 μg g−1 GPE). These results are in accordance with the spectrophotometric analysis of total anthocyanins. In terms of the anthocyanin distribution according to the type of anthocyanidin, the second most abundant anthocyanidin was petunidin. Differences in the content were observed between samples of the same grape variety, probably because GPE originated from diverse cultivation places and/or different winemaking procedures were performed that affected the final content of the phenolic compounds. Fig. 4a shows that the glucosylated derivatives were the most abundant group of pigments in GPEs (50% for CF3 and 69% for MB3) as compared to the acylated and coumarylated forms. Fig. 4b presents the stacked plots of the contents of two groups of anthocyanins: tri-hydroxylated (delphinidin, petunidin, and malvidin derivatives) and di-hydroxylated (cyanidin and peonidin derivatives). Similar to what has been reported for wines, the proportion of tri-hydroxylated derivatives was higher, but not with a regular distribution between varieties or different samples in each variety. Some authors proposed that the proportion of di-hydroxylated anthocyanins in Cabernet Sauvignon grapes is higher in the vineyards located in the valley zones with high altitudes.46 Thus, future studies will be performed to evaluate these facts in the grapes of the vineyards of Mendoza with the aim to establish the effect on the composition of the pomaces. In general, the samples, such as MB1, MB2, MB3, and CS3, with higher contents of anthocyanins and antioxidant activities also presented high proportion of di-hydroxylated anthocyanins, suggesting again a correlation between these variables.
 | ||
| Fig. 4 (a) Distribution of the anthocyanins based on the type of derivative (non acylated, acylated, and coumarylated); (b) stacked plots of the contents of tri-hydroxylated and di-hydroxylated anthocyanins. | ||
 | ||
| Fig. 5 PCA of the phenolic composition of pomace samples: (a) PCA scores of GPE samples. (b) PCA correlation loadings for the analysed compounds. | ||
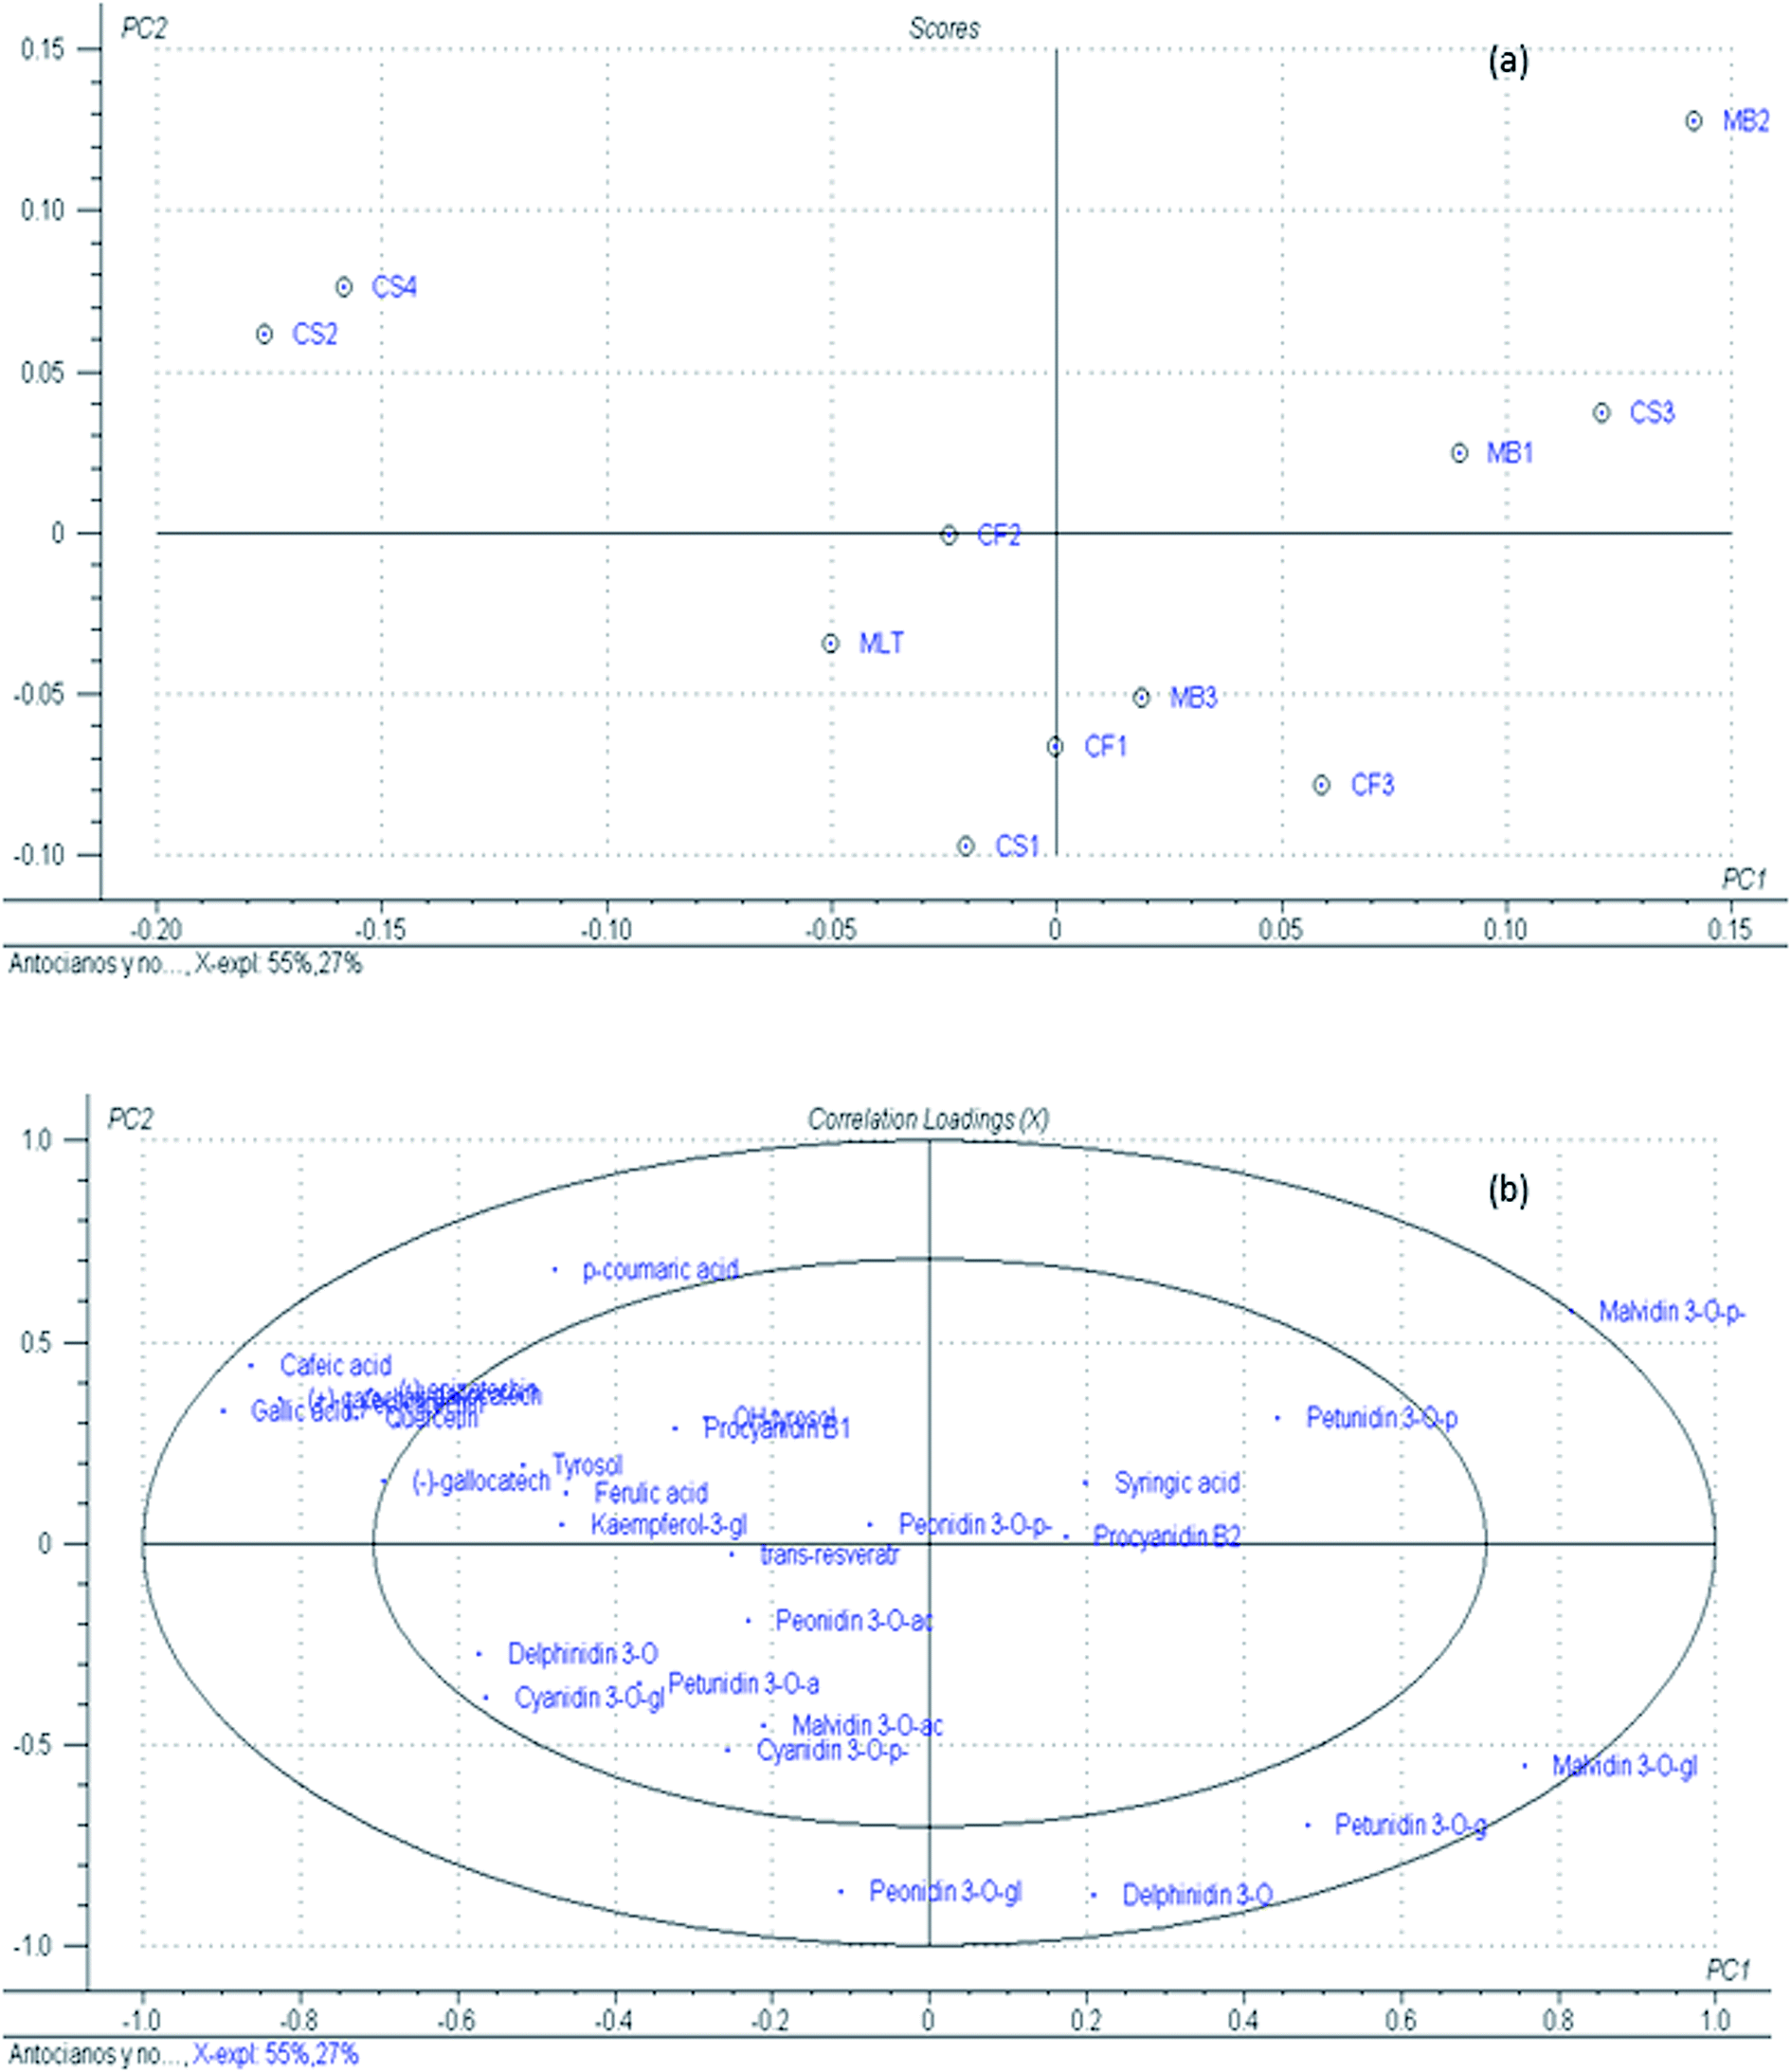
3.4. Principal component analysis (PCA)
As abovementioned, the investigated GPEs corresponded to different grape varieties, and differences in their phenolic profiles were observed. To assess the variations and examine the relationship between different types of GP based on their phenolic composition, a PCA was performed. Raw data of anthocyanins and non-anthocyanins were autoscaled to avoid the effect of different size variables, and 30 variables (compounds analyzed in each sample) were chosen as markers of the samples. Regarding the results presented in Fig. 5, more than 90% of the data variability has been described for the first 3 principal components, and PC1 and PC2 exhibit 55% and 27% data variability, respectively. PCA shows same trends among different samples and levels of phenolic compounds. Samples CS2 and CS4 appear as a group of discriminated samples in PC2, which are correlated with the correlation loading of the compounds caffeic acid, (+)-catechin, gallic acid, quercetin, and p-coumaric acid. Sample MB2 was well separated from the other samples characterized by high contents of malvidin 3-O-p-coumaroylglucoside in PC1. Besides these results, no trends were found among possible variety separation between analysed samples. As has been mentioned hereinafter, the reason for these results will be the factors involved in the winemaking processes, as well as genetic, vineyard conduction, and environmental conditions, that may affect the phenolic composition of the final residue after winemaking.3.5. Choice of GPE for applications
In light of the results reported in the present study, we established that pomaces from the Malbec, Merlot, Cabernet Sauvignon, and Cabernet Franc grape varieties had different phenolic compositions, showing diverse qualitative and quantitative profiles and varying antioxidant capacities. These differences are likely due either to differences in the availability of certain compounds among varieties, vintages, terroir-related effects or to the differences in the extraction processes during winemaking. The achieved data suggest that Malbec GPE appears as the most promising cultivar in terms of its high content of anthocyanins and non-anthocyanin compounds. A highlighting result is the presence of trans-resveratrol at the levels as high as 328 μg g−1 GPE for the sample MB3. These high contents of phenolics are well correlated with the achieved antioxidant activities and TPC for these samples, as can be observed from Fig. 2, specifically for the samples MB3, MB2, CS4, and CS3. Moreover, a high correlation between the summed concentrations of the individual anthocyanins and non-anthocyanins was observed, where samples with high levels of these compounds also presented higher antioxidative properties (Fig. 2). Note that Malbec is the main cv. produced in Argentina, representing 31% of the red grape area, and is considered as the emblematic wine cv. for the country. According to this, it is also the variety generating most residues. In this sense, the implementation of sustainable strategies to deactivate these pomaces will be useful from both the oenological and the environmental points of view. Knowledge of the profiles and properties of the samples will increase the value of a possible commercial product and help to make a decision in the selection of the most convenient GPE for industrial scale extraction. Moreover, as per the industry interest, i.e. the use of extracts as additives to add colour and antioxidants to food, some isolation process could be applied to enrich the extracts with the compounds of interest (anthocyanins). In addition, as an integrative application of these residues coming from and going to the food industry, some additional controls related to the possible presence of contaminants, such as mycotoxins or pesticide residues, should be kept in mind.474. Conclusions
In this study, qualitative and quantitative profiles of anthocyanins and non-anthocyanins of GPEs, obtained from different grape varieties cultivated in Argentina for red winemaking, were presented. A total of 30 compounds were determined. Samples were also evaluated via different spectrometric methods to determine the antioxidant activity, TPC, and total anthocyanins to find out a correlation with quantitative phenolics profiles. Malbec showed highest levels of the studied compounds, which were in agreement with the general parameters determined. The presence of OH-tyrosol was reported in several of the analyzed samples, adding new data related to a compound with high antioxidant properties that has not been reported in other grape varieties cultivated worldwide. In addition, high concentration levels of syringic acid were found, and a possible explanation of their levels was hypothesized. The overall data, presented in terms of antioxidant capacity and phenolic profiles of GPs, provides information for the winemaking industry to use the by-products as a low-cost source of bioactive compounds with imminent applicability in biotechnological industries. Moreover, the presented and discussed data will help to understand the possible synergic effects between phenolic compounds when the extracts are applied to experimental models.Acknowledgements
The authors are grateful for the funds provided by ANPCyT (BID-PICT 2013-0414, BID-PICT 2013-1856) and SECTyP-UNCuyo (2016, A042 and A050) to A. F., AA and R. B. The authors are fellows of CONICET and are also grateful to Roy Urvieta for providing the GP samples. A. D. F. thanks the Consejo Interuniversitario Nacional, Argentina for the scientific fellowship for students (EVC).References
- D. R. Kammerer, A. Schieber and R. Carle, J. Appl. Bot. Food Qual., 2005, 79, 189–196 CAS.
- A. Schieber, F. C. Stintzing and R. Carle, Trends Food Sci. Technol., 2001, 12, 401–413 CrossRef CAS.
- V. Tumbas Šaponjac, A. Gironés-Vilaplana, S. Djilas, P. Mena, G. Ćetković, D. A. Moreno, J. Čanadanović-Brunet, J. Vulić, S. Stajčić and M. Vinčić, RSC Adv., 2015, 5, 5397–5405 RSC.
- J. Balík, M. Kyseláková, J. Tříska, N. Vrchotová, J. Veverka, P. Hić, J. Totušek and D. Lefnerová, Czech J. Food Sci., 2008, 26, 3–12 Search PubMed.
- J. Garrido and F. Borges, Food Res. Int., 2013, 54, 1844–1858 CrossRef.
- A. R. Fontana, A. Antoniolli and R. Bottini, J. Agric. Food Chem., 2013, 61, 8987–9003 CrossRef CAS PubMed.
- J. Yu and M. Ahmedna, Int. J. Food Sci. Technol., 2013, 48, 221–237 CrossRef CAS.
- J. M. Landete, Crit. Rev. Food Sci. Nutr., 2012, 52, 936–948 CrossRef CAS PubMed.
- A. Greyling, R. M. Bruno, R. Draijer, T. Mulder, D. H. J. Thijssen, S. Taddei, A. Virdis and L. Ghiadoni, J. Funct. Foods, 2016, 27, 448–460 CrossRef CAS.
- C. Rodriguez Lanzi, D. J. Perdicaro, A. Antoniolli, A. R. Fontana, R. M. Miatello, R. Bottini and M. A. Vazquez Prieto, Food Funct., 2016, 7, 1544–1553 CAS.
- M. V. Baroni, R. D. Di Paola Naranjo, C. García-Ferreyra, S. Otaiza and D. A. Wunderlin, LWT–Food Sci. Technol., 2012, 47, 1–7 CrossRef CAS.
- M. Fanzone, Á. Peña-Neira, V. Jofre, M. Assof and F. Zamora, J. Agric. Food Chem., 2010, 58, 2388–2397 CrossRef CAS PubMed.
- A. Antoniolli, A. R. Fontana, P. Piccoli and R. Bottini, Food Chem., 2015, 178, 172–178 CrossRef CAS PubMed.
- A. R. Fontana, A. Antoniolli and R. Bottini, Food Chem., 2016, 192, 1–8 CrossRef CAS PubMed.
- G. Spigno and D. M. De Faveri, J. Food Eng., 2007, 78, 793–801 CrossRef CAS.
- P. Iacopini, M. Baldi, P. Storchi and L. Sebastiani, J. Food Compos. Anal., 2008, 21, 589–598 CrossRef CAS.
- B. Lorrain, I. Ky, L. Pechamat and P. L. Teissedre, Molecules, 2013, 18, 1076–1100 CrossRef CAS PubMed.
- A. de la Cerda-Carrasco, R. López-Solís, H. Nuñez-Kalasic, A. Peña-Neira and E. Obreque-Slier, J. Sci. Food Agric., 2015, 95, 1521–1527 CrossRef CAS PubMed.
- C. López-Alarcón and A. Denicola, Anal. Chim. Acta, 2013, 763, 1–10 CrossRef PubMed.
- I. Ky, B. Lorrain, N. Kolbas, A. Crozier and P. L. Teissedre, Molecules, 2014, 19, 482–506 CrossRef PubMed.
- S. Wang, M. Amigo-Benavent, R. Mateos, L. Bravo and B. Sarriá, Int. J. Food Sci. Nutr., 2017, 68, 188–200 CrossRef CAS PubMed.
- A. Boussenna, J. Cholet, N. Goncalves-Mendes, J. Joubert-Zakeyh, D. Fraisse, M.-P. Vasson, O. Texier and C. Felgines, J. Sci. Food Agric., 2016, 96, 1260–1268 CrossRef CAS PubMed.
- M. L. Cádiz-Gurrea, I. Borrás-Linares, J. Lozano-Sánchez, J. Joven, S. Fernández-Arroyo and A. Segura-Carretero, Int. J. Mol. Sci., 2017, 18(2), 376 CrossRef PubMed.
- A. M. Campos, C. Lopez-Alarcón and E. Lissi, J. Chil. Chem. Soc., 2013, 58, 2144–2147 CrossRef CAS.
- L. C. Carrillo, J. Londoño-Londoño and A. Gil, Food Res. Int., 2014, 60, 273–280 CrossRef CAS.
- A. Dávalos, C. Gómez-Cordovés and B. Bartolomé, J. Agric. Food Chem., 2004, 52, 48–54 CrossRef PubMed.
- S. Hogan, L. Zhang, J. Li, S. Sun, C. Canning and K. Zhou, Nutr. Metab., 2010, 7, 1–9 Search PubMed.
- J. K. Monrad, L. R. Howard, J. W. King, K. Srinivas and A. Mauromoustakos, J. Agric. Food Chem., 2010, 58, 2862–2868 CrossRef CAS PubMed.
- M. T. Barcia, P. B. Pertuzatti, D. Rodrigues, S. Gómez-Alonso, I. Hermosín-Gutiérrez and H. T. Godoy, Food Res. Int., 2014, 62, 500–513 CrossRef CAS.
- M. T. Barcia, P. B. Pertuzatti, S. Gómez-Alonso, H. T. Godoy and I. Hermosín-Gutiérrez, Food Chem., 2014, 159, 95–105 CrossRef CAS PubMed.
- M. S. Lingua, M. P. Fabani, D. A. Wunderlin and M. V. Baroni, Food Chem., 2016, 208, 228–238 CrossRef CAS PubMed.
- R. Jackson, Wine Science: Principles and Applications, Academic Press, Cambridge, 4th edn, 2014 Search PubMed.
- H. H. Tournour, M. A. Segundo, L. M. Magalhães, L. Barreiros, J. Queiroz and L. M. Cunha, Ind. Crops Prod., 2015, 74, 397–406 CrossRef CAS.
- M. Kampa, V.-I. Alexaki, G. Notas, A.-P. Nifli, A. Nistikaki, A. Hatzoglou, E. Bakogeorgou, E. Kouimtzoglou, G. Blekas, D. Boskou, A. Gravanis and E. Castanas, Breast Cancer Res., 2003, 6, R63 CrossRef PubMed.
- M. Tokmak, M. H. Sehitoglu, Y. Yuksel, M. Guven, T. Akman, A. B. Aras, U. Yaka, C. Gomleksiz, S. B. Albayrak and M. Cosar, Turkish Neurosurgery, 2017, 27(1), 124–132 Search PubMed.
- A. Itoh, K. Isoda, M. Kondoh, M. Kawase, M. Kobayashi, M. Tamesada and K. Yagi, Biol. Pharm. Bull., 2009, 32, 1215–1219 CAS.
- J. R. Ham, H.-I. Lee, R.-Y. Choi, M.-O. Sim, K.-I. Seo and M.-K. Lee, Food Funct., 2016, 7, 689–697 CAS.
- M. I. Fernández-Mar, R. Mateos, M. C. García-Parrilla, B. Puertas and E. Cantos-Villar, Food Chem., 2012, 130, 797–813 CrossRef.
- M. Careri, C. Corradini, L. Elviri, I. Nicoletti and I. Zagnoni, J. Agric. Food Chem., 2003, 51, 5226–5231 CrossRef CAS PubMed.
- A. A. Casazza, B. Aliakbarian, D. De Faveri, L. Fiori and P. Perego, J. Food Biochem., 2012, 36, 28–37 CrossRef CAS.
- P. R. Poudel, R. Mochioka, K. Beppu and I. Kataoka, J. Jpn. Soc. Hortic. Sci., 2009, 78, 169–174 CrossRef CAS.
- D. Kammerer, A. Claus, R. Carle and A. Schieber, J. Agric. Food Chem., 2004, 52, 4360–4367 CrossRef CAS PubMed.
- D. Kammerer, J. Gajdos Kljusuric, R. Carle and A. Schieber, Eur. Food Res. Technol., 2005, 220, 431–437 CrossRef CAS.
- L. F. Ribeiro, R. H. Ribani, T. M. G. Francisco, A. A. Soares, R. Pontarolo and C. W. I. Haminiuk, J. Chromatogr. B: Anal. Technol. Biomed. Life Sci., 2015, 1007, 72–80 CrossRef CAS PubMed.
- J. Thimothe, I. A. Bonsi, O. I. Padilla-Zakour and H. Koo, J. Agric. Food Chem., 2007, 55, 10200–10207 CrossRef CAS PubMed.
- Z. Li, Q. Pan, Z. Jin, L. Mu and C. Duan, Food Chem., 2011, 125, 77–83 CrossRef CAS.
- M. Solfrizzo, L. Piemontese, L. Gambacorta, R. Zivoli and F. Longobardi, J. Agric. Food Chem., 2015, 63, 3609–3614 CrossRef CAS PubMed.
| This journal is © The Royal Society of Chemistry 2017 |