 Open Access Article
A comparative study of the main constituents and antidepressant effects of raw and vinegar-baked Bupleuri Radix in rats subjected to chronic unpredictable mild stress†
Tianli Leia,
Yadan Wanga,
Mingxiao Lia,
Xin Zhanga,
Chongning Lva,
Lingyun Jiaa,
Jing Wangb and
Jincai Lu *a
*a
aDepartment of Medicinal Plants, School of Traditional Chinese Materia Medica, Shenyang Pharmaceutical University, Shenyang 110016, P. R. China. E-mail: jincailu@126.com; Fax: +86 024 23986500; Tel: +86 024 23986500
bDepartment of Pharmaceutical Botany, School of Traditional Chinese Materia Medica, Shenyang Pharmaceutical University, Shenyang 110016, P. R. China. E-mail: wangjingyk@126.com; Fax: +86 024 23986499; Tel: +86 024 23986499
First published on 27th June 2017
Abstract
Bupleuri Radix (BR) is a traditional Chinese medicine (TCM) widely used in Asian nations, which originates from Bupleurum chinense DC or Bupleurum scorzonerifolium Willd. It can be baked with vinegar to obtain vinegar-baked Bupleuri Radix (VBBR). It has been reported that VBBR exhibits more potential activity for relieving the effects of a depressed liver than BR. However, the antidepressant effects and underlying pharmacological mechanisms of BR and VBBR remain unclear. The present study identified the main chemical compositions in BR and VBBR. Furthermore, behavioral studies along with biochemical assessments, as well as 1H NMR analysis of the hippocampus and liver were employed to systematically assess the pathology of depression and therapeutic effects of BR and VBBR using a rat model of chronic unpredictable mild stress (CUMS)-induced depression. Behavioral studies demonstrated that treatment with VBBR resulted in better antidepressant effects than BR. And VBBR significantly regulated the levels of neurotransmitters in the hippocampus and frontal cortex. Additionally, twelve and ten metabolites from the hippocampus and liver were identified as potential biomarkers associated with depression. Such biomarkers are primarily involved in energy metabolism, amino acid metabolism, glycolysis, inositol phosphate metabolism, lipid metabolism and the TCA cycle. The results presented here showed that VBBR significantly reversed the pathological process of CUMS-induced depression, partially via regulation of the disturbed metabolic pathways. The comparative study facilitated a better understanding of the antidepressant mechanisms of BR and VBBR.
1. Introduction
Depression is a common mental disorder characterized by at least two weeks presenting with depressed mood, loss of interest/pleasure, feeling of guilt/low self-worth and disturbed sleep/appetite.1,2 Despite decades of clinical experience, the definite mechanism underlying the development of depression has not yet been entirely clarified. Nowadays, though many synthetic chemical antidepressants have been used clinically, one-third of patients remain treatment-resistant and even suffer a variety of undesirable side effects. In recent years, TCM has drawn increasing attention owing to its high therapeutic performance.Bupleuri Radix (named “chaihu” in China), the principal drug of many TCM prescriptions, is the root of Bupleurum chinense DC or B. scorzonerifolium Willd. It is widely used for the treatment of influenza, fever, inflammation and menstrual disorders,3 and it has also long been used to treat the symptoms of depression.4,5 Bupleuri Radix contains mainly saikosaponins, flavonoids, lignans and polyacetylenes.6,7 These saikosaponins are generally accepted to be the representative bioactive components, which have been shown to possess anti-inflammatory, antiviral and antitumor activity. Among them, SSa, SSc and SSd are the major bioactive constituents found in Bupleuri Radix; however, a variety of minor saikosaponins have also been isolated.8,9 Bupleuri Radix is documented in Chinese Pharmacopoeia (2015) in two forms, namely, raw (BR) and vinegar-baked Bupleuri Radix (VBBR). VBBR exhibits more potential activity for relieving the effects of a depressed liver than BR. Modern reports showed that VBBR is beneficial to bile secretion and is quite effective in curing liver related diseases such as jaundice, hepatitis, cirrhosis and liver cancer.10–12 In addition, when used in a TCM formula, VBBR is recognized as a meridian guide drug to strengthen the effects of other herbs on the liver and diminish their effects on other tissues.13,14 Recently, experimental studies have demonstrated that vinegar-processing could enhance the anti-depression effect of BR. HYPERLINK \l "bib15" \o "bib15 bib16" 15,16 However, the underlying pharmacological mechanisms of BR and VBBR remained ambiguous.
Presently, metabolomics has been regarded as the latest-omics strategy. It developed rapidly with multiple advanced approaches of NMR, LC-MS and GC-MS techniques, which provided powerful tools for interpreting metabolic profiles in biological samples.17–20 In this way, metabolomics has the potential to diagnose or prevent diseases in clinical practice, as well as to identify disease biomarkers.21,22 Among the aforementioned three widely applied methods, 1H NMR was selected because of some distinct advantages, such as rapidity, reproducibility, stability and non-selectiveness. In addition, detailed structural information about metabolites, including chemical shifts and coupling constants, can be directly obtained.23,24
Of the many regions of the brain affected by depression, the hippocampus is well known for its role in cognitive stress sensitivity. It is very important in the response to stress, especially in the adjustment to repeated stressful experiences.25 Stress damages the hippocampal structures. So far, it has been well accepted that long-lasting and severe stress can result in neuronal loss and synaptic dysfunction in the hippocampus, both of which are associated with negative mood, anxiety and impaired cognition, which constitute the core symptoms of major depression.26,27 Otherwise, the liver plays a pivotal role in metabolism and detoxification of endogenous and exogenous hepatotoxicants in the body.28 Moreover, according to the concepts of TCM, the liver is a very vulnerable organs to anger, stress and depression, resulting in liver-qi (gan-qi-yu-jie) stagnation, which are the etiological factors of depressive disorders.29 It is indispensable to examine the alteration in the hippocampus and liver metabolism after BR and VBBR administration to CUMS-induced rats.
Our main objective in the present study was to compare the main components and antidepressant effects of BR and its processed samples. For that we firstly analyzed the components using HPLC-DAD and UHPLC-QTOF-MS. Then, a well-validated CUMS model and a series of behavioral tests were employed to assess the antidepressant effects of BR and VBBR. The underlying mechanisms were estimated by investigating levels of neurotransmitters. In addition, integrated 1H NMR spectroscopy coupled with multivariate data analysis was used to screen and identify metabolic perturbations. This may facilitate an understanding of the anti-depressive effects and potential mechanisms of BR and VBBR.
2. Experimental
2.1 Reference compounds and reagents
Eight authentic saikosaponin standards, SSa, SSc, SSd, SSb1, SSb2, SSb3, SSb4 and SSf, were isolated and identified from the roots of B. chinense by our laboratory, and these saikosaponins (purity > 98%) were determined by Agilent HPLC-DAD. Acetonitrile (HPLC grade) was purchased from Fisher Corporation (Pittsburgh, PA, USA). Purified water was obtained in a Millipore-Q water purification system (Bedford, MA, USA). Fluoxetine (FLU) was purchased from Lilly S. A. (Alcobendas, Spain). D2O was purchased from Merck (Darmstadt, Germany). Sodium 3-trimethylsilyl[2,2,3,3-d4]propionate (TSP) was purchased from Cambridge Isotope Laboratories Inc. (MA, USA).2.2 Preparation of the decoction of BR and VBBR
BR was collected from Fangxian (Hebei, China) in October 2014, and authenticated by Prof. Jincai Lu (Department of Pharmacognosy, Shenyang Pharmaceutical University) as the root of Bupleurum chinense DC. VBBR was prepared using the method described in Chinese Pharmacopoeia (2015). Briefly, a slice of dried Bupleuri Radix (1 kg) was evenly mixed with 0.2 kg of vinegar, followed by immersion in a closed container for 24 h. Then the mixture was fried to nearly dry with gentle heat and taken out immediately. Voucher specimens for BR and VBBR are kept in the Pharmacognosy Laboratory of Shenyang Pharmaceutical University, Shenyang, China.Powdered BR (500 g) and VBBR (500 g) were extracted three times by refluxing with 70% ethanol (1![[thin space (1/6-em)]](https://www.rsc.org/images/entities/char_2009.gif) :
:![[thin space (1/6-em)]](https://www.rsc.org/images/entities/char_2009.gif) 8, w/v) for 1.5 h each time, and then the solutions were combined and evaporated to dryness. The yields of powdered extract of BR and VBBR were about 21.5% (w/w) and 22.6% (w/w), respectively. The concentrations of the decoctions of BR and VBBR were both about 1.0 g mL−1.
8, w/v) for 1.5 h each time, and then the solutions were combined and evaporated to dryness. The yields of powdered extract of BR and VBBR were about 21.5% (w/w) and 22.6% (w/w), respectively. The concentrations of the decoctions of BR and VBBR were both about 1.0 g mL−1.
2.3 Quality control of BR and VBBR
An HPLC fingerprint of BR and VBBR was performed according to the following procedure: dried powdered BR and VBBR (0.5 g) were extracted with 70% ethanol (25 mL) for 30 min under ultrasonication. After centrifugation, the supernatant was filtered for HPLC analysis. The HPLC analysis was performed on an Agilent 1260 HPLC system equipped with a binary pump and diode array detector (DAD). Chromatographic conditions are shown in ESI (S1†).The main components in BR and VBBR were further qualitatively analyzed. The UHPLC-QTOF-MS system consisted of an ACQUITY™ UPLC system (Waters, Milford, MA, USA) equipped with a Waters Xevo G2 QTOF (Waters, Manchester, UK) coupled to an electrospray ionization (ESI) source operating in negative ion mode. The acquisition and analysis of data were controlled by MassLynx 4.1 software. The chromatographic separation and MS analysis were conducted according to the method described in our previous study (submission being processed) (S2†).
The total amount of saikosaponins in BR and VBBR was determined by a colorimetric assay using UV spectrophotometry with SSa as standard according to the method in Appendix IV A in the Chinese Pharmacopoeia (2015). The wavelength was determined at 535 nm. This assay was done in triplicate for each sample.
2.4 Animal handing
Sprague-Dawley rats (male, 180–200 g) were purchased from the Experimental Animal Center of Shenyang Pharmaceutical University (no. SCXK2015-0001). Rats were maintained in controlled humidity (50 ± 10%) and temperature (22 ± 2 °C) with food and water freely available. The animals were acclimatized for 1 week in an SPF-grade lab and trained with a sucrose preference test before experiment. The procedures performed were in accordance with the National Institute of Health's Guidelines regarding the principles of animal care and approved by the Animal Ethics Committee of Shenyang Pharmaceutical University. Every effort was made to minimize animal suffering.The CUMS procedure was subjected to a series of chronic unpredictable stimuli, as previously described with slight modifications.30,31 Except for the control group, each rat was fed alone in a cage and was subjected to a series of stressors for 6 weeks: namely, food deprivation (24 h), water deprivation (23 h)/empty water bottles (1 h), physical restraint (activity restriction in bottle, 4 h), white noise (24 h), tail pinch (1 cm part of the tail, 5 min), cold water swimming (15 °C, 5 min), wet bedding (24 h), and day/night inversion (24 h). One of these stressors was assigned daily in an unpredictable manner to avoid the rat being able to predict it. The control group was left undisturbed without any stressor. The detailed protocol is shown in Table S1.†
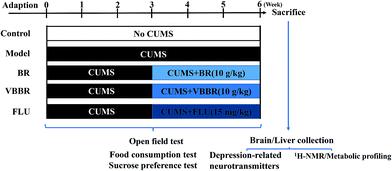
The rats were randomly separated into five groups (6 per group): control group (NS group), CUMS model group (MS group), FLU group (15 mg kg−1), BR group (10 g kg−1) and VBBR group (10 g kg−1), respectively. The corresponding weights of BR and VBBR extractions were 2.15 g kg−1 and 2.26 g kg−1, respectively. The NS group was left in the home cages, and the other groups were fed alone in a cage and were subject to a series of stressors. Rats were orally administered once each day at 10 mL kg−1 (rat body weight). While the NS group and MS group were perfused intragastrically with distilled water under similar conditions to the BR and VBBR groups. The rats were administered orally once daily 30 min before stimulation during the last 3 weeks. The experimental procedure is shown in Fig. 1.
2.5 Behavioral experiments
2.6 Measurement of neurotransmitter levels in the hippocampus and frontal cortex
After the final experiment, all rats were sacrificed by decapitation and the hippocampus and frontal cortex were rapidly dissected and weighed. Each tissue sample was homogenized in 0.2 M ice-cooled Na2HPO4/NaH2PO4 buffer solution in a proportion of 1![[thin space (1/6-em)]](https://www.rsc.org/images/entities/char_2009.gif) :
:![[thin space (1/6-em)]](https://www.rsc.org/images/entities/char_2009.gif) 9 (w/v). The homogenates were centrifuged at 16
9 (w/v). The homogenates were centrifuged at 16![[thin space (1/6-em)]](https://www.rsc.org/images/entities/char_2009.gif) 000 rpm at 4 °C for 10 min. The supernatant was reserved and the contents of DA, DOPAC, 5-HT and 5-HIAA were measured using ELISA kits (Shanghai YANJIN Biological Technology Co., Ltd.) strictly following the manufacturer's recommendations.
000 rpm at 4 °C for 10 min. The supernatant was reserved and the contents of DA, DOPAC, 5-HT and 5-HIAA were measured using ELISA kits (Shanghai YANJIN Biological Technology Co., Ltd.) strictly following the manufacturer's recommendations.
2.7 Sample collection for metabolomics study
After the final experiment, the whole brain and the liver of each rat were removed and chilled in an ice-cold saline solution. The samples were rapidly dissected and weighed. Then all samples were immediately frozen at −80 °C until further analysis.The hippocampus and liver samples were prepared according to published methods with minor modifications.34 Briefly, the samples were homogenized with saline in an ice/water bath, and were centrifuged at 16![[thin space (1/6-em)]](https://www.rsc.org/images/entities/char_2009.gif) 000 rpm at 4 °C for 10 min. Then 500 μL of supernatant was mixed with 100 μL of Na2HPO4/NaH2PO4 buffer solution (0.2 M, pH = 7.4) and 100 μL of TSP D2O solution (1.0 mg mL−1). After centrifugation at 16
000 rpm at 4 °C for 10 min. Then 500 μL of supernatant was mixed with 100 μL of Na2HPO4/NaH2PO4 buffer solution (0.2 M, pH = 7.4) and 100 μL of TSP D2O solution (1.0 mg mL−1). After centrifugation at 16![[thin space (1/6-em)]](https://www.rsc.org/images/entities/char_2009.gif) 000 rpm at 4 °C for 5 min, 600 μL of supernatant was piped into a 5 mm NMR tube for the NMR experiment.
000 rpm at 4 °C for 5 min, 600 μL of supernatant was piped into a 5 mm NMR tube for the NMR experiment.
2.8 1H NMR spectroscopic analysis
All 1H NMR spectra were measured at 298.2 K on a Brucker AV 600 MHz (Brucker, Germany) superconducting Fourier transform NMR spectrometer, operating at a frequency of 600.13 MHz 1H. For the hippocampus and liver samples, 1H NMR spectra were acquired using water-suppressed Carr–Purcell–Meiboom–Gill (CPMG) spectra by the pre-saturation method. A relaxation delay of 3.0 s and 4.0 s was used for the hippocampus and liver samples, respectively. For each sample, an acquisition time was set at 2.73 s. Each spectrum consisted of 64 scans with a spectral width of 12![[thin space (1/6-em)]](https://www.rsc.org/images/entities/char_2009.gif) 019.2 Hz and a spectral size of 65
019.2 Hz and a spectral size of 65![[thin space (1/6-em)]](https://www.rsc.org/images/entities/char_2009.gif) 536 points.
536 points.
2.9 NMR data processing and metabolomics analysis
All 1H NMR spectra were transformed by Fourier transformation, and then phased and baseline corrected using MestReNova software (Mestrelab Research, USA). For NMR data, the TSP acted as a chemical shift reference (δ 0.00 ppm) and the D2O provided a lock signal. Then, the region δ 0.50–9.00 ppm was reduced with a fixed width of 0.02 ppm. Before data normalization, the regions of δ 4.68–5.20 ppm and δ 3.30–3.34 ppm were excluded to eliminate the effects of residual water and CD3OD, respectively.The acquired data were imported to SIMCA-P 13.0 (Umetric, Sweden), and the data were mean-centered and Pareto-scaled before analysis. In this study, the unsupervised pattern recognition of PCA and the supervised pattern recognition of PLS-DA were adopted. The quality of the PLS-DA model was monitored by a permutation test, such as R2 for model interpretability and Q2 for model predictability, and values of R2 or Q2 close to 1 suggested a good prediction for the established models. S-plots and variable importance plot (VIP) values greater than 1.0 were selected and these metabolites were further analyzed by an independent sample t-test. Only variables with “VIP > 1.0” and “p < 0.05” were selected as potential chemical markers.
2.10 Statistical analysis
All experimental results were expressed as the mean ± SEM. The data were determined by SPSS 16.0 (SPSS, Inc, Chicago, USA), and were performed by one-way ANOVA followed by Tukey's LSD test. P-Values less than 0.05 were considered significant and values less than 0.01 were considered highly significant.3. Results
3.1 Chromatograms of BR and VBBR extracts and main constituents identified
HPLC was used to quantify eight main saikosaponins: SSa, SSc, SSd, SSb1, SSb2, SSb3, SSb4 and SSf. The contents of the eight saikosaponins and the total saikosaponins in BR and VBBR are listed in Table 1. The contents of SSb1 and SSb2 increased dramatically (p < 0.05), while the SSa, SSc, SSd, SSb3 and SSf decreased (p < 0.05) after the vinegar-baking process.| SSa | SSd | SSc | SSb1 | SSb2 | SSb3 | SSb4 | SSf | T | |
|---|---|---|---|---|---|---|---|---|---|
| a T represents the content of the total saikosaponins using a colorimetric method. BR, Bupleuri Radix; VBBR, vinegar-baked Bupleuri Radix; *means compared to BR (*p < 0.05, **p < 0.01,***p < 0.001). | |||||||||
| BR | 0.363 ± 0.006 | 0.339 ± 0.016 | 0.119 ± 0.005 | 0.046 ± 0.002 | 0.012 ± 0.003 | 0.146 ± 0.009 | 0.009 ± 0.001 | 0.105 ± 0.006 | 2.361 ± 0.027 |
| VBBR | 0.269 ± 0.009*** | 0.249 ± 0.007** | 0.092 ± 0.002** | 0.065 ± 0.005** | 0.042 ± 0.003*** | 0.021 ± 0.003*** | 0.007 ± 0.001 | 0.057 ± 0.004* | 2.414 ± 0.020 |
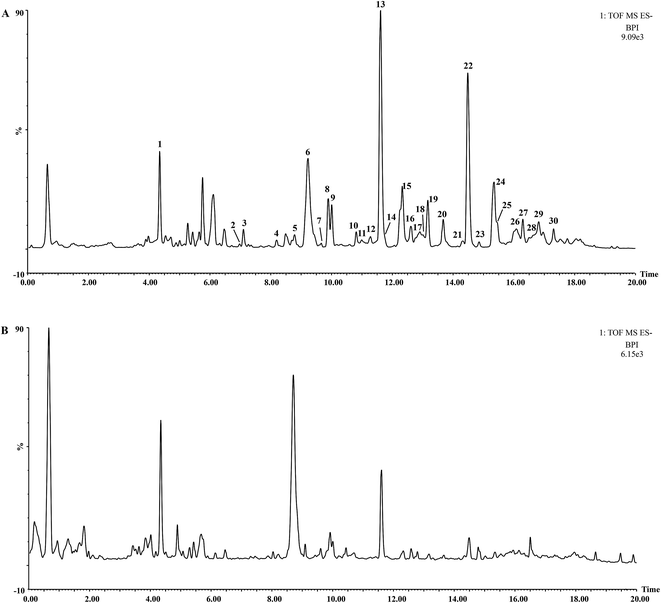
The UHPLC-QTOF-MS chromatograms of BR and VBBR are shown in Fig. 2, in which 30 characteristic peaks were assigned by matching the empirical molecular formula with that of the published compounds in Bupleuri Radix. The details are given in ESI (Table S2†). Taking 4′′-O-acetyl-SSa as an example, the identified results are shown in Fig. S1,† We could conclude that the major types of components, including saikosaponins, flavonoids and lignans, from Bupleuri Radix were detected and identified.
3.2 Effects of BR and VBBR on the body weight
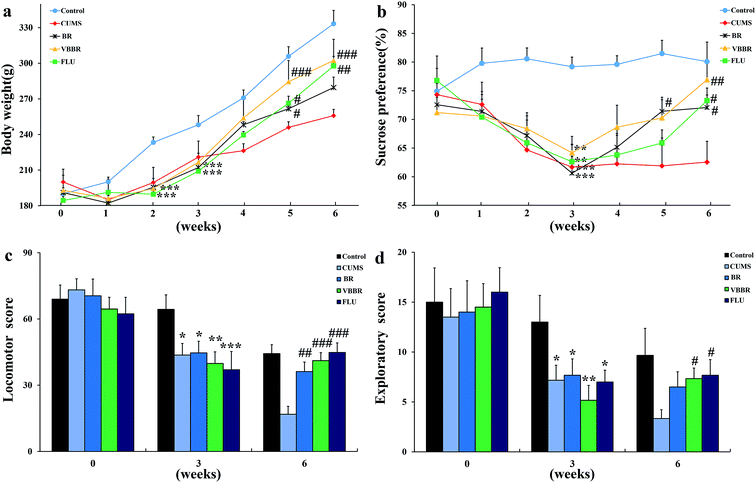
Body weight was used as a visual marker for CUMS-induced rats. The MS group was significantly reduced in body weight compared with the NS group rats (p < 0.01) (Fig. 3a) at the end of three weeks of CUMS protocol. This finding may be related to lower food intake. After 3 weeks' drug administration, the BR group showed significant elevation in body weight (p < 0.05), and the VBBR and FLU groups were remarkably increased (p < 0.01) when compared to the MS group. The body weight results indicated that VBBR has a better treatment effect on depressive rats.3.3 Effects of BR and VBBR on the sucrose preference test
In accordance with previous findings, all rats which had undergone CUMS displayed a significant decline in sucrose preference at the end of the third week (p < 0.01) (Fig. 3b). This result proved that the model was successfully established. After the administration of FLU, BR or VBBR for three weeks, this phenomenon was reversed, displaying a remarkable increase in the sucrose preferences of BR (p < 0.05), FLU and VBBR (p < 0.01) groups compared to the MS group, indicating that VBBR had an obvious effect on depressive rats.3.4 Effects of BR and VBBR on the open field test
OFT is commonly used to evaluate locomotor activity and exploratory behavior in experimental animals. Fig. 3c and d show the horizontal scores and vertical scores before, during and after the CUMS protocol. Following three weeks of CUMS procedure, the MS group displayed a significant decrease (p < 0.01) in the horizontal and vertical scores compared to the NS group, indicating that CUMS-induced rats had less locomotor activity and declined in curiosity in a new environment. After three weeks of treatment, both the horizontal and vertical scores were remarkably elevated compared to the MS group (p < 0.05). Of the BR and VBBR groups, the VBBR group revealed a significant reversion in the OFT (p < 0.01) compared to the MS group.3.5 Effects of BR and VBBR on neurotransmitters in the hippocampus and frontal cortex
As shown in Table 2, the CUMS procedure induced a significant reduction in DA, DOPAC, 5-HT and 5-HIAA in the hippocampus and frontal cortex compared with the NS group (p < 0.01 or p < 0.05). In the hippocampus, BR treatments only increased the DA levels (p < 0.05), while VBBR treatments could increase the 5-HT, 5-HIAA, DA and DOPAC significantly compared with the MS group (p < 0.05 or p < 0.01). In the frontal cortex, the VBBR treatments significantly increased 5-HT, 5-HIAA and DA levels (p < 0.05); however, the 5-HT, 5-HIAA, DA and DOPAC levels in the BR group showed no significant difference compared with the MS group. In all, the rats in VBBR showed a better trend of recovery.| Groups | Control (n = 6) | CUMS (n = 6) | CUMS + BR (10 g kg−1) | CUMS + VBBR (10 g kg−1) | CUMS + FLU (15 mg kg−1) |
|---|---|---|---|---|---|
| a Data represented as the mean ± SEM (n = 6/group). *p < 0.05, **p < 0.01 compared with the control group; #p < 0.05, ##p < 0.01 compared with the model group. | |||||
| Hippocampus | |||||
| 5-HT | 558.18 ± 43.73 | 401.68 ± 40.54* | 528.16 ± 52.17 | 552.01 ± 54.54# | 538.41 ± 40.34# |
| 5-HIAA | 78.57 ± 11.61 | 47.60 ± 7.46* | 76.56 ± 7.29 | 79.22 ± 11.03# | 74.52 ± 8.66# |
| DA | 591.72 ± 40.72 | 337.14 ± 22.03** | 478.07 ± 86.28# | 577.87 ± 56.97## | 495.55 ± 26.67# |
| DOPAC | 185.06 ± 13.53 | 131.76 ± 13.89** | 143.96 ± 21.76 | 208.09 ± 8.19# | 154.95 ± 23.69 |
![[thin space (1/6-em)]](https://www.rsc.org/images/entities/char_2009.gif) |
|||||
| Prefrontal cortex | |||||
| 5-HT | 629.55 ± 59.17 | 407.25 ± 76.10* | 567.43 ± 54.64 | 613.59 ± 44.49# | 585.72 ± 85.56 |
| 5-HIAA | 66.50 ± 11.74 | 46.25 ± 3.73* | 61.59 ± 10.72 | 69.54 ± 5.56# | 60.10 ± 8.37 |
| DA | 492.97 ± 147.16 | 382.57 ± 111.39 | 330.29 ± 63.32 | 497.52 ± 55.83# | 349.84 ± 98.29 |
| DOPAC | 152.22 ± 23.83 | 94.78 ± 7.99 | 120.56 ± 14.43 | 157.33 ± 26.09 | 154.38 ± 31.51 |
3.6 Metabolomics analysis based on 1H NMR
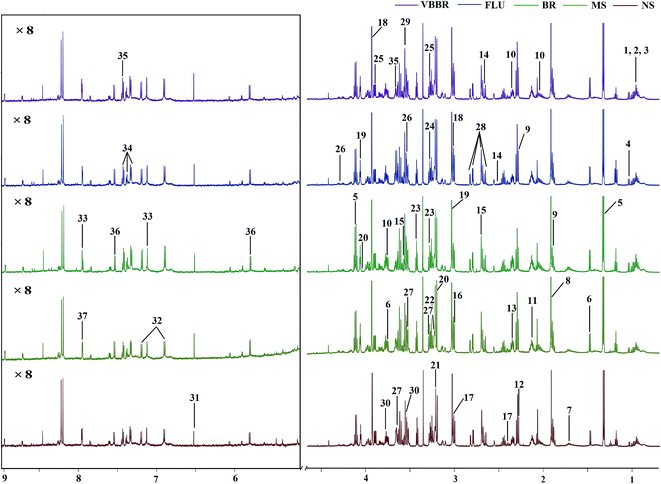
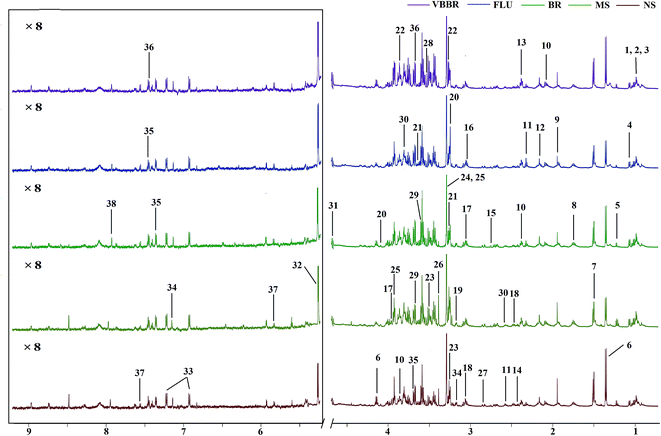
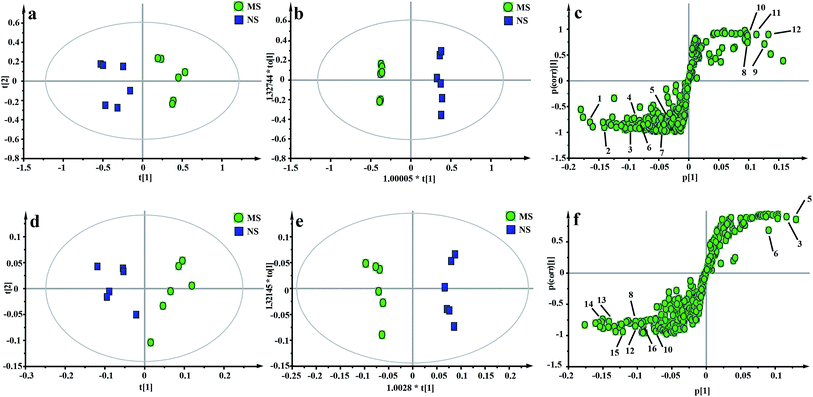
The representative 1H NMR spectra of the hippocampus and liver samples are depicted in Fig. 4 and 5. The major endogenous metabolites were identified based on their characteristic chemical shifts and multiplicities according to the literature and the Chenomx NMR Suite (Chenomx Inc., Alberta, Canada).35–37 The identified metabolites were assigned and labeled in the spectra. 1H NMR data and assignments are listed in Table S3(a and b†). The metabolomics results are presented using the PCA and OPLS-DA model (Fig. 6 and 7).The score plot of the hippocampus and liver samples (Fig. 6a, b, d and e) show an obvious separation, indicating that the CUMS model was successfully established. The OPLS-DA model parameters were as follows: (b) (R2X = 0.753, R2Y = 0.998, Q2 = 0.955), (e) (R2X = 0.728, R2Y = 0.935, Q2 = 0.899). Furthermore, a permutation test (permutation number: 200) was carried out to validate the robustness of the OPLS-DA model. As displayed in Fig. S2a and b,† either R2 or Q2 were higher than all the points on the left, indicating great predictability and goodness of fit. The corresponding S-plot (Fig. 6c and f) displayed an insight into the characteristic differential metabolites for the separation between MS and NS, including leucine, lactate, alanine, succinate, 2-oxoglutarate, sarcosine, creatine, creatinine, taurine, glycerol, myo-inositol and phenylalanine in the hippocampus and 2-oxoglutarate, taurine, glycine, α-glucose, β-glucose, choline, glycerol, leucine, alanine and lactate in the liver sample. These biochemical changes were regarded as a direct effect of the CUMS procedure.
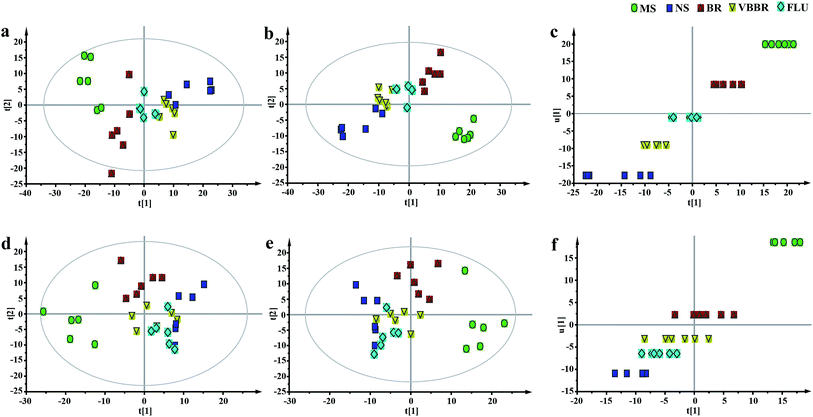
To obtain a global view of the response after the CUMS protocol and treatment, PCA and PLS-DA were established based on the five groups to reveal any possible variables contributing to the CUMS procedure or BR/VBBR treatment (Fig. 7a, b, d and e). The established PLS-DA model was performed to validate the model with permutation testing. The established models had high R2 and Q2 values, suggesting an overall goodness of fit (Fig. S2c and d†). Simultaneously, the clusters of FLU, BR and VBBR could clearly be separated in the PCA and PLS-DA models, and the VBBR group was located much closer to the NS than to the BR group in inner relation analysis (Fig. 7c and f), which indicated that VBBR resulted in the best regulating effect in restoring CUMS-induced metabolites to normal levels.
By employing the CUMS-induced rat model of depression and the 1H NMR metabolomics approach coupled with PCA and PLS-DA statistical analysis, twelve and ten metabolites were significantly altered in the hippocampal and liver tissue extracts, respectively. Compared with the NS group, the levels of lactate, alanine, succinate, glycerol, myo-inositol, choline, glycine and glucose increased in the MS group, while leucine, 2-oxoglutarate, sarcosine, creatine, creatinine, taurine and phenylalanine levels were reduced. Potential biomarkers and the results of trends in variables were identified, as listed in Table 3. As shown in Fig. 8, these metabolites were involved in the metabolic pathways of energy metabolism, amino acid metabolism, glycolysis, inositol phosphate metabolism, lipid metabolism and the tricarboxylic acid cycle (TCA cycle).
| Metabolite | Chemical shifta (ppm) | VIPb | FCc | Modeld | BRe | VBBRe | Pathways |
|---|---|---|---|---|---|---|---|
| a Multiplicity: s, singlet; d, doublet; t, triplet; q, quartet, m, multiplets.b VIP was obtained from OPLS-DA models (Fig. 6b and 5e).c Fold change (FC) was calculated as the ratio of the mean metabolite levels between the model and control groups. FC with a value > 1 indicates a relatively higher concentration while a value < 1 means a relatively lower concentration present in the model group compared with the controls.d Compared with the control group.e compared with the model group: ↑ indicates a relative increase in the signal, while ↓ indicates a relative decrease in the signal. Compared with control group: *p < 0.05, **p < 0.01; compared with model group: #p < 0.05, ##p < 0.01. | |||||||
| Hippocampus | |||||||
| Leucine | 0.97(d), 3.73(m), 1.70(m) | 1.73 | 0.48 | ↓** | ↑# | ↑## | Valine, leucine and isoleucine metabolism |
| Lactate | 1.33(d), 4.12(q) | 1.54 | 1.60 | ↑** | ↓# | ↓## | Glycolysis/gluconeogenesis |
| Alanine | 1.48(d), 3.73(m) | 1.88 | 1.50 | ↑** | ↓ | ↓## | Aspartate and amino acid metabolism |
| Succinate | 2.36(s) | 1.95 | 2.44 | ↑** | ↓# | ↓## | TCA cycle |
| 2-Oxoglutarate | 3.03(m), 2.42(m) | 1.12 | 0.37 | ↓** | ↓ | ↓## | TCA cycle |
| Sarcosine | 2.70(s), 3.60(s) | 2.04 | 0.64 | ↓** | ↓ | ↓# | Glycine, serine and threonine metabolism |
| Creatine | 3.02(s), 3.94(s) | 3.50 | 0.45 | ↓** | ↓ | ↓# | Energy and amino acid metabolism |
| Creatinine | 3.04(s), 4.07(s) | 3.21 | 0.47 | ↓** | ↓## | ↓## | Energy and amino acid metabolism |
| Taurine | 3.27(t), 3.43(t) | 2.17 | 0.49 | ↓** | ↓# | ↓## | Amino acid metabolism |
| Glycerol | 3.57(m), 3.79(m) | 1.72 | 2.36 | ↑** | ↓# | ↓# | Glycerolipid metabolism |
| Myo-inositol | 3.29(t), 3.54(dd), 3.62(m) | 1.99 | 1.84 | ↑** | ↓# | ↓## | Inositol phosphate metabolism |
| Phenylalanine | 7.33(d), 7.38(t), 7.43(t) | 1.09 | 0.30 | ↓** | ↓# | ↓## | Tyrosine metabolism |
![[thin space (1/6-em)]](https://www.rsc.org/images/entities/char_2009.gif) |
|||||||
| Liver | |||||||
| Leurine | 0.98(d), 3.73(m), 1.70(m) | 2.18 | 0.56 | ↓** | ↑ | ↑## | Valine, leucine and isoleucine metabolism |
| Lactate | 1.33(d), 4.12(q) | 2.46 | 1.42 | ↑** | ↓## | ↓## | Pyruvate metabolism |
| Alanine | 1.49(d), 3.73(m) | 1.86 | 1.35 | ↑** | ↓ | ↓## | Alanine, aspartate and glutamate metabolism |
| Choline | 3.21(s), 4.05(m) | 3.16 | 1.89 | ↑** | ↓# | ↓# | Lipid metabolism |
| 2-Oxoglutarate | 3.03(m), 2.43(m) | 1.10 | 0.39 | ↓** | ↑# | ↑## | TCA cycle |
| Taurine | 3.27(t), 3.41(t) | 3.61 | 0.42 | ↓** | ↑ | ↑## | Taurine and amino acid metabolism |
| Glycine | 3.55(s) | 2.71 | 1.84 | ↑** | ↓# | ↓## | Glycine, serine and threonine metabolism |
| Glycerol | 3.58(m), 3.78(m) | 1.75 | 1.55 | ↑** | ↓# | ↓## | Lipid metabolism |
| β-Glucose | 4.65(d) | 1.64 | 1.10 | ↑ | ↓## | ↓## | Glycolysis/gluconeogenesis |
| α-Glucose | 5.24(d) | 2.57 | 1.20 | ↑** | ↓# | ↓# | Glycolysis/gluconeogenesis |
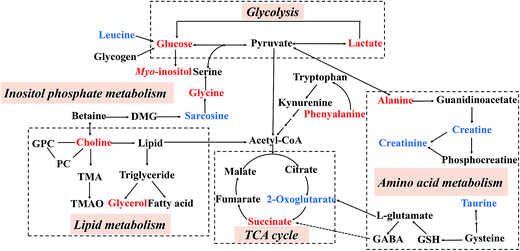 | ||
| Fig. 8 An overview of the metabolic pathways related to the CUMS-induced depression. Red: increased in the MS group; blue: decreased in the MS group. | ||
4. Discussion
Processing of herbal drugs has been a part of the heritage of Chinese medicine, and the importance of processing has been documented in the Huang Di Nei Jing for 2000 years. It has been proved that the processing procedure could reduce the toxicity and/or enhance the therapeutic effect after proper processing with parching, steaming and soaking, etc.38 Previous studies revealed the antidepressant effects of BR and VBBR in reserpine-induced hypothermia in mice and CUMS-induced depression models in mice.15,16 To the best of our knowledge, this study is the first to simultaneously compare the main constituents and antidepressant effects of BR and VBBR in a rat model of CUMS-induced depression. The current study revealed that the contents of components in BR were changed after being vinegar-baked. In addition, both BR and VBBR exerted anti-depressant effects against CUMS-induced depression, and VBBR showed a better recovery trend than that of BR, which is in accordance with the reported literature.16 Here in this study, the vinegar baking process caused an increase in SSb1 and SSb2, but a decrease in SSa, SSd, SSc, SSb3 and SSf. However, the anti-depressant effect of BR was not decreased after processing. Thus, SSb1 and SSb2, as well as other compounds in VBBR, may also contribute to the antidepressant therapy, some of which may possess a much stronger effect than those of SSa, SSd, SSc and SSf. To verify this result, antidepressant effects of BR and VBBR were further compared by OFT, SPF and body weight. The dramatic decrease in the sucrose consumption and locomotor activity confirmed that the depression model was successfully established. Notably, CUMS treatment with BR and VBBR for 3 weeks significantly reversed these behavioral changes in CUMS rats, suggesting that BR and VBBR had antidepressant effects, and the rats in VBBR showed a better trend of recovery.Considerable research has suggested that monoaminergic transmitters play a critical role in the modulation of depression. The reductions in major monoamine neurotransmitters, particularly 5-HT and DA as well as their metabolites, lead to depression.39 Consistent with previous reports, our current study also showed that the levels of neurotransmitters were lower in the hippocampus and frontal cortex of CUMS rats. However, both BR and VBBR treatment significantly increased DA levels in the hippocampus (p < 0.05, p < 0.01, respectively). Moreover, VBBR significantly increased 5-HT, 5-HIAA and DOPAC in the hippocampus and frontal cortex. Therefore, the above data suggested that VBBR exhibits more potential anti-depressant activity, partially by regulating the levels of neurotransmitters in the CUMS rats, particularly DA in the hippocampus and 5-HT in the prefrontal cortex.
The hippocampus plays an important role in the response to stress, especially in the adjustment to repeated stressful experiences.27 Meanwhile, the liver is a very vulnerable organ to anger, stress and depression, resulting in liver-qi (gan-qi-yu-jie) stagnation, which are the etiological factors of depressive disorders.29 To clarify the alteration in metabolism after the CUMS procedure and BR and VBBR administration, we used a 1H NMR method coupled with multivariate statistical analysis to screen and identify metabolic perturbations in the hippocampus and liver. In total, 37 and 38 metabolites were identified from the hippocampus and liver, respectively. Furthermore, twelve and ten metabolites from the hippocampus and liver showed significant perturbations induced by CUMS modeling.
Glycine is an inhibitory neurotransmitter in the central nervous system.40 Here in this study, CUMS modeling caused an increased in glycine, but this could be normalized following VBBR and FLU treatment. Additionally, leucine is the only dietary amino acid that can stimulate muscle protein synthesis,41 which was significantly decreased in CUMS-induced rats compared with the NS group. It was believed that the decrease in leucine in the MS group was possibly related to the loss of appetite.42 While loss of appetite was a common symptom in patients with depression. After treatment with BR and VBBR, the levels of glycine and leucine were restored to normal levels, indicating the reduced activity of ketogenesis.
Glycerol is a simple polyol compound that forms the carbon backbone of all triglycerides.43 The high level of glycerol in CUMS-induced rats may be caused by an increase in lipidolysis. In addition, choline, an important intermediate of lipid metabolism, forms phospholipids with major structural and functional roles in eukaryotic cell membranes. Experimental results have shown that the level of choline increased in depressive rats, indicating the metabolic dysfunction of the lipid metabolism when the rats were depressed, which was consistent with previous reports about depression or antidepressants.44,45 Additionally, the level of myo-inositol, a second messenger metabolite, was also high in the prefrontal cortex of patients with depression.46
2-Oxoglutarate plays an important role in maintaining the production of chemical energy through the TCA cycle. It is associated with energy metabolism.47 A reduction in 2-oxoglutarate in the depressed rats was indicative of TCA cycle dysfunction. Meanwhile, the increased succinate described in this study suggested that the normal process of the TCA cycle was disturbed after CUMS stimulation. Lactate, a part of the adaptive response, can be used to assess the severity of the supply imbalance. In the MS group, a high concentration of lactate may be caused by dysfunction in energy metabolism, and too much lactate can cause acidosis.48 Alanine, an aliphatic non-polar amino acid, can assist glucose metabolism, improving the body's energy supply.49 Our tentatively identified results agreed with those reported by J. L. Chen et al.50 The same biomarkers “lactate and alanine” were found as potential markers for depression in their CUMS rat livers. In the present study, the abnormal energy metabolism of CUMS rats was restored most after VBBR administration. That is, the levels of succinate, alanine and lactate could be down-regulated and 2-oxoglutarate could be up-regulated, suggesting that VBBR could improve the antidepressant effect caused by glycolysis, energy metabolism and TCA cycle.
Taurine is a kind of sulfur-containing amino acid. It has lots of biological functions, such as neuroprotective effects, the maintenance of membrane stability and modulation of calcium signaling. Taurine deficiency may present the main symptom of mental depression and it has been reported that it was deficient in nearly all depressed patients and taurine might represent a new adjuvant drug for the treatment of depression.51 Here in this study, the level of taurine was significantly decreased in the MS group. This is in agreement with previous reports that a lower level of taurine was found in the urine/brain tissues of CUMS rats.52,53 After BR/VBBR administration, an elevated level of taurine was observed, indicating that the anti-depressive effect of BR/VBBR may be associated with promoting the synthesis of taurine. However, the level of taurine changed most in the VBBR group, indicating that its therapeutic effect was much better than that of BR.
The concentration of α-glucose in the MS group was increased significantly. It has been reported that depression is correlated with glycolysis.54 Depression frequently occurs in patients with diabetes mellitus. Glycolysis may be affected by the abnormal secretion of depression-related hormones, and there are reports suggesting that antidepressant treatment is assumed to improve impaired glucose tolerance.55 After VBBR treatment, the levels of α-glucose and β-glucose tended to be normal, which indicated that VBBR can adjust the glycometabolic disorder caused by depression.
The significant decrease in creatine and creatinine in the MS group can produce a disorder of energy metabolism, which is an important pathological mechanism of depression. Creatinine is a breakdown product of creatine and it has been reported that the reduction of creatinine is connected with oxidative stress. Therefore, the decreased levels of creatinine and creatine in the MS rats indicates that depression may be caused by CUMS. Phenylalanine is an essential amino acid and it can be metabolized into tyrosine by the action of phenylalanine hydroxylase. In the present study, the increased level of hippocampus phenylalanine in MS rats might be due to a tryptophan metabolic disturbance induced by CUMS, which was not consistent with previous reports.52 Additionally, these metabolites, such as alanine, 2-oxoglutarate, sarcosine and creatine, were not regulated by BR, suggesting that there are differences between the treatment mechanisms of BR and VBBR.
5. Conclusion
In present study, the antidepressant effects in CUMS-induced rats were more potent when Bupleuri Radix was administered after vinegar processing (VBBR), which was correlated with changes in the contents of the main constituents in BR and VBBR. And the administration of VBBR synergistically antidepressant effects were displayed via the regulation of neurotransmitters and multiple metabolic pathways, primarily involving energy metabolism, amino acid metabolism, glycolysis, inositol phosphate metabolism, lipid metabolism and the TCA cycle. These findings could facilitate a better understanding of the antidepressant mechanisms of Bupleuri Radix.Conflicts of interest
The authors declare no conflict of interest.Abbreviations
| 5-HT | 5-Hydro-xytryptamine |
| 5-HIAA | 5-Hydroxyindole-3-acetic acid |
| CUMS | Chronic unpredictable mild stress |
| DA | Dopamine |
| DOPAC | 3,4-Dihydroxyphenylacetic acid |
| OFT | Open field test |
| OPLS-DA | Orthogonal partial least squares-discriminant analysis |
| PCA | Principal component analysis |
| PLS-DA | Partial least squares discriminant analysis |
| TCM | Traditional Chinese medicine |
Acknowledgements
This work was financially supported by the National Natural Science Foundation of China (Grant No. 81373900) and the Special Fund for TCM supported by State Administration of Traditional Chinese Medicine of China (No. 201407002).References
- B. L. Hankin, Epilepsy Behav., 2006, 8, 102–114 CrossRef PubMed.
- D. G. Perahia, D. Quail, D. Desaiah, A. L. Montejo and A. F. Schatzberg, J. Psychiatr. Res., 2009, 43, 512–518 CrossRef PubMed.
- Chinese Pharmacopoeia Commission, Pharmacopoeia of the People's Republic of China, China Medicine Science Press, Beijing, 2015 Search PubMed.
- B. Lee, I. Shim, H. Lee and D. H. Hahm, Biol. Pharm. Bull., 2009, 32, 1392–1398 CAS.
- M. K. Seo, J. C. Song, S. J. Lee, K. A. Koo, Y. K. Park, J. G. Lee, S. W. Park and Y. H. Kim, Eur. J. Integr. Med., 2012, 4, e392–e399 CrossRef.
- W. L. Chang, L. W. Chiu, J. H. Lai and H. C. Lin, Phytochemistry, 2003, 64, 1375–1379 CrossRef CAS PubMed.
- H. Q. Huang, X. Zhang, Y. H. Shen, J. Su, X. H. Liu, J. M. Tian, S. Lin, L. Shan and W. D. Zhang, J. Nat. Prod., 2009, 72, 2153–2157 CrossRef CAS PubMed.
- T. Li, Y. Y. Zhao, G. Z. Tu, B. Wang, S. Q. Cai and R. Y. Zhang, Phytochemistry, 1999, 50, 139–142 CrossRef CAS.
- Q. X. Liu, H. Liang, Y. Y. Zhao, B. Wang, W. X. Yang and Y. Yu, J. Asian Nat. Prod. Res., 2001, 3, 139–144 CrossRef CAS PubMed.
- R. Z. Zhao, D. Yuan, S. J. Liu, Y. J. Chen, L. J. Liu and Y. Zhao, J. Ethnopharmacol., 2010, 132, 421–428 CrossRef PubMed.
- M. L. Ashour and M. Wink, J. Pharm. Pharmacol., 2011, 63, 305–321 CrossRef CAS PubMed.
- X. Z. Chen, T. Y. Yu, Z. X. Chen, R. Z. Zhao and S. R. Mao, Xenobiotica, 2014, 44, 785–791 CrossRef CAS PubMed.
- R. Zhao, S. Liu, S. Mao and Y. Wang, J. Ethnopharmacol., 2009, 126, 415–420 CrossRef CAS PubMed.
- R. Z. Zhao, D. Yuan, S. J. Liu, Y. J. Chen, L. J. Liu and Y. Zhao, J. Ethnopharmacol., 2010, 132, 421–428 CrossRef PubMed.
- L. N. Wang, W. Wang and T. Z. Jia, Asia-Pacific Traditional Medicine, 2014, 10, 4–6 Search PubMed.
- W. Wang, Y. H. Chen, L. N. Wang, T. Xu and T. Z. Jia, Chin. Tradit. Pat. Med., 2014, 36, 617–619 Search PubMed.
- R. Daouk, B. S. Kristal and R. M. Weinshilboum, Annu. Rev. Pharmacol. Toxicol., 2008, 48, 653–683 CrossRef PubMed.
- S. Sethi and E. Brietzke, Int. J. Neuropsychopharmacol., 2015, 19, pyv096 CrossRef PubMed.
- J. C. Lindon, E. Holmes and J. K. Nicholson, Expert Rev. Mol. Diagn., 2004, 4, 189–199 CrossRef CAS PubMed.
- Q. Liang, H. Liu, T. Y. Zhang, Y. Jiang, H. T. Xing and A. H. Zhang, RSC Adv., 2016, 6, 3586–3591 RSC.
- R. K. Daouk, B. S. Kristal and R. M. Weinshilboum, Annu. Rev. Pharmacol. Toxicol., 2008, 48, 653–683 CrossRef PubMed.
- X. J. Liu, Y. Z. Zhou, Z. F. Li, J. Cui, Z. Y. Li, X. X. Gao, H. F. Sun and X. M. Qin, J. Pharm. Pharmacol., 2011, 64, 578–588 CrossRef PubMed.
- J. K. Nicholson, J. Connelly, J. C. Lindon and E. Holmes, Nat. Rev. Drug Discovery, 2002, 1, 153–161 CrossRef CAS PubMed.
- Y. J. Sun, H. P. Wang, Y. J. Liang, L. Yang, W. Li and Y. J. Wu, J. Proteome Res., 2012, 11, 2544–2550 CrossRef CAS PubMed.
- M. Joels, H. Karst, H. J. Krugers and P. J. Lucassen, Front. Neuroendocrinol., 2007, 28, 72–96 CrossRef PubMed.
- B. A. Apfel, J. Ross, J. Hlavin, D. J. Meyerhoff, T. J. Metzler, C. R. Marmar, M. W. Weiner, N. Schuff and T. C. Neylan, Biol. Psychiatry, 2011, 69, 541–548 CrossRef PubMed.
- C. A. Stockmeier, G. J. Mahajan, L. C. Konick, J. C. Overholser, G. J. Jurjus, H. Y. Meltzer, H. B. Uylings, L. Friedman and G. Rajkowska, Biol. Psychiatry, 2004, 56, 640–650 CrossRef PubMed.
- M. Chen, Y. Q. Wang, Y. Zhao, L. Q. Wang, J. B. Gong, L. Wu, X. J. Gao, Z. H. Yang and L. J. Qian, Biochim. Biophys. Acta, Proteins Proteomics, 2009, 794, 1751–1765 CrossRef PubMed.
- Y. T. Wang, Q. R. Tan, L. L. Sun, J. Cao, K. F. Dou, B. Xia and W. Wang, Neurosci. Lett., 2009, 449, 215–219 CrossRef CAS PubMed.
- V. S. Murua, R. A. Gomez, M. E. Andrea and V. A. Molina, Pharmacol., Biochem. Behav., 1991, 38, 125–130 CrossRef CAS.
- M. Nollet, A. M. Guisquet and C. Belzung, Curr. Protoc. Pharmacol., 2013, ch. 5, unit 565 Search PubMed.
- P. Willner, A. Towell, D. Sampson, S. Sophokleous and R. Muscat, Psychopharmacology, 1987, 93, 358–364 CrossRef CAS PubMed.
- L. M. Monteggia, B. Luikart, M. Barrot, D. Theobold, I. Malkovska, S. Nef, L. F. Parada and E. J. Nestler, Biol. Psychiatry, 2007, 61, 187–197 CrossRef CAS PubMed.
- H. Gao, Y. Xiang, N. Sun, H. Zhu and Y. Wang, Neurochem. Int., 2007, 50, 386–394 CrossRef CAS PubMed.
- M. E. Bollard, S. Garrod, E. Holmes, J. C. Lincoln, E. Humpfer and M. Spraul, Magn. Reson. Med., 2000, 44, 201–207 CrossRef CAS PubMed.
- W. M. Fan, Prog. Nucl. Magn. Reson. Spectrosc., 1996, 28, 161–219 CrossRef.
- J. L. Chen, B. Y. Shi, H. Xiang, W. J. Hou, X. M. Qin, J. S. Tian and G. H. Du, J. Pharm. Biomed. Anal., 2015, 115, 150–158 CrossRef CAS PubMed.
- J. Singhuber, M. Zhu and S. Prinz, J. Ethnopharmacol., 2009, 126, 18–30 CrossRef PubMed.
- K. Chopra, B. Kumar and A. Kuhad, Expert Opin. Ther. Targets, 2011, 15, 379–400 CrossRef PubMed.
- Y. Ni, M. Su, J. Lin, X. Wang, Y. Qiu, A. Zhao, T. Chen and W. Jia, FEBS Lett., 2008, 582, 2627–2636 CrossRef CAS PubMed.
- M. R. Etzel, J. Nutr., 2004, 134, 996S–1002S CAS.
- P. Riederer, K. Toifl and P. Kruzik, Clin. Chim. Acta, 1982, 123, 27–32 CrossRef CAS.
- G. Chen, D. Yang, Y. Yang, J. Li, K. Cheng, G. Tang, R. Zhang, J. Zhou, W. Li and Z. Liu, Behav. Brain Res., 2015, 278, 286–292 CrossRef CAS PubMed.
- B. Tang, J. Ding, Y. Yang, F. Wu and F. Song, J. Ethnopharmacol., 2014, 153, 511–520 CrossRef PubMed.
- H. W. Wu, P. Wang, M. T. Liu, L. Y. Tang, J. Fang, Y. Zhao, Y. Zhang, D. F. Li, H. Y. Xu and H. J. Yang, Molecules, 2015, 20, 10047–10064 CrossRef CAS PubMed.
- J. F. Lirng, H. C. Chen, J. L. Fuh, C. F. Tsai, J. F. Liang and S. J. Wang, Cephalalgia, 2015, 35, 702–709 CrossRef PubMed.
- A. Serretti, L. Mandelli, E. Lattuada and E. Smeraldi, Psychiatry Res., 2004, 127, 85–99 CrossRef PubMed.
- X. Chen, Y. X. Yang and S. M. Wang, Chin. Tradit. Herb. Drugs, 2012, 43, 97–102 Search PubMed.
- R. Odessey, E. A. Khairallah and A. L. Goldberg, J. Biol. Chem., 1974, 249, 7623–7629 CAS.
- J. L. Chen, B. Y. Shi, H. Xiang, W. J. Hou, X. M. Qin, J. S. Tian and G. H. Du, J. Pharm. Biomed. Anal., 2015, 115, 150–158 CrossRef CAS PubMed.
- G. Caletti, D. B. Olguins, E. F. Pedrollo, H. M. Barros and R. Gomez, Amino Acids, 2012, 43, 1525–1533 CrossRef CAS PubMed.
- H. L. Du, K. Q. Wang, L. Su, H. X. Zhao, S. Y. Gao, Q. S. Lin, X. F. Ma, B. K. Zhu, X. Dong and Z. Y. Lou, J. Pharm. Biomed. Anal., 2016, 128, 469–479 CrossRef CAS PubMed.
- M. J. Gong, B. Han, S. M. Wang, S. W. Liang and Z. J. Zou, J. Pharm. Biomed. Anal., 2016, 123, 63–73 CrossRef CAS PubMed.
- G. Paolisso, M. R. Tagliamonte, M. R. Rizzo and D. Giugliano, Eur. J. Clin. Invest., 1999, 29, 758–769 CrossRef CAS PubMed.
- J. M. Hennings, M. Ising, S. Grautoff, H. Himmerich, T. Pollmächer and L. Schaaf, Exp. Clin. Endocrinol. Diabetes, 2010, 118, 98–100 CrossRef CAS PubMed.
Footnote |
| † Electronic supplementary information (ESI) available. See DOI: 10.1039/c7ra04724j |
| This journal is © The Royal Society of Chemistry 2017 |

