 Open Access Article
Creative Commons Attribution 3.0 Unported Licence
Enhanced photocatalytic activity for degrading phenol in seawater by TiO2-based catalysts under weak light irradiation†
Ting Wang,
Zhi-yong Xu,
Li-guang Wu *,
Bing-rui Li,
Mei-xi Chen,
Shi-yi Xue,
Yi-chen Zhu and
Jing Cai
School of Environmental Science and Engineering, Zhejiang Gongshang University, Hangzhou, 310012, China. E-mail: wulg64@hotmail.com
First published on 21st June 2017
Abstract
The seawater system is a typical salt water system. A catalyst should overcome the disturbance from the salt ions for an efficient photodegradation of organic pollutants in the seawater system. Commercial photocatalysts (P25) and La3+-doped SiO2–TiO2 prepared using adsorbed-layer nanoreactor synthesis (ALNS) were first used for photodegrading different initial concentrations of phenol in seawater under weak UV light irradiation. The weak adsorption capacities for phenol and the hydrophilic surfaces of the two photocatalysts could not overcome the disturbance of salt ions and thus showed low photocatalytic activities. Based on this, graphene oxide (GO) was used as a support to prepare TiO2 and La3+-doped TiO2 using ALNS. The solvothermal treatment with alcohol was used as a solvent for both TiO2 crystallization and GO reduction. Results showed that TiO2 nanoparticles with sizes <10 nm formed and distributed homogeneously on the reduced GO surface. The small size of the TiO2 particles and the decreased oxygenated functional groups on the GO surface both caused high separation efficiency of the photogenerated charge carriers, thereby increasing the photodegradation performance. The strong phenol adsorption of the photocatalyst was efficient enough to overcome the interference of salt ions and enhance the photodegradation efficiency in seawater. The activities of the two Red–GO–TiO2 catalysts were more than twice those of P25 and La3+-doped SiO2–TiO2. La3+ doping caused mixed crystals to form and increased the shallow trapping sites for charge carriers. Therefore, La3+ doping increases the photocatalytic activity of Red–GO–TiO2.
Introduction
The rapid development of industry has initiated numerous environmental pollution problems.1,2 For example, the ocean is facing difficult organic pollution problems due to terrestrial pollutant emissions and numerous sailing ships.3,4 The marine system is first a typical salt water system (salt concentration is generally between 3–5%) that interferes with traditional treatment technologies, such as microbial degradation, for organic pollutants.5,6 Second, the organic pollutant concentration in seawater is low; therefore, effective treatments using traditional adsorption technology are costly and difficult.7 At present, few studies have focused on effectively eliminating organic pollutants from seawater. For decades, developing advanced oxidation technologies has provided new ideas for removing organic pollutants in the ocean.8 TiO2-based heterogeneous semiconductor photocatalysis is the most intensively studied technology for pollutant treatment among advanced oxidation technologies, because of its low energy consumption and pollution-free process.9–11 Especially, heterogeneous photocatalysis shows excellent potential in degrading highly toxic organic pollutants with low concentration. In heterogeneous photocatalysis, small TiO2 particles, especially the quantum-sized TiO2 particles (less than 10 nm), show high activity.12–14 However, small nanoparticles easily agglomerate during preparation and application to form large particles and reduce or even halt the catalytic activity. To mediate particle agglomeration, supported catalysts have been presented and prepared in numerous studies.15,16 Considering its enhanced light adsorption and separation of photogenerated carriers, SiO2 and new carbon nanomaterials (carbon nanotubes and graphene) have the high potential as support materials.17,18However, high-power light sources, such as high-pressure mercury that emit several hundred watts, were used in most studies as excitation light sources.19,20 The intensities of these high-power light sources significantly exceed the strong natural sunlight environment with a light intensity of 1 W cm−2.21 In marine environments, light intensity is usually less than 1 mW cm−2. Therefore, the strong-intensity light sources used in present studies limit the practical application of heterogeneous photocatalysis for eliminating organic pollutants from the ocean.19,20 Fujishima first studied photocatalysis using a low-intensity light system and found that short carbon-chain alcohols and bacteria could be photodegraded using TiO2 films under weak UV light irradiation.22–24 Moreover, the quantum yield of photoreaction under weak UV light irradiation was visibly higher than that of the photodegradation excited by the strong UV light.19 In our previous work,25 TiO2 with a quantum size of less than 7 nm and prepared using adsorbed-layer nanoreactor synthesis (ALNS) showed higher activity in photodegrading methyl orange under weak light irradiation compared with P25 commercial photocatalyst. Given the formation of few photogenerated charge carriers excited by weak light irradiation, the structure–activity relationship of catalysts was more sensitive than that under strong light irradiation.
One challenging aspect still remains regarding the use of heterogeneous photocatalysis in seawater systems. Numerous salt ions often decrease photocatalytic activity or cause photocatalyst inactivation.26–29 Based on studies and our previous work,30,31 the photodegradation for phenol by P25 and La3+-doped SiO2–TiO2 via ALNS in seawater under weak UV light irradiation was first accomplished; afterward, TiO2 particles and La3+-doped TiO2 particles with graphene oxide (GO) as a support were prepared using ALNS. A solvothermal treatment with alcohol as the reducing agent was used for both TiO2 crystallization and GO reduction to enhance the photocatalytic activity for phenol in seawater.
Experimental
Materials
Graphite powder (G, 8000 mesh) was purchased from the Reagent Chemical Manufacturing (Shanghai, China). H2SO4, KMnO4, NaNO3, and lanthanum nitrate La(NO3)3 were obtained from Shanghai Reagent Factory (Shanghai, China). Analytical grade tetrabutyl titanate was received from the Reagent Chemical Manufacturer (Shanghai, China) and was used without further purification. Analytical grade ethanol was purchased from Reagent Chemical Manufacture of Shanghai and was distilled and stored over 4 Å molecular sieves before use. Nonporous hydrophilic colloidal silica (SiO2) A-200 (12 nm, 200 m2 g−1) and P25 (gas nanometer TiO2, 21 nm, 50 m2 g−1) were obtained from Degussa, Germany.Preparation of graphene oxide with hydrophilic groups
Graphene oxide (GO) nanosheets with hydrophilic groups were synthesized by oxidizing graphite powder based on the improved Hummers method.32 In previous studies, GO nanosheets optimized the morphology and distribution in polymer matrices upon addition of 5.0 g graphite powder, 2.5 g NaNO3, and 20 g KMnO4 to the suspension during GO preparation. These optimized conditions were maintained in the present study for synthesizing GO nanosheets. The specific surface area of GO nanosheets was 52 m2 g−1.Preparation of TiO2-based multiphotocatalysts
0.5 g of GO with hydrophilic groups, 1.5 mL of water and 200 mL of absolute alcohol were placed in a triflask, while stirring at 30 °C. A water-rich adsorption layer formed gradually on GO surface, due to the selective adsorption capacity for water. After adsorption equilibrium (24 h), tetrabutyl titanate (2.25 g) dissolved in alcohol (50 mL) was added. And tetrabutyl titanate could diffuse into the adsorption layer and the hydrolysis reaction takes place.25 After 5 h of reaction, the product was obtained by centrifugation–washing cycles conducted three times.
The as-prepared TiO2–GO catalysts were dispersed in 150 mL absolute alcohol and placed in a Teflon-covered stainless steel autoclave (volume: 200 mL). The autoclave was then placed in a furnace for solvothermal treatment (temperature: 170 °C, time: 24 h). After several centrifugation–washing cycles, the photocatalysts were retrieved and designated as Red–GO–TiO2.
0.5 g of GO with hydrophilic groups, 1.5 mL of water and 200 mL of absolute alcohol were placed in a triflask, while stirring at 30 °C. A water-rich adsorption layer formed gradually on GO surface, due to the selective adsorption capacity for water. After adsorption equilibrium (24 h), tetrabutyl titanate (2.25 g) and lanthanum nitrate (0.77 mg) dissolved in alcohol (50 mL) was added. Both tetrabutyl titanate and La3+ ions could diffuse into the adsorption layer and the hydrolysis reaction takes place.25 After 5 h of reaction, the product was obtained by centrifugation–washing cycles conducted three times.
The process of solvothermal treatment for this catalyst was similar as that of Red–GO–TiO2. After the solvothermal treatment, the photocatalysts were retrieved and designated as La3+-doped Red–GO–TiO2.
Characterization
The morphologies of TiO2–GO catalysts were characterized using transmission electron microscopy (TEM, JEM-1230, Jeol Co., Ltd.). The Autosorb 1-C sorption system (Quantachrome, USA) was used to determine the specific surface area. The structure of TiO2–GO catalysts was determined using Fourier transform infrared (FTIR) spectroscopy (Nexus-670, Nicolet Co.). Moreover, the catalysts were analyzed with X-ray diffraction (XRD) using a D/max-rA XRD instrument (XD-98) with Cu Kα radiation (1.5406 Å). The photoluminescence (PL) spectra were recorded on a fluorospectrophotometer (PL: RAMANLOG 6, USA) at room temperature using a 250 nm xenon lamp as the irradiation source. The surface properties of catalysts were investigated using X-ray photoelectron spectroscopy (XPS) with Al Kα X-ray (hm = 1486.6 eV) radiation operated at 150 W (XPS: Thermo ESCALAB 250, USA).Photocatalysis experiments
Our experiment used simulated seawater composed of 2.5% NaCl, 1.1% MgCl2, 0.40% Na2SO4, and 0.16% CaCl2 in distilled water without CO2.33,34 Conductivity measurements were used to evaluate the effects of photocatalyst addition on seawater salt concentration. As shown in Fig. S1 and S2 in the ESI,† the solution conductivity did not change after photocatalyst addition. It is suggested that the adsorption amount of salt ions by these photocatalysts in seawater was too small to be measured by the conductivity measurements.The photodegradation of phenol in seawater was studied to evaluate the performance of different catalysts irradiated under weak ultraviolet (UV) black-light lamps (250 nm wavelength, 4 W).25 Prior to irradiation, the suspension (800 mL of phenol solution with different initial concentration, 1.0 g of different photocatalysts) was stirred in the dark for 60 min to establish a adsorption/desorption equilibrium. At 30 min intervals, the sampled suspension was centrifuged, and the upper clear solution was extracted. UV-vis spectrophotometer (Beijing, China) was used to measure the changes in the phenol concentration (510 nm wavelength) in the solution using the 4-aminoantipyrine spectrophotometric method (Fig. S3, ESI†). To confirm the results from the 4-aminoantipyrine spectrophotometric method,35,36 we determined the total organic carbon (TOC) in the aqueous solution without catalysts after 5 h of photodegradation. And it was found that the removal rate of phenol by TOC was approximated by the results of spectrophotometry, which meant phenol in seawater transfer to form CO2 and H2O after 5 h of photodegradation.
Fig. S4 (ESI†) provides the details on the blank experiments under weak UV light irradiation with an intensity of 12 μW cm−2. The light intensity of the four-watt UV lamp was weak for degrading phenol.
Results and discussion
Comparison of photodegradation in seawater and in water excited by weak UV light
The photodegradation of different phenol concentrations in seawater using P25 and SiO2–TiO2 doped with La3+ was first investigated. The photodegradation experiments in water using the same catalysts were done simultaneously for comparison. The photodegradation curves of phenol in seawater and water are listed in Fig. 1 and 2, respectively.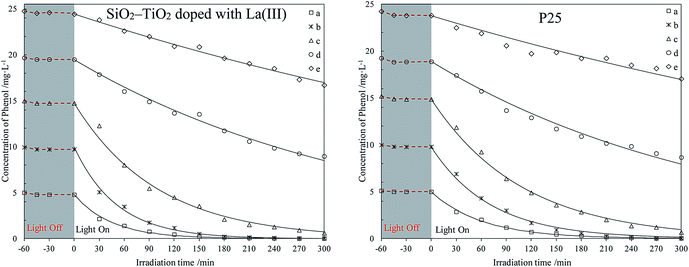 | ||
| Fig. 1 Photodegradation of different phenol concentrations in seawater using two catalysts. The initial phenol concentrations (mg L−1): (a) 5; (b) 10; (c) 15; (d) 20; (e) 25. | ||
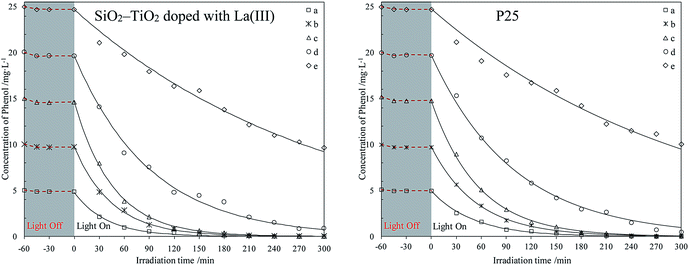 | ||
| Fig. 2 Photodegradation of different phenol concentrations in water using two catalysts. The initial phenol concentrations (mg L−1): (a) 5; (b) 10; (c) 15; (d) 20; (e) 25. | ||
The curves in Fig. 1 and 2 shows that all catalysts reach adsorption equilibrium for phenol both in seawater and water after 30 min. Two catalysts had poor adsorption for phenol in seawater or water, due to their hydrophilic surfaces. Under weak UV light irradiation, the degradation for phenol by the two catalysts in seawater and water almost followed a first-order reaction kinetics, which agreed with previous results.37,38 Under same conditions, SiO2–TiO2 doped with La3+ had higher photocatalytic activity than P25 under weak UV light irradiation, which corresponded with our previous results.25 According to heterogeneous photocatalysis studies, the amount of catalyst surface active center was limited. At a high initial concentration, a large amount of phenol molecules could not efficiently be photodegraded by catalysts. The catalyst activity was reduced and the degradation process was deviated from a first-order reaction kinetics.
Comparing all photodegradation curves in Fig. 1 and 2, the changes in photodegradation in seawater and water vary as the phenol concentration increases. Under the same condition, the same catalyst had lower activity in seawater than in water. In seawater, the salt ions were much more than the phenol molecules. Combining the results in studies,39–41 large amount of salt ions would move around the catalyst surface, due to the hydrophilic surface of P25 or SiO2–TiO2 doped with La3+. This inhibited the phenol diffusion from the bulk to the catalyst surface and decreased the catalyst activity center.
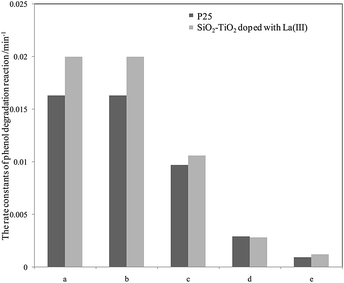
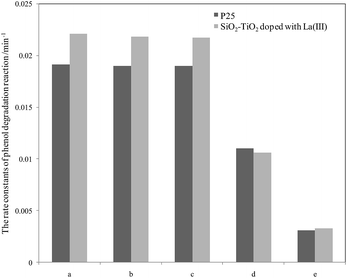
For further comparison, the rate constants in seawater and water were obtained by plotting ln(C0/C) to irradiation time t (as shown in Fig. S5 and S6, ESI†) and are listed in Fig. 3 and 4. The changes in the two figures indicate that the activities of two catalysts in seawater were lower than those in water under the same conditions, due to the presence of so many salt ions. In seawater, the catalyst activity was more sensitive to the initial concentration of phenol than that in water. At the initial concentration of 15 mg L−1, the activities of the two catalysts decreased obviously, whereas in water, the activities of the two catalysts were reduced at a high initial phenol concentration (≥20 mg L−1).
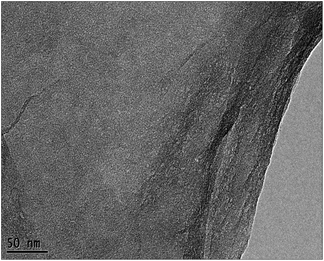
Based on the comparison of the results in seawater and in water, the catalyst must meet two requirements to efficiently degrade organic matter in seawater systems. Firstly, the TiO2 photocatalysts should have the necessary microstructures, such as small particle size, high dispersibility, and appropriate crystal form, in the photodegradation process in water. On the other hand, the previous results25 indicated that weakening the surface hydrophilicity of the catalyst and increasing the adsorption performance of the catalyst for target organics in seawater are also necessary. Based on current and previous results,26,27 we first employed solvothermal treatment using ethanol as a reduction solvent to change the surface properties of the SiO2–TiO2 catalyst. Fig. S7 (ESI†) shows the digital photos of the SiO2–TiO2 catalyst before and after the solvothermal treatment in seawater. The surface hydrophilicity of the SiO2–TiO2 catalyst after the solvothermal treatment was significantly weakened. However, the SiO2–TiO2 catalyst after the solvothermal treatment was unable to disperse uniformly in water, therefore, photodegradation could not be done. Combining our former results25,30 and those of others,26,27 we first used GO with a hydrophilic surface as a support in preparing small TiO2 particles using ALNS. The solvothermal treatment was used to reduce the oxidation groups on the catalyst surface, aiming to decrease the surface hydrophilicity and increase the adsorption of the catalyst for organics in seawater. The TEM image of the GO nanosheets is shown in Fig. 5.
Preparation of different Red–GO–TiO2 by coupling ALNS and solvothermal treatment
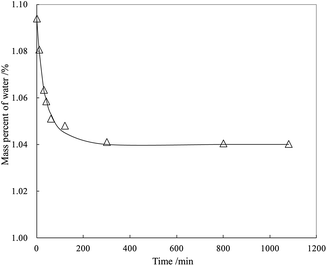
From Fig. 5, the highly transparent nanosheets with yarn-like sheets are characteristic of the GO morphology, which indicate a monolayer or a few layers of GO. These findings are consistent with previous work.32 Fig. 6 lists the adsorption curves of water by GO and the adsorption equilibrium after 4 h (240 min). Assuming that the adsorption layer is entirely composed of water, the adsorption layer thickness of GO is approximately 1 nm, thereby proving that the water-rich adsorption layer will form on the GO surface. Thus, this adsorption layer can be used as a nanoreactor for preparing TiO2 nanoparticles.For a clear comparison, GO sample was denoted as Red–GO after the solvothermal treatment, and its TEM image is listed in Fig. S8 (ESI†). As shown in the figure, TEM morphologies of both GO and Red–GO nanosheets showed a yarn-like sheet structure, indicating that the solvothermal treatment did not change the nanosheet morphology. The specific surface area of Red–GO nanosheets was 55 m2 g−1, similar to that of the GO nanosheets, which confirmed that the nanosheet morphology was unchanged by the solvothermal treatment.
Fig. 7 displays the TEM images of Red–GO–TiO2 and La3+-doped Red–GO–TiO2, whereas Fig. S9 (ESI†) presents those of GO–TiO2 and La3+-doped GO–TiO2 before solvothermal treatment for comparison. Manifested as the black points on the nanosheets, the TiO2 particle morphology can be observed both in Fig. 7 and S9 (ESI†).
The ALNS method employed a water-rich adsorption layer with several nanometer thick as a nanoreactor on the GO surface; therefore, TiO2 nanoparticles with size of less than 10 nm were formed and were distributed homogeneously on the GO surface, as shown in Fig. S9 (ESI†). La3+ doping did not change the TiO2 morphology on the GO surface, corresponding with previous findings.25 Moreover, TiO2 small particles that formed in the adsorption layer interacted tightly with the GO surface, and this could effectively inhibit the aggregation of both small TiO2 particles and GO nanosheets during the solvothermal treatment. Therefore, no difference was observed in the catalyst morphology before and after the solvothermal treatment. The specific surface areas of Red–GO–TiO2 and La3+-doped Red–GO–TiO2 were 51 and 50 m2 g−1, respectively, which were close to that of GO.
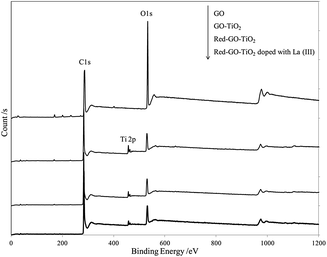
Fig. 8 displays the XPS results for different catalysts and suggests TiO2 formation in all photocatalysts by ALNS. XPS analysis was used to identify the chemical state of Ti in the Red–GO–TiO2 and La3+-doped Red–GO–TiO2 catalysts, as shown in Fig. S10 (ESI†). The Ti 2p levels of all catalysts depicted two peaks at approximately 464.6 and 458.3 eV, which were denoted as Ti 2p1/2 and Ti 2p3/2, respectively.42 Data suggested that Ti existed as Ti4+ in the Red–GO–TiO2 and La3+-doped Red–GO–TiO2 catalysts.
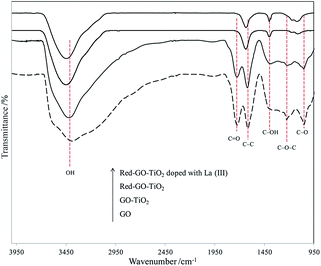
The solvothermal treatment had little influence on the catalyst morphology. However, the FTIR spectra of different photocatalysts (Fig. 9) indicated that the surface properties of the catalysts changed significantly after the solvothermal treatment. As shown in Fig. 9, GO–TiO2 had a similar characteristic FTIR spectra with GO. The absorption bands corresponded to the C–O stretching at 1050 cm−1, C–O–C stretching at 1250 cm−1, C–OH stretching at 1400 cm−1, C–C stretching at 1620 cm−1, and C![[double bond, length as m-dash]](https://www.rsc.org/images/entities/char_e001.gif) O carbonyl stretching at 1720 cm−1.43 The resonance peak at 3383 cm−1 was assigned to the absorbed hydroxyl groups in catalysts.44 When TiO2 formed on the GO surface through ALNS, the TiO2–GO catalysts exhibited weak absorption peaks of C–O, C–OH, C
O carbonyl stretching at 1720 cm−1.43 The resonance peak at 3383 cm−1 was assigned to the absorbed hydroxyl groups in catalysts.44 When TiO2 formed on the GO surface through ALNS, the TiO2–GO catalysts exhibited weak absorption peaks of C–O, C–OH, C![[double bond, length as m-dash]](https://www.rsc.org/images/entities/char_e001.gif) O, and absorbed hydroxyl groups, thereby indicating that the oxygenated functional groups on GO surface slightly decreased during the formation of TiO2 particles.
O, and absorbed hydroxyl groups, thereby indicating that the oxygenated functional groups on GO surface slightly decreased during the formation of TiO2 particles.
After solvothermal treatment, the oxygenated functional groups on the surface of Red–GO–TiO2 and La3+-doped Red–GO–TiO2 were reduced significantly and the absorption peaks of C![[double bond, length as m-dash]](https://www.rsc.org/images/entities/char_e001.gif) O and C–O–C almost disappeared. The GO surface was reduced during the solvothermal treatment with alcohol as the reducing agent, thereby confirming that alcohol reduced the oxygenated functional groups on the catalyst surface. The FTIR spectra of Red–GO–TiO2 and La3+-doped Red–GO–TiO2 showed some remaining hydroxyl groups on the two catalyst surfaces, which would mainly be distributed on the TiO2 surface. This could help in the efficient distribution of Red–GO–TiO2 and La3+-doped Red–GO–TiO2 in seawater (as shown in Fig. S11†).
O and C–O–C almost disappeared. The GO surface was reduced during the solvothermal treatment with alcohol as the reducing agent, thereby confirming that alcohol reduced the oxygenated functional groups on the catalyst surface. The FTIR spectra of Red–GO–TiO2 and La3+-doped Red–GO–TiO2 showed some remaining hydroxyl groups on the two catalyst surfaces, which would mainly be distributed on the TiO2 surface. This could help in the efficient distribution of Red–GO–TiO2 and La3+-doped Red–GO–TiO2 in seawater (as shown in Fig. S11†).
HRTEM results (Fig. 10) show that TiO2 crystallization was simultaneous with the GO surface reduction during the solvothermal treatment. The HRTEM image of GO–TiO2 is listed in Fig. S12 (ESI†) for comparison.
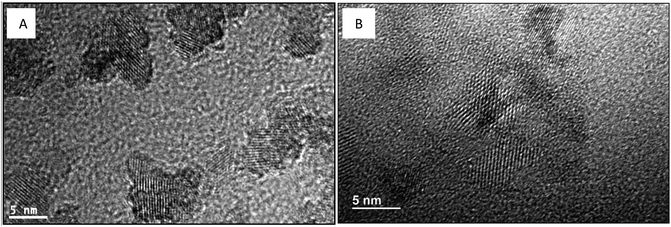 | ||
| Fig. 10 TEM and HRTEM images of different TiO2–RGO catalysts. (A) Red–GO–TiO2; (B) GO–TiO2 doped with La3+. | ||
In the HRTEM image of GO–TiO2 and the images in Fig. 10, the TiO2 crystallization formed in both Red–GO–TiO2 and La3+-doped Red–GO–TiO2 after the solvothermal treatment. These two catalysts had TiO2 nanocrystals with less than 5 nm in size due to the small nanoreactors and Red–GO protection on TiO2 particles. Several distortions were observed in the lattice fringes of the TiO2 nanocrystals in the two catalysts, especially in the La3+-doped Red–GO–TiO2. Based on the results both in Fig. 7 and in our previous study,25 the tight interaction between TiO2 particles and the supports, as well as La3+ doping, caused the lattice distortions of TiO2 during TiO2 crystallization.
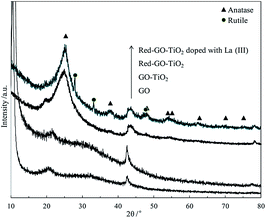
The XRD results in Fig. 11 confirm the formation of TiO2 crystallization and the difference in TiO2 crystallization between the two catalysts.
Fig. 11 shows that GO–TiO2 has a similar XRD pattern with GO, and no TiO2 crystallization peaks are present in the XRD pattern; therefore, the TiO2 in GO–TiO2 existed as amorphous TiO2. After the solvothermal treatment, amorphous TiO2 transformed into anatase TiO2 crystals in Red–GO–TiO2. Moreover, a few rutile TiO2 crystals appeared in the La3+-doped Red–GO–TiO2, although anatase TiO2 was the main crystal form. This phenomenon was not found in our previous works25,30,31 and might be due to the strong inhibition by SiO2 on TiO2 crystallization than that of GO. In our previous work,25 SiO2 strongly inhibited the crystallization transformation of TiO2, and the anastase TiO2 did not transfer to rutile TiO2 even with sintering at 900 °C. Therefore, a low level of La ion doping did not change the crystallization transformation of TiO2. Due to the weak effect of GO on the crystallization transformation of TiO2, a low level of La ion doping could improve the transformation of anatase TiO2 to rutile TiO2, which could cause the lattice distortions in the TiO2 crystallization.25,45
The changes in the surface property and TiO2 crystallization would certainly affect the photocatalytic process. A low recombination rate of photogenerated electron–hole pairs result in high catalytic activity that could be attributed to the separation efficiency of photogenerated charge carriers and small intensities of PL peaks.46
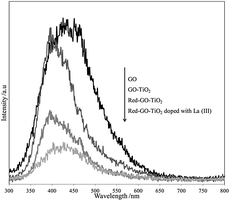
Fig. 12 shows the differences in the PL spectra of GO, GO–TiO2, Red–GO–TiO2, and La3+-doped Red–GO–TiO2. Oxygenated functional groups on the GO surface could work as deep trapping sites for photogenerated charge carriers. Thus, GO and GO–TiO2 showed similar PL peaks with strong intensities. After the solvothermal treatment, the oxygenated functional groups were reduced by alcohol and Red–GO could transport photogenerated electrons,47,48 thereby weakening the PL peaks. The PL spectra also show that the photogenerated charge carrier was transferred rapidly from the TiO2 particles to the Red–GO nanosheets, since the small TiO2 particles tightly attached to the Red–GO surface in the two Red–GO–TiO2 catalysts. This could significantly enhance the separation efficiency of photogenerated charge carriers and weaken the PL peak intensity. Moreover, a few lattice distortions in TiO2 nanocrystals could work as shallow trapping sites for charge carriers. Especially, the mixed crystal forms, including anatase and rutile TiO2, could introduce numerous shallow trapping sites as charge carriers into the catalysts. Therefore, the La3+-doped Red–GO–TiO2 had the weakest PL peak among the PL spectra in Fig. 12.
The photocurrent response of different catalysts could confirm further the results in PL test, as shown in Fig. S13 (ESI†). From the figure, it can be found that GO–TiO2 has very weak photocurrent, due to oxygenated functional groups on the GO surface and amorphous TiO2. The value of Red–GO–TiO2 and La3+ doping Red–GO–TiO2 were significantly higher than that of GO–TiO2, since the oxygenated functional groups were reduced by alcohol and TiO2 crystallization formed. La3+ doping introduced a few lattice distortions in TiO2 nanocrystals as shallow trapping sites, so it had the strongest photocurrent response.
Performance of different Red–GO–TiO2 by coupling ALNS and solvothermal treatment
The photodegradation experiments for phenol with different initial concentration of GO–TiO2 were carried out. And the degradation curves are listed in Fig. S14.† Both amorphous TiO2 and large amount of oxygenated functional groups on the GO surface worked as deep trapping sites for photogenerated charge carriers. Therefore, the GO–TiO2 showed very low photocatalytic activity for phenol in seawater, under irradiation of weak UV light. In addition, the adsorption capacity of phenol by GO was also weak due to the hydrophilicity of GO surface.Fig. 13 and 14 display the photodegradation of different phenol concentrations using Red–GO–TiO2 and La3+-doped Red–GO–TiO2. From these curves, the two Red–GO–TiO2 catalysts are shown to have strong adsorption capacity for phenol in seawater after the solvothermal treatment. We also list the C/C0 graphs where C0 is the concentration at the time that the light is switched on, as shown in Fig. S15 and S16.† As shown in all degradation curves, the photocatalytic activities of the two catalysts exceeded those of P25 and SiO2–TiO2 doped with La3+, especially at high initial concentrations (≥20 mg L−1). The total phenol removal rates at 2 h using different photocatalysts are listed in Fig. 15.
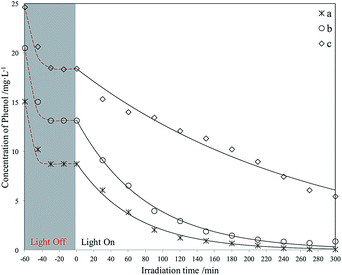 | ||
| Fig. 13 Photodegradation of different phenol concentrations using Red–GO–TiO2. The initial phenol concentration in seawater (mg L−1): (a) 15; (b) 20; (c) 25. | ||
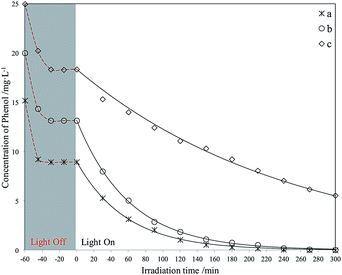 | ||
| Fig. 14 Photodegradation of different phenol concentrations using La3+-doped Red–GO–TiO2. The initial phenol concentration in seawater (mg L−1): (a) 15; (b) 20; (c) 25. | ||
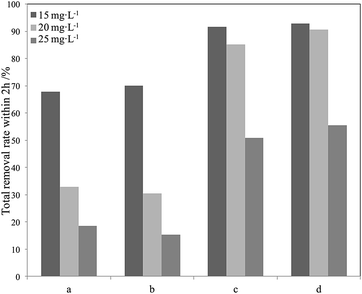 | ||
| Fig. 15 Degradation efficiency of different phenol concentrations using different photocatalysts in seawater within 2 h (a) P25; (b) La3+-doped SiO2–TiO2; (c) Red–GO–TiO2; (d) La3+-doped Red–GO–TiO2. | ||
As shown in Fig. 15, both Red–GO–TiO2 and La3+-doped Red–GO–TiO2 had significantly higher activities than P25 and La3+-doped SiO2–TiO2 at high initial phenol concentrations. The total removal rate of the two Red–GO–TiO2 catalysts within 2 h was more than twice those of P25 and La3+-doped SiO2–TiO2. This is mainly caused by both strong adsorption capability for phenol in seawater and the rapid transformation of photogenerated electrons from TiO2 to Red–GO, as shown in Scheme S1 (ESI†).49
Comparing Red–GO–TiO2 with or without doping, the two catalysts had similar adsorption capacities for phenol in seawater. The La3+-doped Red–GO–TiO2 showed higher activity than Red–GO–TiO2 without doping. From the HRTEM and XRD analyses in Fig. 8 and 9, La3+ doping caused mixed crystals to form, including anatase and rutile TiO2, which could increase the shallow trapping sites in the catalysts for charge carriers. Thus, the photocatalytic activity of Red–GO–TiO2 increased after La3+ doping. However, the enhancement on the activity was small, which was inconsistent with our previous studies. And this results suggested that the strong adsorption capability for phenol and the rapid transformation of photogenerated electrons played the more important roles on the enhancement on the photo activity in seawater than that of La3+ doping. This might be due to the difference between the catalysts prepared with GO as the carrier and the catalysts prepared with SiO2 as the carrier. These require further studies.
Conclusions
Due to the weak phenol adsorption and hydrophilic surface, P25 and La3+-doped SiO2–TiO2 could not overcome the disturbance of salt ions using ALNS. Therefore, they showed low activity in photodegrading phenol in seawater under weak UV light irradiation, especially at high initial phenol concentrations. Using ALNS coupling with solvothermal treatment with alcohol as the reducing agent, TiO2 crystallization and RGO formation occurred simultaneously. The tight interaction between TiO2 particles and the GO surface effectively inhibited TiO2 aggregation during solvothermal treatment. Given the small size and efficient distribution of TiO2 nanoparticles, the two Red–GO–TiO2 catalysts showed high separation efficiency for photogenerated charge carriers. Moreover, the strong phenol adsorption on the two Red–GO–TiO2 catalysts was essential for improving the photodegradation efficiency in seawater. The activities of the two Red–GO–TiO2 catalysts were more than twice those of P25 and La3+-doped SiO2–TiO2. Moreover, La3+ doping caused mixed crystals to form, including anatase and rutile TiO2, which could increase the shallow trapping sites in the catalysts for charge carriers. Thus, La3+ doping increases the photocatalytic activity of Red–GO–TiO2.Acknowledgements
Financial support from the National Science Foundation of China Grants (Contract 20806071 and 51008277), the Natural Science Foundation of Zhejiang Province (Contract LY14B060001 and LY14E080001) and the Public Projects of Zhejiang Province (Contract 2015C31025) are gratefully acknowledged.Notes and references
- N. P. Votsi, A. S. Kallimanis and I. D. Pantis, Environ. Pollut., 2017, 221, 459–469 CrossRef CAS PubMed.
- Y. Y. Wu, B. J. Gu, J. W. Erisman, S. Reis, Y. Y. Fang, X. H. Lu and X. M. Zhang, Environ. Pollut., 2016, 218, 86–94 CrossRef CAS PubMed.
- L. M. Rios, C. Moore and P. R Jones, Mar. Pollut. Bull., 2007, 54, 1230–1237 CrossRef CAS PubMed.
- R. Lohmann and I. M. Belkin, Prog. Oceanogr., 2014, 128, 172–184 CrossRef.
- F. Kargi and A. R. Dincer, Enzyme Microb. Technol., 1996, 19, 529–537 CrossRef CAS.
- K. Windey, B. De and W. Verstraete, Water Res., 2005, 39, 4512–4520 CrossRef CAS PubMed.
- C. P. Huang, H. W. Wang and P. C. Chiu, Water Res., 1998, 32, 2257–2264 CrossRef CAS.
- M. Cheng, G. M. Zeng, D. L. Huang, C. Lai, P. Xu, C. Zhang and Y. Liu, Chem. Eng. J., 2016, 284, 582–598 CrossRef CAS.
- Y. A. Shabana, A. A. El Maradny and R. K. Al Farawati, J. Photochem. Photobiol., A, 2016, 328, 114–121 CrossRef.
- M. A. Lazar and W. A. Daoud, RSC Adv., 2013, 3, 4130–4140 RSC.
- K. Fischer, M. Kühnert, R. Gläser and A. Schulze, RSC Adv., 2015, 5, 16340–16348 RSC.
- P. V. Kamat and D. Meisel, Curr. Opin. Colloid Interface Sci., 2002, 7, 282–287 CrossRef CAS.
- C. L. Pang, R. Lindsay and G. Thornton, Chem. Rev., 2013, 113, 3887–3948 CrossRef CAS PubMed.
- H. H. Chen, C. E. Nanayakkara and V. H. Grassian, Chem. Rev., 2012, 112, 5919–5948 CrossRef CAS PubMed.
- D. Rubioa, J. F. Casanueva and E. Nebot, J. Photochem. Photobiol., A, 2013, 271, 16–23 CrossRef.
- X. H. Xia, Z. J. Jia, Y. Yu, Y. Liang, Z. Wang and L. L. Ma, Carbon, 2007, 45, 717–721 CrossRef CAS.
- X. Jiang and T. Wang, J. Am. Ceram. Soc., 2008, 91, 46–50 CrossRef CAS.
- L. Gu, J. Y. Wang, H. Cheng, Y. Z. Zhao, L. F. Liu and X. J. Han, ACS Appl. Mater. Interfaces, 2013, 5, 3085–3093 CAS.
- M. R. Hoffmann, S. T. Martin, W. Y. Choi and D. W. Bahnemann, Chem. Rev., 1995, 95, 69–96 CrossRef CAS.
- W. Li, Y. Bai, C. Liu, Z. H. Yang, X. Feng, X. H. Lu, N. K. van der Laak and K. Y. Chan, Environ. Sci. Technol., 2009, 43, 5423–5428 CrossRef CAS PubMed.
- A. Fujishima, T. N. Rao and D. A. Tryk, J. Photochem. Photobiol., C, 2000, 1, 1–21 CrossRef CAS.
- K. Ishibashi, A. Fujishima, T. Watanabe and K. Hashimoto, J. Phys. Chem. B, 2000, 104, 4934–4938 CrossRef CAS.
- S. Kayano, K. Yoshihiko, H. Kazuhito and A. Fujishima, Environ. Sci. Technol., 1998, 32, 726–728 CrossRef.
- Y. Ohko, A. T. Donald, K. Hashimoto and A. Fujishima, J. Phys. Chem. B, 1998, 102, 2699–2704 CrossRef CAS.
- J. R. Li, C. H. Yang, L. G. Wu, Y. Q. Cao, T. Wang and B. Q. Jiang, Colloids Surf., A, 2015, 481, 413–422 CrossRef CAS.
- S. X. Li, W. J. Liang, F. Y. Zheng, H. F. Zhou, X. F. Lin and J. B. Cai, Sens. Actuators, B, 2016, 224, 48–54 CrossRef CAS.
- C. Guillard, E. Puzenat, H. Lachheb, A. Houas and J. M. Herrmann, Int. J. Photoenergy, 2005, 7, 1–10 CrossRef CAS.
- Y. X. Li, Y. Xiang, S. Q. Peng, X. W. Wang and L. Zhou, Electrochim. Acta, 2013, 87, 794–800 CrossRef CAS.
- Y. X. Li, F. He, S. Q. Peng, D. Gao, G. X. Lu and S. B. Li, J. Mol. Catal. A: Chem., 2011, 341, 71–76 CrossRef CAS.
- X. Jiang and T. Wang, Environ. Sci. Technol., 2007, 41, 4441–4446 CrossRef CAS PubMed.
- T. Wang, X. Jiang and J. Wang, J. Colloid Interface Sci., 2010, 350, 69–74 CrossRef CAS PubMed.
- T. Wang, L. Zhao, J. N. Shen, L. G. Wu and B. V. Bruggen, Environ. Sci. Technol., 2015, 49, 8004–8011 CrossRef CAS PubMed.
- A. J. Simamora, T. L. Hsiung, F. C. Chang, T. C. Yang, C. Y. Liao and H. P. Wang, Int. J. Hydrogen Energy, 2012, 37, 13855–13858 CrossRef CAS.
- N. Yamada, M. Suzumura, F. Koiwa and N. Negishi, Water Res., 2013, 47, 2770–2776 CrossRef CAS PubMed.
- Y. Fiamegos, C. Stalikas and G. Pilidis, Anal. Chim. Acta, 2002, 467, 105–114 CrossRef CAS.
- G. Norwitz, A. H. Bardsley and P. N. Keliher, Anal. Chim. Acta, 1981, 128, 251–256 CrossRef CAS.
- M. Trillas, J. Peral and X. Domènech, J. Chem. Technol. Biotechnol., 2015, 67, 237–242 CrossRef.
- E. Grabowska, J. Reszczyńska and A. Zaleska, Water Res., 2012, 46, 5453–5471 CrossRef CAS PubMed.
- Y. X. Li, F. He, S. Q. Peng, D. Gao, G. X. Lu and S. B. Li, Int. J. Hydrogen Energy, 2011, 36, 10565–10573 CrossRef CAS.
- Y. X. Li, S. Y. Lin, S. Q. Peng, D. Gao, G. X. Lu and S. B. Li, Int. J. Hydrogen Energy, 2013, 38, 15976–15984 CrossRef CAS.
- Y. X. Li, D. Gao, S. Q. Peng, G. X. Lu and S. B. Li, Int. J. Hydrogen Energy, 2011, 36, 4291–4297 CrossRef CAS.
- L. Kong, C. H. Wang, H. Zheng, X. T. Zhang and Y. C. Liu, J. Phys. Chem. C, 2015, 119, 16623–16632 CAS.
- C. Xu, X. Wang and J. W. Zhu, J. Phys. Chem. C, 2008, 112, 19841–19845 CAS.
- G. Goncalves, P. A. A. P. Marques, C. M. Granadeiro, H. I. S. Nogueira, M. K. Singh and J. Grácio, Chem. Mater., 2009, 21, 4796–4802 CrossRef CAS.
- V. Loddo, G. MarcõÁ, C. MartõÂn, L. Palmisano, V. Rives and A. Sclafani, Appl. Catal., B, 1999, 20, 29–45 CrossRef CAS.
- F. Dong, S. Guo, H. Q. Wang, X. F. Li and Z. B. Wu, J. Phys. Chem. C, 2011, 115, 13285–13292 CAS.
- Y. X. Li, H. Wang and S. Q. Peng, J. Phys. Chem. C, 2014, 118, 19842–19848 CAS.
- W. Y. Zhang, Y. X. Li and S. Q. Peng, ACS Appl. Mater. Interfaces, 2016, 8, 15187–15195 CAS.
- Y. X. Li, J. X. Wang, S. Q. Peng, G. X. Lu and S. B. Li, Int. J. Hydrogen Energy, 2010, 35, 7116–7126 CrossRef CAS.
Footnote |
| † Electronic supplementary information (ESI) available: Dependences of conductivity of seawater on time after photocatalysts addition, dependences of conductivity of seawater on time after photocatalysts addition, the standard curve of phenol in seawater and water measured by spectrophotometer, the blank degradation experiments of phenol illuminated under 4 W UV lamp, degradation of phenol with different initial concentration by two catalysts in seawater, degradation of phenol with different initial concentration by two catalysts in water, digital photographs of the dispersion of La3+ doped SiO2–TiO2 in seawater, TEM images of Red–GO samples, TEM images of two GO–TiO2 before solvothermal treatment, XPS profiles of Ti 2p in two Red–GO–TiO2 catalysts, digital photographs of the dispersion of GO–TiO2 and Red–GO–TiO2 in seawater, HRTEM images of GO–TiO2 before solvothermal treatment, photocurrent response of different photocatalysts, photodegradation of different phenol concentrations using GO–TiO2, degradation curves using Red–GO–TiO2 and degradation curves using La3+ doping Red–GO–TiO2 are shown in Fig. S1–S16. The mechanism scheme on photodegradation process for phenol in seawater by Red–GO–TiO2 with or without doping is shown in Scheme S1. See DOI: 10.1039/c7ra04732k |
| This journal is © The Royal Society of Chemistry 2017 |

