 Open Access Article
Investigations on oil detachment from rough surfaces in an aqueous solution†
W. K. Xie,
Y. Z. Sun,
H. T. Liu * and
F. H. Zhang
Center for Precision Engineering, Harbin Institute of Technology, P.O. Box 413, Harbin, Heilongjiang 150001, China. E-mail: 12B908026@hit.edu.cn
First published on 15th June 2017
Abstract
Herein, detachment of oil molecules from perfect and defective aluminum oxide surfaces in an aqueous solution was investigated using atomistic molecular dynamics simulations. On the basis of the α-Al2O3 (0001) plane, three types of surface defects, pits, grooves, and protrusions, were created and applied to explore the effects of surface defects on the detachment of oil molecules in an aqueous solution. Our simulation results indicate that the surface defects with various topographies affected the oil detachment to different degrees. The adsorption conformation of oil molecules on each defective alumina surface evidently changed during the entire simulation. The effect of each type of surface defect on oil detachment follows the order grooves < pits < protrusions. After this, the oil–alumina and water–alumina interactions were investigated to determine the effects of the surface defects on the driving forces responsible for the conformational change of oil molecules on each type of defective alumina surface. The microscopic conformational changes and detachment of oil molecules from the defective alumina surface discussed herein are believed to be helpful to enrich the mechanism of oil detachment from a rough substrate surface.
1. Introduction
Understanding of the detachment mechanism of oil molecules at the oil/water/solid interface is a topic that has attracted significant attention from many application fields such as detergency,1 enhanced oil recovery (EOR),2 and high-power laser facility.3 Over the past few decades, experimental studies carried out via quartz crystal microbalance (QCM),4 X-ray photoelectron spectroscopy (XPS),5 and laser confocal microscopy,6 along with theoretical investigations conducted via computational simulation methods, have been extensively employed to understand the microscopic detachment process of oil molecules. On the basis of these investigations, the role of a wide range of factors, such as applied potential,7 nanofluids,8 pH,9 ionic strength,10 and physicochemical characteristics of substrate surface,11 in the conformational change and detachment of oil molecules has been emphatically interpreted.In addition, the effect of the local morphology of the substrate surface should be taken into account. As is well-known, the substrate surfaces machined via various types of traditional processing methods, such as milling,12 turning,13 and electrical discharge machining (EDM),14 are rough. It is expected that different surface morphologies can affect the adsorption behavior and detachment of oil molecules from the substrate surface. To date, it is not clearly elucidated that how the surface structures at the nanoscale affect the detachment mechanism of the oil molecules. Are there differences between the microscopic detachment processes of oil molecules from defective and perfect surface?
It is still a challenge to directly observe the microscopic details of the detachment of oil molecules from a substrate surface at the very small nanoscale. Owing to the rapid development of computer science and technology, computational simulation methods, including molecular dynamics (MD),15,16 Monte Carlo,17 and dissipative particle dynamics (DPD),18 have been extensively applied to accurately describe the microscopic details of the conformational change and detachment mechanism of the molecules. For instance, Wang et al. have deeply studied the effect of charged nanoparticles in cleaning suspensions on the oil detachment via MD simulations.19 It was observed that the addition of charged nanoparticles can effectively promote oil detachment. In addition, they found that the surface wettability and charge of the nanoparticles are significant for oil detachment in charged nanoparticle suspensions. In the study conducted by Mohammad Sedghi et al., the effects of wall–fluid interactions on the threshold capillary pressure of oil–water/brine displacements in a nanopore with a square cross-section were investigated.20 Zhang et al. compared the mechanisms of oil detachment from a pure hydrophilic and hydrophobic silica surface, and the role of the surface wettability in oil detachment was elucidated.21 However, the substrate surfaces that are used to study the adsorption behavior and detachment mechanism of oil molecules are typically restricted to nanoporous or perfect surfaces without any defects. In addition, little attention has been paid to the detachment of oil molecules from a rough substrate surface.
Due to these reasons, we present an MD study on the dynamic conformational change of oil molecules on defective Al2O3 surfaces in an aqueous solution. To the best of our knowledge, the abovementioned topic has been not computationally addressed to date. Al2O3, which is an oxide layer formed on the aluminum alloy surface, was selected as the substrate material due to its important influence on the interfacial properties of an aluminum alloy surface.22 This study will provide a fundamental understanding of the conformational changes on and migration and detachment of the oil molecules from the defective surface. In addition, a direct comparison between the conformational change processes of the oil molecules on perfect and various defective alumina surfaces was made to determine the effects of the surface defects on oil detachment in an aqueous solution.
The rest of the study is organized as follows. Detailed information for the simulation models and methods is provided in Section 2. In Section 3, our new findings, which provide evidence for the strong effects of surface defects on water-driven oil detachment, have been presented and discussed. Finally, in Section 4, we have summarized the main conclusions.
2. Simulation methodologies
2.1. Model details
The aluminum oxide surface is simulated using the (0001) crystallographic plane of α-Al2O3 (space group) that is generally considered to be the most stable phase of aluminum oxide.23,24 In addition, the oil molecules are represented by hexadecane molecules (C16) that have been adopted in our pioneering work.25 To find out the influences of surface defects on the dynamics of conformational change and detachment of oil molecules in an aqueous solution, we created three types of surface defects as well as a perfect aluminum oxide surface according to the typical defects on the aluminum surface, as shown in Fig. S1.† As shown in Fig. 1, the perfect Al2O3 surface with an xy-size of 57.687 × 57.108 Å2 was placed in the x–y plane, whereas the defective alumina surfaces with pits, protrusions and groove defects were created by artificially removing the top layers of the perfect Al2O3 surface. | ||
| Fig. 1 Images for the four alumina surfaces with different topographies: (a) perfect, (b) pits, (c) grooves, and (d) protrusions. | ||
The constructed substrate surfaces were contaminated by oil molecules. As stated in our previous study,25 the surface coverage of oil molecules onto the perfect alumina surface has an evident influence on water-driven oil detachment. The defective alumina surfaces with two oil adsorption contents were established to eliminate the effect of the oil surface coverage. In this study, we mainly focused on the possible effects of surface defects on the detachment of oil molecules in an aqueous solution. A total of seven oil/alumina/aqueous solution systems were built by placing the water solution over the contaminated defective alumina surfaces. The detailed parameters for each oil/alumina/aqueous solution system are provided in Table 1.
| System | Surface | Defect/Å3 | Oil | Water |
|---|---|---|---|---|
| A | Perfect | 0 | 85 | 5504 |
| B | Pit | −24.2 × 20.17 × 12.97 | 85 | 5504 |
| C | 160 | 10![[thin space (1/6-em)]](https://www.rsc.org/images/entities/char_2009.gif) 000 000 |
||
| D | Groove | 24.2 × 57.108 × 12.97 | 85 | 5504 |
| E | 160 | 10![[thin space (1/6-em)]](https://www.rsc.org/images/entities/char_2009.gif) 000 000 |
||
| F | Protrusion | +24.2 × 20.17 × 12.97 | 85 | 5504 |
| G | 160 | 10![[thin space (1/6-em)]](https://www.rsc.org/images/entities/char_2009.gif) 000 000 |
2.2. Simulation setup
We performed MD simulations of the oil/alumina/aqueous solution systems at 300 K in the NVT ensemble using the free LAMMPS simulation package.26 In the simulations, the total potential energy consists of the potential energies arising from bond stretching, angle bending, torsion, and non-bonding interactions. Moreover, the non-electrostatic interactions between atoms were calculated using the Lennard-Jones potential, and the standard geometric mean combination rules were used for the van der Waals interactions between different atomic species. The system was accurately modeled using the CHARMM force field for the oil molecules27 and the CLAY force field for the alumina surface.28 A simple point-charge (SPC) model was used to describe the water molecules.29 The Nose–Hoover thermostat with a coupling time constant of 0.1 ps was adopted to control the system temperature with a time step of 2 fs. The particle–particle particle-mesh (PPPM)30 solver was utilized to provide the long-range electrostatic interactions using a cut-off distance of 10 Å. In this study, all the atoms of the defective alumina surface were kept rigid during the entire simulation. The SHAKE algorithm was adopted to constrain the bond lengths of the oil molecules and water molecules.31 Periodic boundary conditions were applied in the x and y directions, whereas the reflecting boundary condition was adopted in the z direction. In our simulations, all the atoms of the defective alumina surface were held frozen. The oil/alumina/aqueous solution systems were first energy minimized, and then, the aqueous solution was relaxed over 500 ps, with position restraints on the oil molecules. In the following simulations, the position restraints were removed, and then, the MD simulations were carried out for oil detachment. After each 2 ps, an image of the system conformation was obtained to deeply analyze the microscopic details of the dynamics of conformational changes, migration, and detachment of the oil molecules.During the entire simulation, the interaction energy between the oil molecules and alumina surface was calculated according to the following equation:
| E_inter_OS = Eoil+surface − Eoil − Esurface | (1) |
3. Results and discussion
3.1. Analysis of the effects of surface defects on the oil detachment process
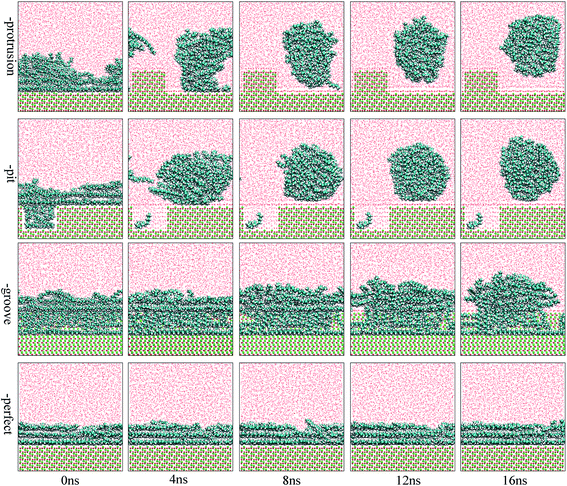
The focus of this study was to examine the effects of various types of surface defects on the detachment of oil molecules and the adsorption of water molecules from an aqueous solution to the alumina surface. Hence, detailed analysis of the time-dependent detachment process of the oil molecules was first performed. Fig. 2 and 3 show the images for the instantaneous conformations of oil molecules onto the defective alumina surfaces with pits, grooves, and protrusions. They provide an intuitive vision of the time-dependent changes in the adsorption conformations of the oil molecules on each defective Al2O3 surface. It can be clearly observed that evident changes in the adsorption conformation of the oil molecules occurred in all the cases. However, due to the effects of various surface defects, the final adsorption conformations of the oil molecules on the perfect alumina surface and three defective alumina surfaces exhibited significant differences.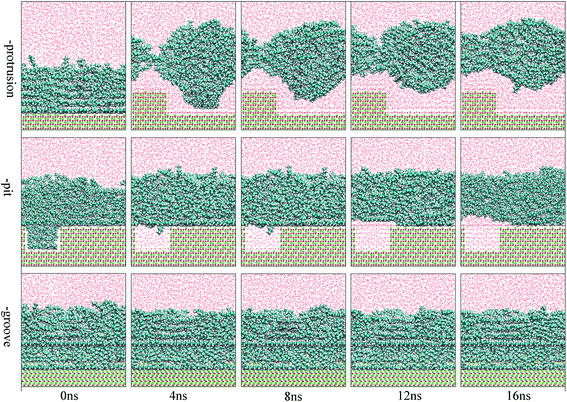 | ||
| Fig. 3 Images for the adsorption configuration of the oil molecules, at a high adsorption content, on the alumina surfaces with protrusions, pits, and grooves as a function of the simulation time. The color of each type of atom is consistent with those shown in Fig. 2. | ||
At low oil adsorption content, the oil molecules on the protruded alumina surface rolled up into an oil droplet. At the end of the simulation, they thoroughly detached, as displayed in Fig. 2. On the pitted alumina surface, except for those remaining inside the pits, most of the oil molecules detached. As for those adsorbed onto the grooved surface, an evident change in the adsorption conformation of the oil molecules occurred although they were not thoroughly detached. However, on the perfect alumina surface, no evident change in the adsorption conformation of the oil molecules was identified during the entire simulation. From abovementioned analysis, it can be inferred that the surface defects on the alumina surface have effectively promoted the conformational change of the oil molecules in the aqueous solution. Moreover, at low oil adsorption content, the effects of the protrusions and pits on the conformational changes of the oil molecules are much larger than those of the grooves.
With an increase in the oil adsorption content, the detachment of oil molecules adsorbed onto each defective alumina surface exhibits some new features. As shown in Fig. 3, after the entire simulation, the oil molecules adsorbed on the protruded alumina surface thoroughly detached, similar to that observed at low oil adsorption content. On the pitted alumina surface, despite the obvious change in their adsorption conformation, all the oil molecules on the pitted alumina surface were not thoroughly detached. Instead, one relatively stable adsorption conformation of the oil molecules was obtained. For the oil molecules adsorbed on the grooved alumina surface, their adsorption conformation approximately remained unchanged. On the basis of the abovementioned observations, it can be inferred that the surface defects have an evident influence on the oil detachment process regardless of different oil adsorption contents. Moreover, the effects of the surface defects on the conformational change of the oil molecules follow the order grooves < pits < protrusions.
3.2. Analysis of water adsorption on the defective alumina surface
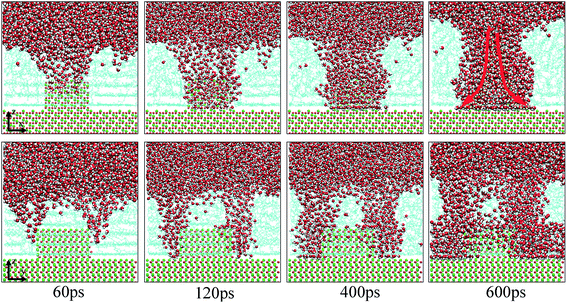
As extensively addressed in previous studies,16,25 the water channel that connects the oil/solid interface and oil/aqueous solution interface is vital for the detachment of oil molecules. From the MD trajectory files, it was observed that on each defective alumina surface, the formation of a water channel rapidly occurred after the simulation, which was much faster than that on the perfect alumina surface. Hence, it can be expected that the surface defects are helpful for the adsorption of water molecules onto the substrate surface, thereby effectively promoting the oil detachment process. In this section, the microscopic details of the adsorption process of water molecules onto the different defective alumina surfaces have been comprehensively analyzed.From the trajectory files, we found that the adsorption process of water molecules on the defective alumina surface exhibited different characteristics depending on the surface topographies and oil adsorption contents. Moreover, on the defective alumina surface, the water molecules could be adsorbed on not only the uppermost surface, but also the defect surfaces. To quantitatively study the difference between the adsorption processes of the water molecules onto the defect surface and the uppermost surface, the number of water molecules adsorbed on the entire defective alumina surface (Num_all), the number of those inside the surface defect (Num_defect), and the number of those in the first adsorption layer (Num_first) were calculated. According to the topography of each type of surface defect, the Num_defect were labeled as Num_groove, Num_pit, and Num_protrusion. In the present study, the oil molecules at different adsorption contents were mainly located below the z values of about 10 or 20 Å. The regions below the z values of about 10 and 20 Å were used for the calculation of Num_all. In addition, the region below the z value of 0 Å was adopted to count the number of water molecules inside the surface defects.
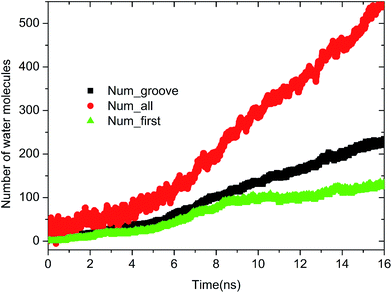 | ||
| Fig. 4 Time evolution of Num_all, Num_groove, and Num_first on the grooved alumina surface at low oil adsorption contents. | ||
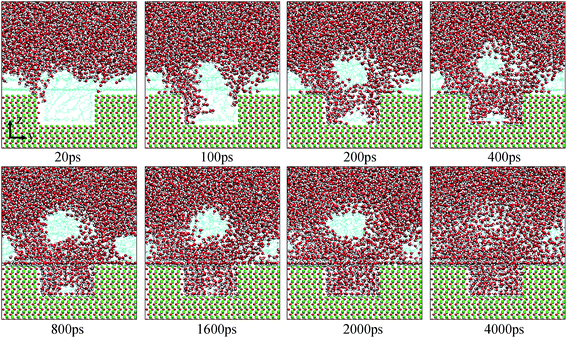 | ||
| Fig. 7 Evolution of the water channels on the pitted alumina surface at low oil adsorption contents. The color of each type of atom is consistent with those shown in Fig. 6. For clarity, parts of atoms of the protruded alumina surface have been deleted. | ||
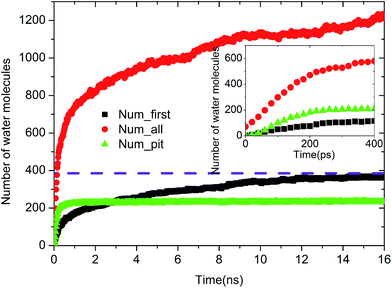 | ||
| Fig. 8 Time evolution of Num_all, Num_pit, and Num_first on the pitted alumina surface at low oil adsorption contents. | ||
Upon increasing the oil adsorption content, the adsorption process of the water molecules on the pitted alumina surface tends to become more complex. Fig. 9 displays the time evolution of Num_all, Num_pit, and Num_first on the pitted alumina surface at high oil adsorption contents. As shown, the Num_all profile was divided into seven stages via evident turning points (A0–A7). Each stage represents one case in the evolution process of the water channel. Moreover, note that the Num_all, as shown in Fig. 9, approximately remains unchanged in the stages of (A2–A3), (A4–A5), and (A7–), which indicates that the adsorption of the water molecules onto the pitted surface is not continuous.
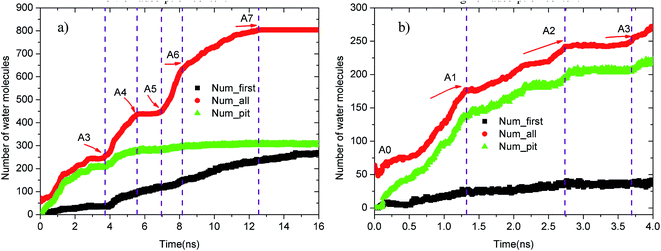 | ||
| Fig. 9 Time evolution of Num_all, Num_groove, and Num_1 on the pitted alumina surface at high oil adsorption contents: (a) 0–16 ns and (b) 0–4 ns. | ||
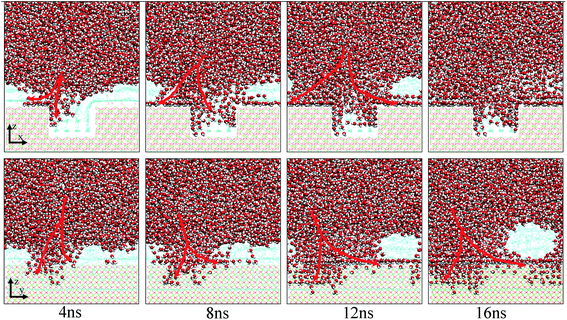
Fig. 10 shows the typical images for the water channels at each stage of the entire simulation. As shown, parts of water molecules have been adsorbed on the inner surfaces of the pit defects via two small water channels at about 1 ns. Subsequently, one water channel disappeared at 2 ns. At 3 ns, the remaining channel also disappeared and the adsorption of water molecules on the pitted alumina surface temporarily ended. At 5 ns, one water channel was formed again. At the same time, the adsorption of the water molecules on the pit defects completed. In the following stages, the water molecules mainly adsorbed on the uppermost surface of the pitted alumina substrate. Moreover, the water channel undergoes an evolution process consisting of formation, expansion, shrinkage, and disappearance.
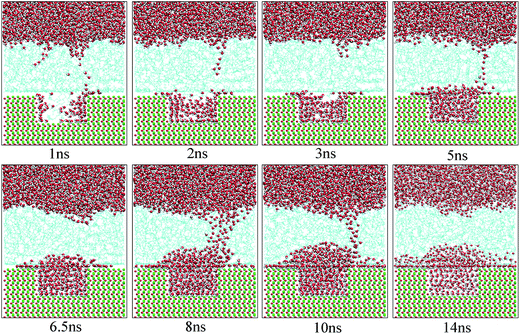 | ||
| Fig. 10 Time evolution of the water channels on the pitted alumina surface at high oil adsorption contents. The color of each type of atom is consistent with those shown in Fig. 6. | ||
In addition, it can be seen from Fig. 9 that the Num_first approximately remains unchanged during the first 4 ns, whereas Num_pit largely increases, illustrating that the water molecules are preferentially adsorbed on the inner surfaces of the pits at the early stage of simulation. As the adsorption of the water molecules on the pits is approximately completed at about 4 ns, a large amount of water molecules are subsequently adsorbed on the uppermost surface of the substrate, thereby forming the adsorption layers of water molecules. At about 12.5 ns, the Num_all gradually converges to about 804, indicating the end of the adsorption of water molecules from the aqueous solution on the pitted alumina surface.
From abovementioned analysis, it can be concluded that the surface defects effectively affect the adsorption of the water molecules on the alumina surface. The adsorption process of water molecules on the defective alumina surface exhibits different characteristics depending on the surface topographies and oil adsorption contents.
3.3. The effects of the surface defects on the driving forces of the oil detachment process
According to the abovementioned discussion, note that the surface defects greatly influence the microscopic processes of oil detachment and water adsorption. As is well-known, the conformational changes and detachment of oil molecules on the solid surface are the result of the hybrid oil–solid, water–solid, and water–oil interactions. It can be expected that the surface defects change these interfacial interactions, thereby affecting the microscopic detachment process of oil molecules in an aqueous solution. For this reason, the effect of surface defects on the oil–alumina and water–alumina interactions for each alumina surface was mainly investigated.| Oil–alumina interaction energy (kcal mol−1) | Low oil adsorption content | High oil adsorption content | ||||
|---|---|---|---|---|---|---|
| E_inter_OS | Evdw | Ecoul | E_inter_OS | Evdw | Ecoul | |
| Perfect | −851.91 | −618.33 | −233.58 | |||
| Groove | −1124.91 | −791.70 | −333.21 | −1157.73 | −816.98 | −340.75 |
| Protrusion | −1497.95 | −733.15 | −764.80 | −1749.81 | −901.17 | −848.64 |
| Pit | −1443.85 | −751.35 | −692.50 | −1534.03 | −781.88 | −753.15 |
When the contaminated alumina surface was immersed in an aqueous solution, the adsorption strength of the oil molecules on the solid surface tended to change. Fig. 11 illustrates the time-dependent changes of E_inter_OS in each system. As seen in Fig. 11(a), once the simulation began, the E_inter_OSs of the pitted and protruded alumina surfaces at low oil adsorption contents rapidly increased. Then, they finally converged to about −1.56 and −32.78 kcal mol−1. It clearly illustrates the end of the conformational change and detachment of the oil molecules. On the grooved alumina surface, the E_inter_OS largely increases from −1124.91 to −490.89 kcal mol−1 during the entire simulation. The large slope of the E_inter_OS profile at 16 ns indicates that the detachment of the oil molecules is still being carried out, the completion of which should take much more time. As for the perfect alumina surface, the E_inter_OS approximately remains unchanged, except for the slight decrease of about −15.62 kcal mol−1.
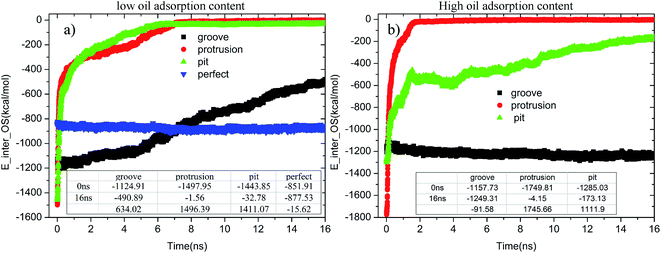 | ||
| Fig. 11 Time evolution of E_inter_OSs for each system during the molecular dynamics simulation: (a) low oil adsorption content and (b) high oil adsorption content. | ||
At high oil adsorption contents, as displayed in Fig. 11(b), the E_inter_OS of the protruded alumina surface finally converges to about −4.15 kcal mol−1. On the pitted surface, due to the increase of oil adsorption content, the E_inter_OS of the pitted surface finally increases to about −173.13 kcal mol−1, clearly indicating that the oil molecules are not thoroughly detached from the solid surface. On the grooved alumina surface, the E_inter_OS slightly decreases to about −1249.31 kcal mol−1, similar to that of the perfect alumina surface at low oil adsorption contents.
In this present study, it was observed that at high oil adsorption contents, one oil adsorption layer with a thickness of about 20 Å was formed. On the perfect alumina surface, the oil adsorption layer at this thickness effectively prevented the adsorption of water molecules from the aqueous solution on the alumina surface. The adsorption of the water molecules onto the perfect alumina surface was not observed during the entire simulation. However, the water molecules were rapidly adsorbed on the pitted and protruded alumina surfaces after the simulation regardless of high oil adsorption contents. Thus, it can be inferred that the surface defects are helpful for the early adsorption of water molecules on the alumina surface. For this reason, the effects of the surface defects on the driving forces, including the non-bonding and hydrogen-bonding interactions between water and the alumina surface, for water adsorption were deeply analyzed.
Table 3 shows the non-bonded interaction energy (E_inter_WS), van der Waals energy (Evdw), and electrostatic energy (Ecoul) between water and each alumina surface at 0 ns based on the effects of the surface defects and oil adsorption contents. As shown, the E_inter_WSs of the perfect and each defective alumina surface follows the order perfect < grooves < pits < protrusions despite the different oil adsorption contents. The higher E_inter_WS of each defective alumina surface indicates that the surface defects evidently strengthen the water–alumina interactions, facilitating the early adsorption of the water molecules from the aqueous solution on the alumina surface. At low oil adsorption contents, the E_inter_WS of the protruded or pitted alumina surfaces is approximately equal to Ecoul, and the Evdw is very small, implicating that the water–alumina interactions of the protruded and pitted alumina surfaces are mainly contributed by the electrostatic interactions. On the perfect and grooved alumina surfaces, although the Ecoul was also much larger than Evdw (0 kcal mol−1), the E_inter_WSs were very small and could be neglected. As a consequence, the early adsorption of the water molecules on the perfect and grooved alumina surfaces tends to be much more difficult, which occurs after a relatively long relaxation process.
| Water–alumina interaction energy (kcal mol−1) | Low oil adsorption content | High oil adsorption content | ||||
|---|---|---|---|---|---|---|
| E_inter_WS | Evdw | Ecoul | E_inter_WS | Evdw | Ecoul | |
| Perfect | −5.44 | 0 | −5.44 | 0 | 0 | 0 |
| Groove | −49.43 | 0 | −49.43 | −0.59 | 0 | −0.59 |
| Protrusion | −5329.18 | −530.56 | −4798.62 | −887.41 | −0.13 | −887.28 |
| Pit | −1431.77 | −25.11 | −1406.66 | −183.40 | 0 | −183.40 |
At high oil adsorption contents, as illustrated in Table 3, the Evdw of each surface was about 0 kcal mol−1 despite different surface defects. However, the water molecules are still rapidly adsorbed on the pitted and protruded alumina surfaces after the simulation. Thus, it can be inferred that at high oil adsorption contents, the early adsorption of the water molecules on the defective alumina surface was driven by the electrostatic interactions between the aqueous solution and alumina surface. Moreover, the Ecoul of each alumina surface follows the order perfect < grooves < pits < protrusions, clearly indicating that the surface defects can enhance the electrostatic part of the oil–alumina interactions to different degrees. On the basis of abovementioned discussions, it can be concluded that the early adsorption of the water molecules on the alumina surface is mainly driven by the electrostatic interactions, ignoring the different surface defects and oil adsorption contents.
Fig. 12(a) and (b) provide the time evolution of the E_inter_WS for each alumina surface at low and high oil adsorption contents, respectively. From the figures, it can be clearly observed that the interaction strength between the water molecules and alumina surface undergoes different changes due to the effects of the pit, protrusion, and groove defects. At low oil adsorption contents, as shown in Fig. 12(a), the E_inter_WSs of the pitted and protruded alumina surfaces have dramatically decreased by about −26![[thin space (1/6-em)]](https://www.rsc.org/images/entities/char_2009.gif) 354.1 and −28
354.1 and −28![[thin space (1/6-em)]](https://www.rsc.org/images/entities/char_2009.gif) 822.05 kcal mol−1, respectively. However, the E_inter_WS of the perfect alumina surface slightly decreased to about −167.42 kcal mol−1, implying that just several water molecules passed through the oil adsorption layers and adsorbed on the alumina perfect surface at 16 ns. Moreover, the final slope of the E_inter_WS profile of the perfect alumina surface was very small; thus, the water channel was not fully formed. As for the grooved alumina surface, despite the sharp decrease from about −49.43 to about −6890.87 kcal mol−1, the E_inter_WS tends to decrease with a large slope, indicating that the adsorption of the water molecules onto the alumina surface is still being carried out. In addition, note that the slope of the E_inter_WS of each alumina surface follows the order – perfect < -grooves < -pits < -protrusions. It clearly indicates that the adsorption velocity of the water molecules from the aqueous solution on each surface also follows the order – perfect < -grooves < -pits < -protrusions.
822.05 kcal mol−1, respectively. However, the E_inter_WS of the perfect alumina surface slightly decreased to about −167.42 kcal mol−1, implying that just several water molecules passed through the oil adsorption layers and adsorbed on the alumina perfect surface at 16 ns. Moreover, the final slope of the E_inter_WS profile of the perfect alumina surface was very small; thus, the water channel was not fully formed. As for the grooved alumina surface, despite the sharp decrease from about −49.43 to about −6890.87 kcal mol−1, the E_inter_WS tends to decrease with a large slope, indicating that the adsorption of the water molecules onto the alumina surface is still being carried out. In addition, note that the slope of the E_inter_WS of each alumina surface follows the order – perfect < -grooves < -pits < -protrusions. It clearly indicates that the adsorption velocity of the water molecules from the aqueous solution on each surface also follows the order – perfect < -grooves < -pits < -protrusions.
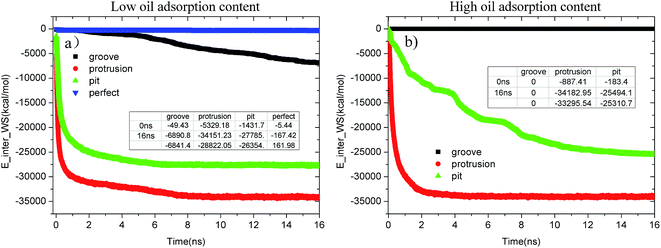 | ||
| Fig. 12 Evolution of E_inter_WS in each system as a function of time during the molecular dynamics simulation. (a) Low oil adsorption content and (b) high oil adsorption content. | ||
With the increase in the oil adsorption content, the impact of each type of surface defect tends to become much more significant, which can be clearly determined from Fig. 12(b). As shown, on the grooved alumina surface at high oil adsorption contents, the water molecules do not penetrate into the oil adsorption layer during the entire simulation; thus, the E_inter_WS stabilizes to be about 0 kcal mol−1. The E_inter_WS of the protruded alumina surface rapidly converges to a stable value of about −34![[thin space (1/6-em)]](https://www.rsc.org/images/entities/char_2009.gif) 182.95 kcal mol−1, approximately equaling to the converged values of E_inter_WS at low oil adsorption contents. On the pitted alumina surface, the E_inter_WS largely decreased to about −25
182.95 kcal mol−1, approximately equaling to the converged values of E_inter_WS at low oil adsorption contents. On the pitted alumina surface, the E_inter_WS largely decreased to about −25![[thin space (1/6-em)]](https://www.rsc.org/images/entities/char_2009.gif) 494.1 kcal mol−1.
494.1 kcal mol−1.
Therefore, the surface defects evidently affect the non-bonding interactions between the water solution and alumina surface to different extents. Moreover, the effect of each type of surface defect follows the sequence grooves < pits < protrusions.
Fig. 13 shows the evolution profiles of the number of H-bonds between the water solution and defective alumina surface in each system. As shown, the number of H-bonds in each system tends to change with various trends due to the effect of the surface defects and oil adsorption contents. As observed from Fig. 13(a), at 0 ns, the number of H-bonds on the protruded alumina surface at low oil adsorption contents was 20. This means that the protruded alumina surface was not fully covered by the oil molecules and parts of the water molecules came into direct contact with the bare part of the alumina surface. Moreover, the number of H-bonds formed on the pitted and protruded alumina surface finally converges to about 378 and 406, respectively. The difference in the converged H-bond numbers indicates that more H-bonds can be formed between water and the protruded alumina surface. Thus, the H-bond interactions play a more important role in the detachment of oil molecules from the protruded alumina surface when compared with that from the pitted surface. With the increasing oil adsorption content, as shown in Fig. 13(b), the number of H-bonds on the protruded alumina surface also converged to about 406 at about 2 ns. However, the number of H-bonds on the pitted alumina surface still rapidly increased, whereas that on the grooved surface was always zero during the entire simulation. This clearly indicates that the formation of the H-bonds between the water solution and alumina surface was affected by the surface defects. Moreover, from the time evolution of the H-bond number, it can be determined that the effects of the surface defects on the H-bond interactions follow the sequence grooves < pits < protrusions.
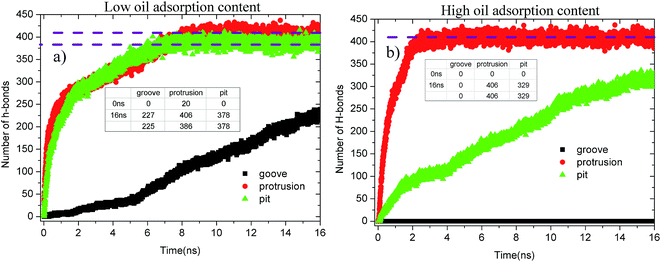 | ||
| Fig. 13 Evolution profiles of the H-bond number in different systems as a function of time: (a) low oil adsorption content and (b) high oil adsorption content. | ||
To summarize, the detachment of the oil molecules was effectively promoted by the surface defects on the substrate surface. Due to the effects of the surface defects, both the interaction strength of the oil–alumina and that of the water–alumina interactions were effectively improved. As is known, the strengthening of the oil–alumina interactions is helpful for the oil adsorption process; thus, the defective alumina surfaces have higher adsorption energy with the oil molecules. However, the detachment of the oil molecules from the defective surface tends to be much easier than that from the perfect alumina surface. This should be ascribed to the surface defect-induced improvement of the water–alumina interactions. It can be concluded that the surface defects have effectively promoted the oil detachment via evidently enhancing the water–alumina interactions.
4. Conclusions
In this study, the conformational changes on and detachment of oil molecules from the perfect and defective Al2O3 surfaces were studied via classical MD simulations. A perfect alumina surface and three types of defective alumina surfaces with pits, protrusions, and grooves were built to indicate the effects of various types of surface defects on the oil detachment process.Evident conformational changes on and even detachment of the oil molecules from the Al2O3 surfaces occurred in each defective alumina surface. Our simulation results suggest that surface defects can evidently improve the interactions between the oil molecules and alumina surface, thereby restraining the oil detachment process. However, due to effect of the surface defects, the interactions between the aqueous solution and alumina surface are also evidently strengthened, effectively facilitating the diffusion of water molecules towards the alumina surface and further promoting the oil detachment process. When compared with the perfect alumina surface, the detachment of the oil molecules from the defective alumina surface tends to become much easier. Thus, from the view of oil detachment, the enhancement of the aqueous solution–alumina interactions is more important than the improvement of the oil–alumina surface. The effect of the surface defects on the oil detachment process follows the order perfect < grooves < pits < protrusions.
Further, due to different topographies of the various defects, the adsorption processes of the water molecules on the defective surfaces exhibit new features. On the pitted alumina surface and protruded surface, the water molecules are preferentially adsorbed on defect surfaces. On the grooved alumina surface, the water molecules are absorbed on the uppermost surface and the defect surface of the defective alumina surface at the same time.
Acknowledgements
The authors gratefully acknowledge the financial support received from the National Natural Sciences Foundation of China (No. 51475108 and 51535003). We would also like to thank the reviewers for the valuable comments.References
- J. Zhu, H. An and M. Alheshibri, Langmuir, 2016, 32, 11203–11211 CrossRef CAS PubMed.
- P. D. I. Fletcher, L. D. Savory, W. Freya, C. Andrew and A. M. Howe, Langmuir, 2015, 31, 3076–3085 CrossRef CAS PubMed.
- S. R. Qiu, N. M. A. Orton, R. N. Raman, A. M. Rubenchik, C. D. Boley and A. Rigatti, Appl. Opt., 2015, 54, 8607–8616 CrossRef CAS PubMed.
- A. Weerawardena, C. J. Drummond and F. Caruso, Langmuir, 1998, 14, 575–577 CrossRef CAS.
- K. Gotoh, J. Surfactants Deterg., 2005, 8, 305–310 CrossRef CAS.
- C. Scheuerlein and M. Taborelli, Appl. Surf. Sci., 2006, 252, 4279–4288 CrossRef CAS.
- A. W. Rowe, A. N. Davis, R. M. Counce and S. A. Morton III, Sep. Sci. Technol., 2003, 38, 2793–2813 CrossRef CAS.
- H. Zhang, A. Nikolov and D. Wasan, Langmuir, 2014, 30, 9430–9435 CrossRef CAS PubMed.
- A. W. Rowe, R. M. Counce and S. A. Morton III, Ind. Eng. Chem. Res., 2002, 41, 1787–1795 CrossRef CAS.
- V. Thoreau, B. Malki and G. Berthome, J. Adhes. Sci. Technol., 2006, 20, 1819–1831 CrossRef CAS.
- J. Zhong, X. Wang and J. Du, J. Phys. Chem. C, 2013, 117, 12510–12519 CAS.
- C. Wang, F. Ding and D. Tang, Int. J. Mach. Tool Manufact., 2016, 108, 13–26 CrossRef.
- M. Mukaida and J. Yan, Int. J. Mach. Tool Manufact., 2017, 115, 2–14 CrossRef.
- Y. C. Lin and H. S. Lee, Int. J. Mach. Tool Manufact., 2008, 48, 1179–1186 CrossRef.
- H. Yan and S. Yuan, J. Phys. Chem. C, 2016, 120, 2667–2674 CAS.
- Q. Liu, S. Yuan and H. Yan, J. Phys. Chem. B, 2012, 116, 2867–2875 CrossRef CAS PubMed.
- T. Zehl, M. Wahab and R. Schmidt, J. Mol. Liq., 2009, 147, 178–181 CrossRef CAS.
- C. Chen, L. Zhuang and X. Li, Langmuir, 2011, 28, 1330–1336 CrossRef PubMed.
- F. C. Wang and H. A. Wu, Soft Matter, 2013, 9, 7974–7980 RSC.
- M. Sedghi, M. Piri and L. Goual, Langmuir, 2016, 32, 3375–3384 CrossRef CAS PubMed.
- P. Zhang, Z. Xu and Q. Liu, J. Chem. Phys., 2014, 140, 164702 CrossRef PubMed.
- C. Li and P. Choi, J. Phys. Chem. C, 2007, 111, 1747–1753 CAS.
- I. C. Yeh, J. L. Lenhart and B. C. Rinderspacher, J. Phys. Chem. C, 2015, 119, 7721–7731 CAS.
- D. Argyris, T. Ho and D. R. Cole, J. Phys. Chem. C, 2011, 115, 2038–2046 CAS.
- W. Xie, H. Liu and Y. Sun, Appl. Surf. Sci., 2017, 392, 747–759 CrossRef CAS.
- S. J. Plimpton, Comput. Phys., 1995, 117, 1–19 CrossRef CAS.
- R. W. Pastor and A. D. Mackerell, J. Phys. Chem. Lett., 2011, 2, 1526–1532 CrossRef CAS PubMed.
- R. T. Cygan, J. J. Liang and A. G. Kalinichev, J. Phys. Chem. B, 2004, 108, 1255–1266 CrossRef CAS.
- H. J. C. Berendsen, J. R. Grigera and T. P. Straatsma, J. Phys. Chem., 1987, 91, 6269–6271 CrossRef CAS.
- E. L. Pollock and J. Glosli, Comput. Phys. Commun., 1996, 95, 93–110 CrossRef CAS.
- H. C. Andersen, J. Comput. Phys., 1983, 52, 24–34 CrossRef CAS.
Footnote |
| † Electronic supplementary information (ESI) available. See DOI: 10.1039/c7ra04766e |
| This journal is © The Royal Society of Chemistry 2017 |

