DOI:
10.1039/C7RA04939K
(Paper)
RSC Adv., 2017,
7, 32120-32125
Photocatalytic degradation of imidazolium ionic liquids using dye sensitized TiO2/SiO2 composites†
Received
2nd May 2017
, Accepted 12th June 2017
First published on 23rd June 2017
Abstract
Ionic liquids (ILs) are widely applied in diverse fields, however, ILs bring considerable challenges to the ecosystem when exposed to the environment due to their cytotoxicity and high chemical stability. It is thus increasingly important to investigate measures for the degradation of IL wastes in industrial processes. This paper presents the preparation of dye-sensitized photocatalysts (DCQ-TiO2/SiO2) and their applications in the degradation of 4 imidazolium ILs (1-butyl-3-methylimidazolium bromide, [BMIM]Br; 1-butyl-3-methylimidazolium tetrafluoroborate, [BMIM]BF4; 1-butyl-3-methylimidazolium hexafluorophosphate, [BMIM]PF6; 1-butyl-3-methylimidazolium bis(trifluoromethylsulfonyl)imide, [BMIM]NTf2). The photocatalysts are prepared through in situ incorporation of TiO2 into silica matrices and sensitization with 2,9-dichloroquinacridone (DCQ). The photocatalysts are then characterized with N2 adsorption–desorption isotherm measurements, transmission electron microscopy (TEM), X-ray diffraction (XRD), Raman spectroscopy, Fourier transform infrared spectroscopy (FT-IR), elemental analysis and ultraviolet-visible diffuse reflectance spectroscopy (UV-vis DRS). The results show that these photocatalysts exhibit high catalytic activities when they are applied in the degradation of imidazolium ILs. The degradation efficiency for [BMIM]Br can reach up to 95% under simulated sunlight irradiation in 180 minutes. The photodegradation intermediates of [BMIM]+ are identified as harmless and easily biodegradable moieties.
1. Introduction
In the past two decades, ionic liquids (ILs) have attracted considerable interest in the diverse fields of synthesis, catalysis, materials science, separation technology,1 and CO2 capture.2,3 The increasing research interest is due to the following unique physicochemical characteristics of ILs: tuneable structures and properties, negligible vapor pressure, excellent chemical and thermal stability4 as well as high polarity and ionic conductivity.5 However, the high thermal and chemical stability lead to the persistence and accumulation of ILs in the environment in the case of any industrial leakage.6,7 Meanwhile, there have been several reports discussing the toxicity of ILs to algae, bacteria, fungi, invertebrates, and vertebrates.8–12 Exposed ILs will thus be a challenge to terrestrial ecosystems.13 It is essential to investigate efficient and economic measures for the degradation of ILs.
A series of studies reported the mineralization of ILs with Fenton reagents,14–16 UV radiation,17–19 sonication,20 and gamma irradiation21,22 as aids. The use of UV radiation showed good performance in the degradation of ILs. It is important to further evaluate the efficiency of UV usage, the catalytic activity and recyclability of TiO2.20 Due to the high photocatalytic activity, nontoxicity and good chemical stability, TiO2 is regarded as an ideal and powerful photocatalyst.23 However, its band gap is as high as 3.2 eV and it can only be excited by the UV light that makes up only 3–5% of the entire solar spectrum.24–26 In addition, there are also difficulties in practical applications of TiO2. Although the common form of ultrafine powder increases the surface area and the number of active sites,27 it is easy to be agglomerated into large particles in aqueous solutions. The photocatalytic performance is thus reduced.28
To solve the aforementioned problem, several studies have been performed to support TiO2 onto a wide variety of materials such as zeolites,27,28 glass beads29 and glass capillaries30 for the photocatalytic degradation of methylene blue, methyl orange and agri-food industry effluents. In this study, a series of TiO2/SiO2 are in situ synthesized and then sensitized with 2,9-dichloroquinacridone (DCQ) in order to show better photocatalytic abilities upon full solar spectrum irradiation. The dye-sensitized photocatalysts (DCQ-TiO2/SiO2) are characterized through BET, TEM, XRD, Raman, FT-IR, elemental analysis and UV-vis DRS, and are then used in the degradation of some imidazolium ionic liquids. Experimental results show that the dye sensitization of titania–silica materials with DCQ can significantly increase the photodegradation efficiency. More than 95% of [BMIM]Br can be degraded within 180 min under simulated sunlight irradiation. The photodegradation intermediates of [BMIM]+ are identified as 2-oxo-2-ureidoacetic acid, butyric acid and others. These intermediates are harmless and can be easily biodegraded in the ecosystem.
2. Experimental
2.1 Synthesis of the photocatalysts
In this study, TiO2/SiO2 composite materials were prepared according to the method reported in literature.31,32 Triblock copolymer P123 (EO20PO70EO20, Mw = 5800, Sigma-Aldrich) was used as the structure-directing agent, tetramethoxysilane (TMOS, Acros) and tetrabutyl orthotitanate (TBOT, Acros) were used as the silica source and titania source, respectively. All reagents were used as received. The catalysts obtained are denoted as X% TiO2/SiO2 (X = 0, 10, 20, 30, 40), where X stands for the mass ratio of Ti in the whole synthesis gel (X = 0, the catalyst obtained is SBA-15). In a typical synthesis of 30% TiO2/SiO2, 8.0 g of P123 was dissolved in 160 mL of 1 mol L−1 HCl solution under magnetic stirring at room temperature. Subsequently, 9.2 g of TMOS and 6.6 g of TBOT were added to the solution. The resulting mixture was stirred for 24 h at 40 °C. Hydrothermal crystallization was then performed in a Teflon-lined autoclave for 24 h at 110 °C. The white product was separated using vacuum filtration and was then washed with 1 mol L−1 HCl (25 mL × 3). The solid obtained was dried for 10 h at 100 °C and subsequently calcined for 5 h at 550 °C to remove the template. The dye-sensitized photocatalyst DCQ-30% TiO2/SiO2 was prepared in the following way: 2.0 g of 30% TiO2/SiO2 was dispersed in 100 mL of acidic methanol solution (pH = 4.7) under vigorous stirring for 15 min. 40 mL methanol solution of 0.01 mol L−1 DCQ (Gaoyou Auxiliary Factory) was then added. The mixture was stirred for 24 h at room temperature. After the reaction, the precipitate was separated using vacuum filtration and was washed with methanol (60 mL × 3). The solid obtained was then dried for 10 h at 100 °C in vacuum.
2.2 Characterization of the photocatalysts
The textural properties of the photocatalysts were determined by N2 adsorption–desorption isotherms at −196 °C using a Micromeritics ASAP-2010. Prior to adsorption, the samples were thoroughly degassed at 150 °C for 8 h under vacuum to remove water and other physically adsorbed species. The specific surface area (SBET) was calculated through the standard Brunauer–Emmett–Teller (BET) method. TEM images were captured on a JEM-2100 microscope (JEOL) operated at 200 kV. XRD patterns of the samples were obtained on a D/max-3A diffractometer (Rigaku) equipped with a CuKα X-ray source (40 kV, 30 mA, λ = 0.154 nm) and Ni filter. Diffractograms were recorded in the 2θ ranges of 0.6–10° (small angle) and 10–80° (wide angle) at a scanning step of 0.02°. Raman spectroscopy was carried out on a LabRamHR spectrometer (Horiba Jobin Yvoc Inc.). All experiments were performed on the electrode surface by using a 632.8 nm excitation line from an internal He–Ne laser with a power of 6 mW. FT-IR spectra were recorded on an Equinox-55 spectrophotometer (Bruker) by KBr wafer technique. Elemental analysis was performed on a Vario EL III (Elementar). UV-vis DRS were obtained in the wavelength of 200–800 nm by a UV-vis spectrophotometer (Shimadzu U-3010) equipped with an integrating sphere assembly and BaSO4 was used as a reflectance standard.
2.3 Test of photocatalytic activity
The photocatalytic degradation of ionic liquids was conducted using X% TiO2/SiO2 and DCQ-X% TiO2/SiO2 as photocatalysts under simulated sunlight irradiation provided by a 300 W Xe lamp (CEL-HXUV300, Beijing Au light company). A quartz reactor with cooling jacket was used to keep the temperature controlled at 25 °C. In each experiment, 0.2 g of photocatalyst was ultrasonically dispersed in a 100 mL of solution, where the concentrations of ionic liquids and H2O2 were 45 mg L−1 and 14 mg L−1 respectively, and pH was adjusted to 3.9. The suspension was magnetically stirred at 200 rpm and then stored in dark for 30 min to reach adsorption–desorption equilibrium. 1 mL of sample was then taken out as a blank control to eliminate the effects of adsorption. During the degradation process, 1 mL of sample was collected by a pipette at 30 min intervals and then filtered through a 0.45 μm cellulose membrane (Millex, Millipore). The degradation degree of ionic liquids was measured by high-performance liquid chromatography (HPLC, Agilent 1200) equipped with a reverse-phase C18 analytical column (Zorbax SB-C18). A water–acetonitrile mixture (70![[thin space (1/6-em)]](https://www.rsc.org/images/entities/char_2009.gif) :
:![[thin space (1/6-em)]](https://www.rsc.org/images/entities/char_2009.gif) 30, v/v) was used as the mobile phase. The flow rate was set to be 1 mL min−1. The degradation efficiency (D%) was then calculated according to eqn (1):
30, v/v) was used as the mobile phase. The flow rate was set to be 1 mL min−1. The degradation efficiency (D%) was then calculated according to eqn (1):| | |
D% = (C0 − Ct)/C0 × 100
| (1) |
where C0 is the initial concentration of ionic liquids, and Ct is the concentration of ionic liquids after irradiation for a selected time interval. To identify intermediates in the photocatalytic degradation of ionic liquids (mainly the cation of [BMIM]+), liquid chromatography-mass spectrometry (LC/MS) was performed on an Agilent 1100/Esquire HCT PLUS equipped with an electrospray ionization source.
3. Results and discussion
3.1 N2 adsorption–desorption isotherms
The textural properties of SBA-15, X% TiO2/SiO2, and DCQ-X% TiO2/SiO2 samples were investigated and shown in Fig. 1. All samples display type IV isotherms and hysteresis loops in the relative pressure range of 0.5 < P/P0 < 0.9. These features are associated with capillary condensation of N2 in primary mesopores,28 which therefore indicate that the samples are mesoporous materials. Hysteresis loops of X% TiO2/SiO2 and DCQ-X% TiO2/SiO2 show reduced sharpness and are shifted to lower relative pressures (P/P0) over a larger range of P/P0 with the incorporation of TiO2 and DCQ in the matrix of SiO2, indicating that pores in these samples are less uniform and smaller.32–34 Detailed information on SBET, average pore diameter (DBJH), and pore volume (Vpore) is given in Table S1 (ESI†). It shows that higher TiO2 loadings in the samples result in the decrease of SBET. Further, SBET of DCQ-X% TiO2/SiO2 are smaller than that of their counterpart (X% TiO2/SiO2) due to the introduction of DCQ. Nonetheless, the SBET values of all materials remain high (836.9–496.6 m2 g−1).
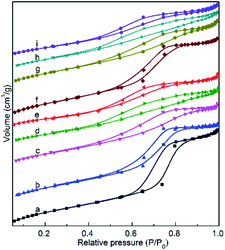 |
| | Fig. 1 N2 adsorption–desorption isotherms of the samples: (a) SBA-15; (b)–(e) 10, 20, 30, 40% TiO2/SiO2, (f)–(i) DCQ-10, 20, 30, 40% TiO2/SiO2. | |
3.2 XRD analysis
Small-angle XRD patterns of SBA-15, X% TiO2/SiO2, and DCQ-X% TiO2/SiO2 samples are shown in Fig. 2A. SBA-15 produces three reflections of (1 0 0), (1 1 0), and (2 0 0), which correspond to a two-dimensional hexagonal meso-structure of the p6mm space group with high structural periodicity.35,36 The samples of 10% TiO2/SiO2 and DCQ-10% TiO2/SiO2 produce XRD patterns similar to that of SBA-15, indicating that they retain the SBA-15 structure. However, the diffraction intensities of the (1 1 0) and (2 0 0) reflections decrease gradually with increasing TiO2 loadings, implying that the unit cell dimensions and the order of the meso-structures will be affected by the incorporation of more TiO2,35,36 as confirmed by the TEM images.
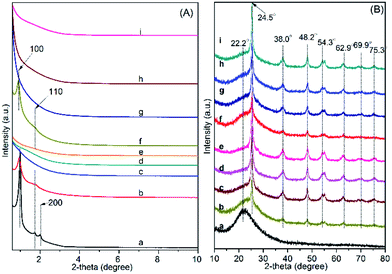 |
| | Fig. 2 Small-angle (A) and wide-angle (B) XRD spectra of the samples: (a) SBA-15; (b)–(e) 10, 20, 30, 40% TiO2/SiO2, (f)–(i) DCQ-10, 20, 30, 40% TiO2/SiO2. | |
Wide-angle XRD patterns are presented in Fig. 2B. SBA-15 shows diffraction patterns with a broad peak at 22.2°. All patterns of TiO2/SiO2 and DCQ-TiO2/SiO2 samples show peaks at 2θ = 24.5°, 38.0°, 48.2°, 54.3°, 62.9°, 69.9°, and 75.3° (JCPDS-ICDD no. 21-1272), which are assigned to the anatase reflections of (1 0 1), (0 0 4), (2 0 0), (1 0 5 and 2 1 1), (2 0 4), (1 1 6 and 2 2 0), and (2 1 5), respectively.28 Intensities of these peaks increase markedly with increasing TiO2 loadings. No peak for the (1 1 0) rutile reflection at 27.4° has been detected in the patterns of all samples. These results indicate that TiO2 in the samples is pure anatase with no secondary crystal phases of either brookite or rutile. It was reported that anatase in pure TiO2 would transform to rutile when the calcination temperature was higher than 400 °C.37 In this study, no rutile phase is observed although all samples are calcined at 550 °C. It could be attributed to the stabilizing effect of SBA-15 that enhanced the thermal stability of the anatase crystalline phase.
3.3 Raman spectroscopy
Raman spectra of all samples are shown in Fig. 3. Peaks at 149, 401, 519, and 645 cm−1 can be found in the spectra of all samples, except for DCQ. These peaks are assigned to the Eg(1), B1g(1), A1g (or B1g(2)), and Eg(3) modes, respectively. Meanwhile, there are no bands at 268 and 601 cm−1, which correspond to the TiO2 rutile phase.28,38,39 This observation is consistent with the above XRD results, indicating clearly that only the anatase phase of TiO2 is present in these samples. Furthermore, the intensities of these four peaks increase with increasing TiO2 loadings. Other peaks at 291, 1199, 1229, 1311, 1571, 1595, and 1650 cm−1 in Fig. 3f–j is regarded as characteristic bands of DCQ.40 In particular, bands at 1311, 1571, and 1650 cm−1 can be assigned to the coupled ring vibration, aromatic vibration, and CO stretching vibration of the quinacridone groups in DCQ.
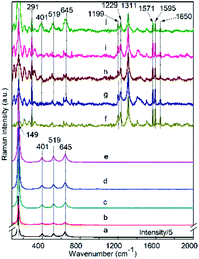 |
| | Fig. 3 Raman spectra of the photocatalysts: (a) TiO2; (b)–(e) 10, 20, 30, 40% TiO2/SiO2; (f) DCQ; (g)–(j) DCQ-10, 20, 30, 40% TiO2/SiO2. | |
3.4 TEM
Some TEM images of SBA-15 and DCQ-X% TiO2/SiO2 samples are selected and shown in Fig. 4. Other images are presented in the ESI (Fig. S1–S9†). The long-range ordering and hexagonally arranged pores of SBA-15 can be well recognized in Fig. 4A. The regular morphology is maintained in the samples of DCQ-10% TiO2/SiO2 (Fig. 4B). The symmetry of local structure gradually decreases with increasing TiO2 contents (Fig. 4D–F). Fig. 4C also confirms the anatase crystal structure of TiO2 particles. The lattice spacing (d) is ∼0.35 nm between adjacent lattice planes. This matches well the distance between the (1 0 1) crystal planes of anatase TiO2.23 The anatase phase of TiO2 shows generally strong photocatalytic behaviour in various reactions, for example, the decomposition of methylene blue in aqueous solutions.28 Hence, good photocatalytic performance is expected with the presence of anatase TiO2 in the samples presented in this work.
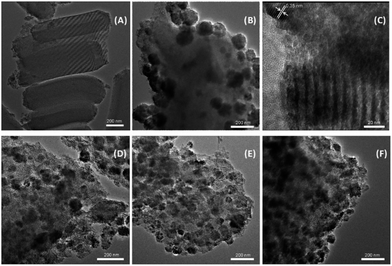 |
| | Fig. 4 TEM images of (A) SBA-15 and (B–F) DCQ-X% TiO2/SiO2 samples: (B, C) X = 10, (D) X = 20, (E) X = 30, and (F) X = 40. | |
3.5 FT-IR
FT-IR spectra of the samples SBA-15, X% TiO2/SiO2, and DCQ-X% TiO2/SiO2 and their corresponding assignments are shown in Fig. 5 and Table S2.† The peak intensities of all X% TiO2/SiO2 and DCQ-X% TiO2/SiO2 samples at 960 cm−1 are obviously higher than that of SBA-15. It was reported that the incorporation of TiO2 into the framework of SBA-15 usually enhanced the intensity of the silanol shoulder (at 960 cm−1) of the νas (Si–O–Si) band;36 such enhancement of the peak intensity is also a strong evidence about the formation of Ti–O–Si bonds in all X% TiO2/SiO2 and DCQ-X% TiO2/SiO2 samples. At the same time, bands at 1550, 1469, and 1339 cm−1, which are characteristic of DCQ (Table S2†), can only be found in spectra of DCQ-X% TiO2/SiO2.
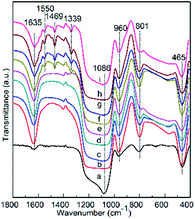 |
| | Fig. 5 FT-IR spectra of the samples: (a) SBA-15; (b)–(e) 10, 20, 30, 40% TiO2/SiO2, (f)–(i) DCQ-10, 20, 30, 40% TiO2/SiO2. | |
3.6 Elemental analysis and UV-vis DRS
In order to investigate the loadings of DCQ in the samples of DCQ-X% TiO2/SiO2, elemental analysis is performed and the results are shown in Table 1. The DCQ loadings in the samples range from about 3 to 5 wt%, the sequences are ranked in the following order: DCQ-30% TiO2/SiO2 > DCQ-20% TiO2/SiO2 > DCQ-40% TiO2/SiO2 > DCQ-10% TiO2/SiO2.
Table 1 Elemental analysis of SBA-15 and DCQ-X% TiO2/SiO2
| Samples |
C (wt%) |
N (wt%) |
H (wt%) |
DCQ loading (wt%) |
| SBA-15 |
0.525 |
0.150 |
0.976 |
— |
| DCQ-10% TiO2/SiO2 |
1.327 |
0.379 |
2.411 |
3.12 |
| DCQ-20% TiO2/SiO2 |
2.225 |
0.477 |
1.765 |
4.45 |
| DCQ-30% TiO2/SiO2 |
2.426 |
0.513 |
2.062 |
4.94 |
| DCQ-40% TiO2/SiO2 |
1.893 |
0.476 |
2.129 |
4.44 |
Fig. 6 presents the UV-vis diffuse reflectance spectra of SBA-15, TiO2, DCQ, and X% TiO2/SiO2 and DCQ-X% TiO2/SiO2. As shown in Fig. 6A, all samples show high absorbance in the ultraviolet region (200–400 nm) except for SBA-15. TiO2 has an adsorption edge at 376 nm. This is consistent with the value of anatase TiO2 reported in the literature.41,42 The adsorption edge of X% TiO2/SiO2 samples are slightly red shifted from 376 nm to 391 nm with increasing TiO2 contents. The red shift might be caused by the formation of Ti–O–Si chemical bonds41,43 during the in situ incorporation of TiO2. The absorption intensities of X% TiO2/SiO2 samples in the ultraviolet region are also found to be increased with increasing amounts of TiO2 incorporated. It can be observed from Fig. 6B that all DCQ-X% TiO2/SiO2 samples show broad and prominent absorbance in the visible light region of 450–600 nm. Obviously, this is the result of the sensitization of DCQ, which can further facilitate a more efficient utilization of simulated sunlight and improve the photocatalytic activity under full spectrum irradiation. It can also be seen the absorbance intensity of DCQ-X% TiO2/SiO2 in the region of 450–600 nm is consistent with the DCQ loadings in all the samples (Table 1). The band gap energies (Eg) of the samples can be estimated according to the empirical eqn (2)42,44 and the results are shown in Table S3.†
where
Eg is the energy gap and
λg is absorption threshold. Table S3
† shows that the incorporation of TiO
2 into SBA-15 and the sensitization of the samples with DCQ can get the band gap of TiO
2 narrowed, although the effect is not significant.
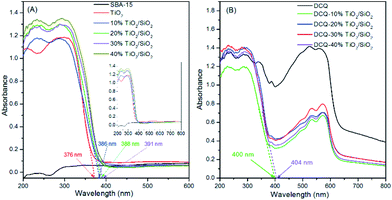 |
| | Fig. 6 UV-vis DRS of (A) SBA-15, TiO2, X% TiO2/SiO2 and (B) DCQ, DCQ-X% TiO2/SiO2 (X = 10, 20, 30,40). | |
3.7 Photocatalytic degradation
The photocatalytic degradation efficiency (D%) of imidazolium ionic liquids were tested and shown in Fig. 7. It can be seen that D% of [BMIM]Br within 180 min is only 10 with SBA-15 in the blank experiment. D% of [BMIM]Br can reach about 65 to 75 with un-sensitized X% TiO2/SiO2 catalysts under simulated sunlight irradiation. This indicates that TiO2 incorporated into the composites acts as photocatalytic active site and plays an important role on the photodegradation. It is well known that the irradiation (especially the UV irradiation according to DRS results) on the active sites of TiO2 will generate conduction-band electrons (e−) and valence band holes (h+), which react with H2O2 to produce ˙OH radicals. Both valence band holes and ˙OH radicals are highly oxidative and can degrade organic compounds quickly.17,45
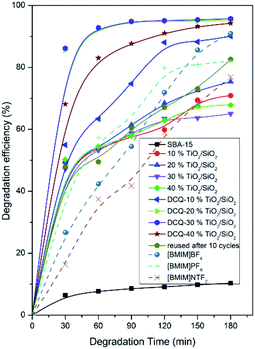 |
| | Fig. 7 Degradation efficiency of imidazolium ILs under simulated sunlight irradiation. Solid line: the photodegradation target was [BMIM]Br; dash line: DCQ-30% TiO2/SiO2 was used as the photocatalyst. | |
It is interesting to notice that the photodegradation performance is considerably improved when DCQ-X% TiO2/SiO2 is used as catalysts under simulated sunlight irradiation, D% of [BMIM]Br could reach 90–95 within 180 min. This can be explained by the sensitization of TiO2/SiO2 with DCQ, which can significantly enhance the utilization of solar light and then improve the photodegradation efficiency. According to the results of UV-vis DRS, the enhancement and promotion is presumably due to the strong absorption of DCQ-X% TiO2/SiO2 samples in the visible-light region, rather than the band gap narrowing of TiO2. The similar result was also reported by Sun et al.41 when N–Ag–TiO2 catalyst was applied in photocatalytic oxidation of phenol solution under visible light irradiation. It can be seen from Fig. 7 that D% of [BMIM]Br remains above 80 even after 10 recycling use, which means the photocatalyst has satisfactory stability under simulated sunlight irradiation. Further, three other ILs were adopted to investigate the effect of water solubility on D%. It shows that the worse the water solubility, the lower the degradation efficiency, but D% of [BMIM]NTF2 can still reach up to nearly 77 within 180 min.
LC/MS was used to identify the intermediates of [BMIM] cation in the photocatalytic degradation process. Main peaks in the HPLC chromatograms (Fig. S10A†) are located at retention times of 2.6, 2.8, 2.9, and 3.4 min, which can be assigned to [BMIM]+ and its photodegradation intermediates (a–c, Fig. S10B–D†). The peak of [BMIM]+ disappears rapidly during degradation; meanwhile, the peak intensity of intermediate (a) increases from 30 to 60 min and then decreases from 60 to 180 min. These trends indicate that intermediate (a) is produced first during the degradation reaction and is then degraded continuously in the photocatalytic process. While peak intensities of intermediates (b) and (c) gradually increase from 30 to 180 min. Based on the above analysis, the mechanism of [BMIM]+ photocatalytic degradation is proposed in Scheme S1† and can be presented as follows: [BMIM]+ is firstly oxidized to 1-butyl-3-methylimidazolidine-2,4,5-trione (a), and then degraded to 2-oxo-2-ureidoacetic acid (b) and butyric acid (c) by ring-opening. And the compound of (b) and (c) will be finally mineralized to CO2, H2O etc.
4. Conclusions
In this study, the photocatalysts TiO2/SiO2 and DCQ-TiO2/SiO2 are prepared using in situ synthesis and dye sensitization. The results of TEM, XRD analysis, Raman spectroscopy, elemental analysis and UV-vis diffuse reflectance spectra clearly show the formation of TiO2–SiO2 mixed oxides in the TiO2/SiO2 and DCQ-TiO2/SiO2 samples. TiO2 in the samples is pure anatase without secondary crystal phase of brookite or rutile. Results of Raman, FT-IR and UV-vis DRS also indicate that DCQ is successfully incorporated into DCQ-TiO2/SiO2. The photocatalysts are then used in the degradation of imidazolium ionic liquids. The degradation experiments show that dye sensitization of TiO2/SiO2 with DCQ can enhance the photodegradation efficiency by over 20%. Around 95% of [BMIM]Br can be degraded within 180 min with the use of DCQ-TiO2/SBA-15 as photocatalyst under simulated sunlight irradiation. The dye-sensitized photocatalysts can thus be applied efficiently in the degradation of ILs, e.g. for treating spillage of ILs. The dye sensitized catalysts are expected to be applicable for the degradation of other contaminants in aquatic environments. Such applications are under investigation.
Acknowledgements
This study is performed with the financial support of the National Natural Science Foundation of China (Grant No. 21006035 and 21676099), and the Fundamental Research Funds for the Central Universities, South China University of Technology.
Notes and references
- W. Zhu, P. Wu, L. Yang, Y. Chang, Y. Chao, H. Li, Y. Jiang, W. Jiang and S. Xun, Chem. Eng. J., 2013, 229, 250–256 CrossRef CAS.
- Y. Yu, J. Mai, L. Huang, L. Wang and X. Li, RSC Adv., 2014, 4, 12756–12762 RSC.
- Y. Yu, J. Mai, L. Wang, X. Li, Z. Jiang and F. Wang, Sci. Rep., 2014, 4, 5997 CrossRef CAS PubMed.
- J. Neumann, C. Cho, S. Steudte, J. Koser, M. Uerdingen, J. Thoming and S. Stolte, Green Chem., 2012, 14, 410–418 RSC.
- J. Ma, L. Cai, B. Zhang, L. Hu, X. Li and J. Wang, Ecotoxicol. Environ. Saf., 2010, 73, 1465–1469 CrossRef CAS PubMed.
- J. McFarlane, W. Ridenour, H. Luo, R. Hunt, D. DePaoli and R. Ren, Sep. Sci. Technol., 2005, 40, 1245–1265 CrossRef CAS.
- T. Thuy Pham, C. Cho and Y. Yun, Water Res., 2010, 44, 352–372 CrossRef PubMed.
- K. Docherty and J. Kulpa, Green Chem., 2005, 7, 185–189 RSC.
- M. Matzke, S. Stolte, K. Thiele, T. Juffernholz, J. Arning, J. Ranke, U. Biermann and B. Jastorff, Green Chem., 2007, 9, 1198–1207 RSC.
- C. Pretti, C. Chiappe, D. Pieraccini, M. Gregori, F. Abramo, G. Monni and L. Intorre, Green Chem., 2006, 8, 238–240 RSC.
- J. Ranke, A. Müller, U. Weber, F. Stock, S. Stolte, J. Arning, R. Störmann and B. Jastorff, Ecotoxicol. Environ. Saf., 2007, 67, 430–438 CrossRef CAS PubMed.
- P. Stepnowski, A. Skladanowski and A. Ludwiczak, Hum. Exp. Toxicol., 2004, 23, 513–517 CAS.
- H. Zhou, Y. Shen, P. Lv, J. Wang and J. Fan, Sep. Purif. Technol., 2013, 104, 208–213 CrossRef CAS.
- E. Siedlecka, S. Stolte, M. Gołębiowski, A. Nienstedt, P. Stepnowski and J. Thöming, Sep. Purif. Technol., 2012, 101, 26–33 CrossRef CAS.
- E. Siedlecka, M. Gołębiowski, Z. Kaczyński, J. Czupryniak, T. Ossowski and P. Stepnowski, Appl. Catal., B, 2009, 91, 573–579 CrossRef CAS.
- E. Siedlecka, W. Mrozik, Z. Kaczynski and P. Stepnowski, J. Hazard. Mater., 2008, 154, 893–900 CrossRef CAS PubMed.
- P. Stepnowski and A. Zaleska, J. Photochem. Photobiol., A, 2005, 170, 45–50 CrossRef CAS.
- A. Morawski, M. Janus, I. Goc-Maciejewska, A. Syguda and J. Pernak, Pol. J. Chem., 2005, 79, 1929–1935 CAS.
- R. Katoh and K. Takahashi, Radiat. Phys. Chem., 2009, 78, 1126–1128 CrossRef CAS.
- X. Li, J. Zhao, Q. Li, L. Wang and S. Tsang, Dalton Trans., 2007, 1875–1880 RSC.
- E. Bosse, L. Berthon, N. Zorz, J. Monget, C. Berthon, I. Bisel, S. Legand and P. Moisy, Dalton Trans., 2008, 924–931 RSC.
- G. Le Rouzo, C. Lamouroux, V. Dauvois, A. Dannoux, S. Legand, D. Durand, P. Moisy and G. Moutiers, Dalton Trans., 2009, 6175–6184 RSC.
- J. Schneider, M. Matsuoka, M. Takeuchi, J. Zhang, Y. Horiuchi and D. Bahnemann, Chem. Rev., 2014, 114(19), 9919–9986 CrossRef CAS PubMed.
- J. Chao, Z. Xie, X. Duan, Y. Dong, Z. Wang, J. Xu, B. Liang, B. Shan, J. Ye, D. Chen and G. Shen, CrystEngComm, 2012, 14, 3163–3168 RSC.
- J. Yu, W. Ho, J. Yu, H. Yip, P. Wong and J. Zhao, Environ. Sci. Technol., 2005, 39, 1175–1179 CrossRef CAS PubMed.
- J. Di, S. Li, Z. Zhao, Y. Huang, Y. Jia and H. Zheng, Chem. Eng. J., 2015, 281, 60–68 CrossRef CAS.
- J. Yang, J. Zhang, L. Zhu, S. Chen, Y. Zhang, Y. Tang, Y. Zhu and Y. Li, J. Hazard. Mater., 2006, 137, 952–958 CrossRef CAS PubMed.
- Y. Acosta-Silva, R. Nava, V. Hernández-Morales, S. Macías-Sánchez, M. Gómez-Herrera and B. Pawelec, Appl. Catal., B, 2011, 110, 108–117 CrossRef CAS.
- M. Tototzintle, I. Oller, A. Ramírez, S. Malato and M. Maldonado, Chem. Eng. J., 2015, 273, 205–213 CrossRef.
- C. Shen, Y. Wang, J. Xu and G. Luo, Chem. Eng. J., 2015, 277, 48–55 CrossRef CAS.
- G. Li and X. Zhao, Ind. Eng. Chem. Res., 2006, 45(10), 3569–3573 CrossRef CAS.
- G. Wittmann, K. Demeestere, A. Dombi, J. Dewulf and H. Van Langenhove, Appl. Catal., B, 2005, 61, 47–57 CrossRef CAS.
- W. Yue, C. Randorn, P. S. Attidekou, Z. Su, J. T. S. Irvine and W. Zhou, Adv. Funct. Mater., 2009, 19, 2826–2833 CrossRef CAS.
- W. Jung, S. Baek, J. Yang, K. Lim, M. Lee, G. Lee, S. Park and S. Hong, Catal. Today, 2008, 131, 437–443 CrossRef CAS.
- M. Mazaj, W. Stevens, N. Logar, A. Ristić, N. Tušar, I. Arčon, N. Daneu, V. Meynen, P. Cool, E. Vansant and V. Kaučič, Microporous Mesoporous Mater., 2009, 117, 458–465 CrossRef CAS.
- S. Das, M. Bhunia and A. Bhaumik, J. Solid State Chem., 2010, 183, 1326–1333 CrossRef CAS.
- H. Yang, H. Lin, Y. Chien, J. Wu and H. Wu, Catal. Lett., 2009, 131, 381–387 CrossRef CAS.
- R. Zukerman, L. Vradman, L. Titelman, L. Zeiri, N. Perkas, A. Gedanken, M. Landau and M. Herskowitz, Mater. Chem. Phys., 2010, 122, 53–59 CrossRef CAS.
- M. Alvaro, C. Aprile, M. Benitez, E. Carbonell and H. García, J. Phys. Chem. B, 2006, 110, 6661–6665 CrossRef CAS PubMed.
- F. Schulte, K. Brzezinka, K. Lutzenberger, H. Stege and U. Panne, J. Raman Spectrosc., 2008, 39, 1455–1463 CrossRef CAS.
- H. Sun, G. Zhou, S. Liu, H. Ang, M. Tadé and S. Wang, Chem. Eng. J., 2013, 231, 18–25 CrossRef CAS.
- A. Police, S. Basavaraju, D. Valluri, V. Muthukonda, S. Machiraju and J. Lee, Chem. Eng. J., 2014, 247, 152–160 CrossRef CAS.
- J. Li, S. Zhou, G. Hong and C. Chang, Chem. Eng. J., 2013, 219, 486–491 CrossRef CAS.
- J. Xu, K. Li, W. Shi, R. Li and T. Peng, J. Power Sources, 2014, 260, 233–242 CrossRef CAS.
- P. Wang, T. Zhou, R. Wang and T. Lim, Water Res., 2011, 45, 5015–5026 CrossRef CAS PubMed.
Footnote |
| † Electronic supplementary information (ESI) available. See DOI: 10.1039/c7ra04939k |
|
| This journal is © The Royal Society of Chemistry 2017 |
Click here to see how this site uses Cookies. View our privacy policy here.  Open Access Article
 *a,
Chao Fub,
Haiyang Guoa and
Xuehui Lia
![[thin space (1/6-em)]](https://www.rsc.org/images/entities/char_2009.gif) :
:![[thin space (1/6-em)]](https://www.rsc.org/images/entities/char_2009.gif) 30, v/v) was used as the mobile phase. The flow rate was set to be 1 mL min−1. The degradation efficiency (D%) was then calculated according to eqn (1):
30, v/v) was used as the mobile phase. The flow rate was set to be 1 mL min−1. The degradation efficiency (D%) was then calculated according to eqn (1):


